2 TECHNIQUES IN THE ASSESSMENT OF THE LEFT VENTRICULAR FUNCTION
Faculté de Médecine Alexis Carrel, Lyon, France
Institut de Physique de Constantine, Algérie
2.1. THE CARDIAC PUMP
The heart is a muscular pump that functions by periodic changes of shape caused by stresses induced by the myocardial fibers. It provides by far the greatest part of the force required for the blood circulation. It is very roughly conical in form. The organ consists of right and left channels. Each consists of two chambers, a thin-walled atrium behind, which receives blood through veins and a comparatively thick-walled ventricle in front, which delivers blood into a large artery arising from its upper posterior part. The posterior part of the septum separates the two atria and is called the interatrial septum, while the anterior part intervenes mainly between the two ventricles and is called the interventricular septum (Figure 1). The Left Ventricle (LV) extends from the Atrioventricular (AV) orifice, forwards, downwards, and to the apex of the heart (Figure 2). Because the peripheral resistance offered by the systemic circulation is considerably greater than that of the pulmonary circulation, its wall is some three times as thick as the Right Ventricle (RV). The thickness of the interventricular septum corresponds to that of the other left ventricular walls. It bulges markedly towards the right and consequently the lumen of the LV is approximately circular in cross-section (Figure 3). The RV lumen is crescenic in cross-section (Figure 3) and RV is shorter so that its anterior part does not reach the apex of the heart (Figure 1).
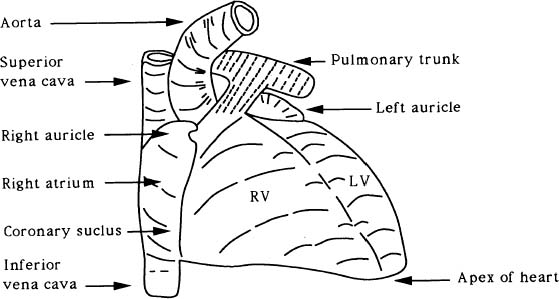
Figure 1. The external form of the heart (sternocostal surface).
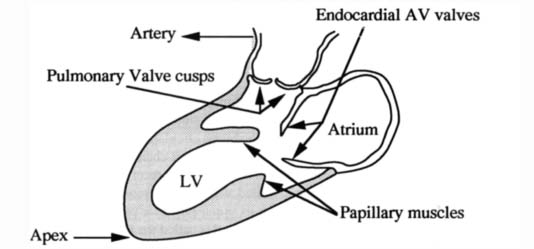
Figure 2. Heart valves in ventricular diastole.
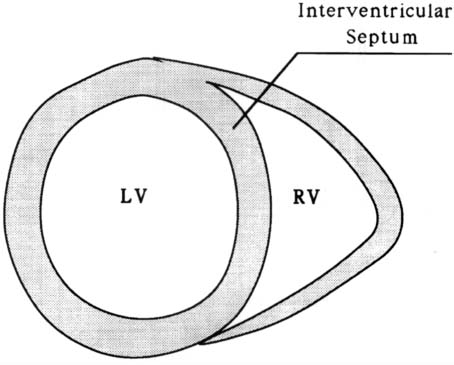
Figure 3. Vertical section of the heart.
During blood circulation, the right atrium receives deoxygenated blood from the systemic circulation through three veins: the superior vena cava carrying blood from the upper part of the body, the inferior vena cava draining the abdomen and the lower limbs, and the coronary sinus draining the heart itself. The blood then passed successively through the right AV orifice, the RV, and the pulmonary orifice and is carried by the pulmonary trunk and the two pulmonary arteries to the pulmonary circulation. The blood takes up oxygen from, and gives up carbon dioxide to, the air within the alveoli of the lungs, and returns to the left atrium through the two pulmonary veins on each side. After passing successively through the left AV orifice, the LV and the aortic orifice, it is carried into the systemic circulation once again through the aorta.
The cardiac cycle involves successive periods of contraction (systole) and relaxation (diastole) of the cardiac muscle. During ventricular systole, the rising pressures in the chambers first close the AV valves. Soon afterwards, the interventricular pressures reach sufficient levels to open the aortic and pulmonary valves, and the ventricles empty their blood into the arteries, the pulse expanding the elastic arterial walls. Meanwhile, the atria in diastole are passively filled with blood flowing into them from the veins. As the ventricles pass into diastole, their internal pressures fall sharply, and the elastic recoil of the arterial walls forces blood back towards the ventricles and closes the aortic and pulmonary valves. As ventricular diastole continues, the atria are also still in diastole. Blood from the full atria opens the AV valves and passes through the AV orifices into the ventricles. When the greatest part of the atrial contents has passed passively into the ventricles in this way, the transfer is completed and the ventricles are fully filled by a short atrial systole. Atrial systole is followed after a short interval by a ventricular systole and the cycle is repeated.
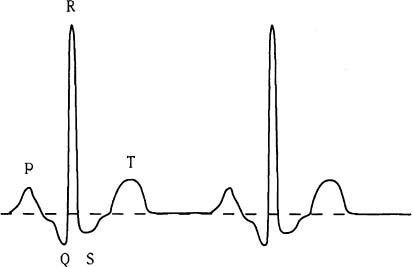
Figure 4. Electrocardiogram signal.
The electrical changes occuring in the myocardium during each cardiac cycle are represented by a signal known as an electrocardiogram. This normally, consists of a regular repetition of a number of waves and peaks (Figure 4). The P wave represents atrial systole and the QRS complex the slightly asynchronous contractions of different parts of the ventricles. The T wave reflects the repolarisation of the ventricular muscle. The duration of the P-R interval is a measure of the time taken for the impulse to pass over the atria and along the AV conducting tissue. The interval between the end of the S wave and the beginning of the T wave corresponds closely to the period of maximal ejection during ventricular systole.
The performance of the heart is measured by its capacity to eject, at each systolic phase, the blood volume adapted to the organism’s needs. This performance is, essentially, governed by three principal factors: (a) the preload, which may be equated with the ventricular end-diastolic fiber length, (b) the afterload, which is closely related to the intra myocardial systolic tension, and (c) the contractile or inotropic state of the myocardium.1 The measurement of the stroke volume (i.e., the amount of blood ejected), the ventricular end-diastolic volume and pressure, the systolic ejection time and the Ejection Fraction (EF) permit to evaluate the cardiac performance. However, the value of these measurements is limited in the assessment of the myocardial contractility (which measures the contraction intensity) since they are influenced by alterations in the inotropic state1 and also greatly affected by alterations in preload and afterload. Thus, the quantification parameters of the contractility should be preload and afterload insensitive.2
Heart failure refers specifically to a compromised contractile state of the LV which is accompanied by a forward flow inadequate to accommodate the needs of the peripheral circulation.3 The overall left ventricular systolic performance is inversely related to the force opposing ventricular fiber shortening (i.e., afterload) and this myocardial property is important in interpreting variables of left ventricular shortening in patients suspected having contractile abnormalities.4 The reduction in contractile state and the decreased slope of the isovolumetric force-length relationship accounts for the decline in both the extent and rate of fiber shortening for any condition of length or load.3 This attenuation in shortening implies that the slope of the shortening-length relationship is also reduced.3 Translated into terms of heart’s function as a pump, stroke volume, EF and ejection rate will be reduced. The depression in the maximal force-length values itself represents a reduction in the heart’s systolic reserve.3
Studies on both animals and humans have suggested that the end-systolic pressure-volume relationship is linear over a physiologic range of loading conditions and is a sensitive indicator of left ventricular contractile function.5–8 This linear model, originally, proposed by Suga and Sugawa9,10 is described by the relation

where P(t) is instantaneous pressure inside the LV and V(t) is the Left Ventricular Volume (LVV). Vo(t) is the volume below which the ventricle can no longer generate pressure. Although Vo varies with time from its end-diastolic value (often referred to as “unstressed volume”) to its end-systolic value, it varies little near end-systole and can be treated as constant.8 The changes in Vo may be significantly small or large in diseased hearts. For example, a concentrically hypertrophied ventricle may have a smaller Vo, whereas a chronically volume-overloaded heart may have a Vo considerably larger than normal.6 The LV is considered as an elastic chamber whose elastance E(t) changes with time. This parameter is an important descriptor of the LV. It increases progressively throughout isovolumetric contraction and left ventricular ejection and then subsequently decreases during isovolumetric relaxation. The maximum elastance that is achieved, Emax, represents the slope of the end-systolic pressure/volume line and has been shown to correlate well with measures of contractility.5 This approach to the analysis of the left ventricular function is hindered by two impediments.8 First, to measure Emax and Vo of the end-systolic pressure-volume relationship, it is necessary to obtain pressure-volume data in a given patient under multiple left ventricular loading conditions without provoking changes in contractility. However, the serial assessment of pressure-volume relationships under changing loading conditions at the present time is difficult with the standard techniques. While the volume data are easily obtained, those of pressure are only obtained invasively. The second impediment is the precise definition of the end-systolic phase. Consequently, the elastance measure is hindered by the need of an invasive technique. It has been shown that there is a positive correlation between Emax and EF.5 The elastance Emax is a better index of contractility than the EF although this last one can be achieved more easily.
Global parameters of left ventricular function like EF or volume of LV have been shown to provide important prognostic informations in heart disease11 and in the evaluation of the cardiac performance. The EF is highly reproducible and provides prognostic informations in patients with coronary artery disease.12–17 The LVV is one of the most important prognostic factors after acute myocardial infarction.18,19 An ideal method for the determination of these parameters should be safe, rapid, noninvasive and easily reproducible both at rest and during exercise. Several invasive and noninvasive methods have been reported, none of which can be considered ideal for this purpose.11 Several techniques are widely used: single and biplane contrast angiography, X-ray computed tomography, M-mode and two-dimensional echocardiography, radionuclide angiography using firstpass studies or gated blood-pool ventriculography and magnetic resonance imaging.11
2.2. CARDIAC ANGIOGRAPHY
Since their discovery by Röntgen in 1890, X-ray shadowgraphs have found an increasingly important role in clinical diagnosis. In cardiology, the chest roentgenogram provides a valuable information about the structure and function of the heart and thoracic blood vessels. Imaging of the coronary arteries and the LV chamber by X-ray technique are currently performed in clinical routine. Since, X-rays reflect the variation of electron density in biological tissues, the physiological function is studied by the invasive introduction of a contrast medium. Thus, to visualize the LV chamber (Angiography), the contrast medium is injected through a catheter (Catheterization) which passes across the aortic valve into the LV while the heart is exposed to X-radiation. During the cardiac cycle, rapid sequence-radiographs (Angiogram) are obtained. The contrast medium filled ventricle is directly measured from the film, during systole and diastole, producing an EF based on changes in LV size. The angiographic procedure is mostly unjustified simply for determination of EF. However, the procedure is often performed along with an angiographic study of the coronary arteries or a cardiac catheterization for study of valvular diseases.20
2.2.1. Catheterization
As reported by Cournand,21 catheterization was first performed (and so named) by Claude Bernard in 1844. The investigation of cardiovascular physiology in animals has led to the development of important techniques and principles including pressure manometry and the application of the Fick principle for measuring cardiac outputs, which are subsequently applied to patients with cardiac disease.22
An objective of cardiac catheterization is to assess accurately the forces, and therefore the pressure waves, generated by various cardiac chambers. The information obtained by this technique may be invaluable in the assessment of the LVF. Furthermore, it may yield informations that will be crucial in defining the need for cardiac surgery as well as its timing, risks and anticipated benefit in a given patient.22
The catheterization is defined as a combined hemodynamic and angiographic procedure. To perform this procedure, one must take into account the risk of the operation, the consent of the patient and the anticipated value of the information obtained.22 The procedure is performed using one of the two approaches: catheterization by direct exposure of an artery (brachial vessels …) or catheterization by percutaneous puncture (including transseptal catheterization).23 The first approach allows a greater catheter control and a greater selection of catheters. However, this approach can rarely be repeated more than once or twice with safety. In contrast, the second approach, which does not require arteriotomy and arterial repair, can be performed repeatedly in the same patient.23
The catheters used are of various diameters, types, lengths and design. Most of them are constructed of Dacron, Polyethylene or Polyurethane. The diameter of a catheter is expressed in Frencha (F) unit. For example, the diameters of the catheters called Gensini, NIH, pigtail, Lehmand and Sones are 7F, 8F, 8F, 8F and 7.5F respectively. The common used catheter for left-heart catheterization is the pigtail catheter, which has multiple side holes and one end hole, and can be used for angiography as well as for pressure measurement. The Sones catheter is designed specifically for coronary arteriography but may also be used for left ventriculography. The Lehman catheter is particulary helpful when dealing with tortuous subclavian artery or stenotic aortic valve. In general, the choice of a catheter size should be suited to the patient’s anatomy and the diameters of the catheters vary from 5F to 10F.
For left-heart catheterization, an appropriately selected catheter is inserted into the brachial or femoral artery. This catheter is then advanced into the ascending aorta just above the aortic valve. Once in the ascending aorta, central aortic pressure is measured and recorded simultaneously with arterial monitor pressure. The catheter is then advanced across the aortic valve into the LV. Once the LV has been entered, it is advisable to immediately obtain simultaneous recordings of critical pressures such as left ventricular, peripheral arterial (through the arterial monitor line) pressures etc …
2.2.2. Angiocardiography
Angiocardiography has been used to define the anatomy of the ventricles and related structures and serves as a tool in the study of patients with congenital and valvular heart disease.24 With increasing frequency, this technique has also been used to evaluate ventricular function, especially to establish prognosis and select patients for coronary artery and valvular surgery.24 Left ventriculography, which is an essential part of cardiac catheterization, is performed in most patients with known or suspected cardiac disease. It provides important information about the functions of the LV myocardium, the competence of aortic and mitral valves and the presence and location of ventricular aneurysms. Furthermore, it demonstrates anatomical details of the ventricular chamber and associated valves. The left ventriculography procedure is performed from an arterial approach by passing a catheter across the aortic valve into the LV. To achieve adequate opacification of the LV, a relatively large bolus of contrast material is delivered in a relatively short time. The injection rate depends on the size of the LV and the clinical status of the patient.
Digital Substraction Angiography is a method necessitating the injection of smaller quantities of contrast agent and still provides excellent resolution. This method utilizes injection into a peripheral vein, pulmonary artery, or LV.25 The image acquired before contrast injection (the mask) is substracted from the image obtained after injection. The resulting image represents the structures or regions of interests that one wishes to visualize and quantify.
Quantitative angiocardiography may be carried out using large film or cine techniques (Cineangiocardiography), and as biplane or single plane. Cineangiocardiography provides a larger number of sequential observations per unit of time (30 to 60 frames). It allows appreciation of movement and dynamic events through the cardiac cycle and television visualization with filming.24 The components required in cineangiocardiography include an X-ray generating system, an image intensifier and an image recording system consisting of a video camera, video tape and a cine camera.
2.2.2.1. Generator
The X-ray generator contains a transformer to provide the high voltage necessary to accelerate electrons in the X-ray tube. It also contains another transformer to provide low voltage to heat the tube filament or cathode.
2.2.2.2. X-rays
X-rays are a form of electromagnetic radiation. To produce X-rays, the target of an X-ray tube is bombarded with electrons of high energy. These electrons strike orbital electrons in the inner shells of the target atoms and eject them from their orbits. The vacancy created in an inner orbit is filled by an electron from an outer orbit and this transition is accompanied by emission of an X-ray photon. When the high energy electron does not strike an electron of the target and passes close to the nucleus, it decelerates with change of direction. This deceleration results in X-ray photon emission called “Bremsstrahlung”.
2.2.2.3. Image Intensifier
The radiographic image intensifier is a high-gain device for imaging X-ray photons. This device converts the X-ray image into a visible picture of brightness enough to be viewed by a television camera or photographed. The image intensifier and the X-ray tube move in tandem to allow the patient to remain in stationary position and does not have to be subjected to uncomfortable and time consuming repositioning.26
2.2.2.4. X-ray Image
In conventional radiography, a patient is placed in front of an X-ray source which transmits radiation through the subject’s body. The photons enter the patient where they may be scattered, absorbed or transmitted without interaction. The formed image or “shadow” is a projection of the attenuating properties of all the tissues along the paths of the X-rays. It is a twodimensional (2D) projection of the three-dimensional (3D) distribution of the X-rays attenuating properties of tissues. Different tissue types in the body exhibit different densities with respect to X-ray radiation. To each tissue density is assigned a physical characteristic value μ(x, y, z), (x, y, z) being the cartesian coordinates. μ(x, y, z) is called the linear attenuation coefficient.
Suppose that the incident photons beam is parallel to the z axis and the image is recorded in the x – y plane. Furthermore, we assume that the image may be considered as a distribution of a an absorbed energy. In other words, each photon interacting in the photons detector is locally absorbed. If there are N photons per unit area incident on the patient and I (x, y)dxdy is the energy absorbed in area dxdy of the photons detector, then the image distribution function may be defined as follows:
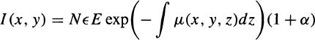
where the line integral is over all tissues along the path of the primary photons reaching the point (x, y), E is photons energy and є is energy absorption of the detector. α is the ratio of the scattered to primary radiation that is either measured or calculated.27 Note that the primary photons recorded form the image (information) and the scattered ones create a background signal which degrades the image contrast.
2.2.3. Projections
Conventional radiography is a limited diagnostic modality in the sense that it produces a 2D projection of a 3D object. However, one may use the adequate projections that provide maximal delineation of the heart structures and minimal overlapping from other structures.
2.2.3.1. Frontal View
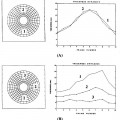
In frontal chest X-ray or Postero-Anterior (PA) view, the contour of the normal cardiac structures is predictably outlined against the lung (Figure 5a). The heart image is limited at the left side by the aortic arch, the trunk of the pulmonary artery and the LV, and at the right side by the super vena cava and the right atria. This projection allows to identify hypertrophy of the left cavities.
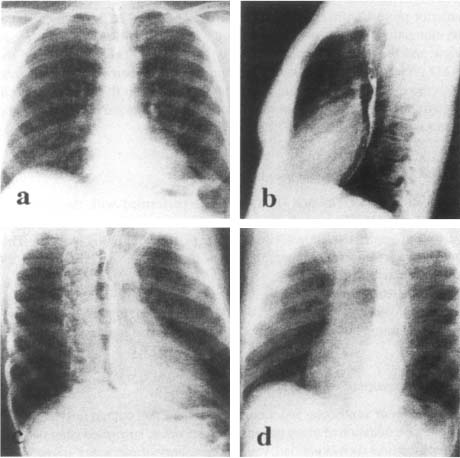
Figure 5. Different views used in conventional cardiology. (a): frontal view, (b): lateral view, (c): right anterior oblique view, (d): left anterior oblique view.
2.2.3.2. Lateral View
In the Lateral (LAT) view, the RV is border-forming in the subxyphoid area and generally extends superiorly about one-third of the distance between the diaphragm and the thoracic apex (Figure 5b). The anterior marging of the pulmonary artery and the ascending aorta lie above the RV.28 The left atrium forms a shallow convex bulge at the upper aspect of the posterior border of the heart. The normal LV is a long convexity at the posterior-inferior heart border just above the diaphragm.
2.2.3.3. Right Anterior Oblique View
The Right Anterior Oblique (RAO) is performed with the patient in 45° right anterior projection in relation to the film (Figure 5c). In this view, there is an elongation of the ventricles so that the long axis of the ventricles are in view and the atrioventricular groove is in profile.28 The advantage of the RAO projection is to eliminate overlapping of the ventricle and spine and puts the mitral ring in profile. This view is helpful to the angiographer in determining the presence or absence of mitral and tricuspid regurgitation and stenosis.
2.2.3.4. Left Anterior Oblique View
The Left Anterior Oblique (LAO) view is performed with the patient in the 60° oblique (Figure 5d). This view obviates overlapping of the aortic valve and spine and allows visualisation of the ventricular septum. This projection is a useful angiographic view to diagnose the presence of LV enlargement.
In some cases, it may be advisable to perform ventriculography in two separate projections. For example, both RAO and LAO (biplane angiography) may be required in the evaluation of suspected ventricular aneurysm.24
2.2.4. Assessment of Ventricular Function
Assessment of ventricular function, performance and contractility is important in the evaluation of many patients with known or suspected heart disease. Thus, measures such as preload, ventricular volume, dimensions, intracardiac pressures, wall stress and fractional shortening are necessary.
2.2.4.1. Left Ventricular Volume
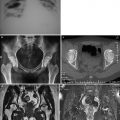
Measurement of ventricular volume is a standard technique to assess LV function. One of the most widely used approach for calculating LV volume is the area-length method introduced by Dodge et al.29 They have suggested that the ellipsoid is the most representative figure for the LV and that the dimensions of this figure can be determined from angiograms taken in perpendicular planes (Figure 6). In this method, LAT and Antero-Posterior (AP) projections (Figure 7) of the LV outline are used to compute the volume, using the formula:
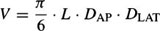
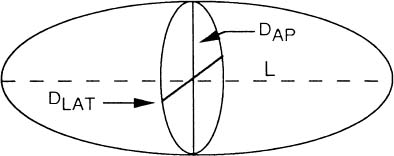
Figure 6. Ellipsoid model used to calculate left ventricular volume.
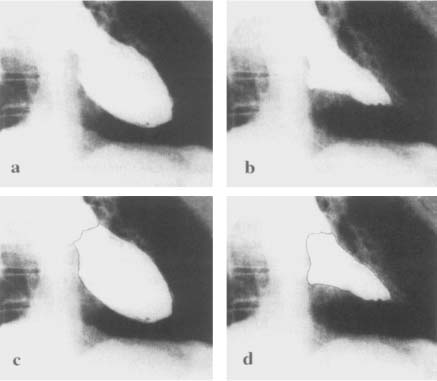
Figure 7. The anteroposterior (a) and lateral (b) biplane angiocardiograms. The left ventricular cavity is outlined in black on the anteroposterior (c) and lateral (d) views.
L is the longest length in centimeters in AP or LAT projections of the ventricular chamber (i.e., from the apex to the root of the aortic valve). DAP, and DLAT are the diameters (minors axes) of the ventricle calculated from the AP and LAT projections. The L, DAP, DLAT are magnified by virtue of divergent X-ray beams, and therefore must be corrected before substitution into the volume relation. The diameter D from each plane (i.e., LAT or AP) is calculated as follows:

A is the area of the opacified LV cavity and can be conveniently determined by a hand or electronic planimeter and X-Y plotter. The calculation of A is made for images exposed in both AP and LAT projections.
The LV contours obtained from angiographic image30–32 by manual tracing may be derived by automatic techniques. Manual tracing is tedious and time consuming and dependent on the technical skill of the operator. Thus, some automatic methods of varying difficulty and complexity have been proposed for computer generation of LV contours from digital angiographic images.33–38
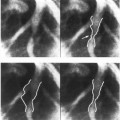
In practice, biplane angiograms are obtained in the 30° RAO and 60° LAO projections. Thus, LV volume is calculated using the following formula:39
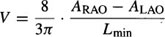
where Lmin is the shorter L value in RAO or LAO projection (Figure 8), and ARAO and ALAO are the areas of the opacified LV in RAO and LAO respectively.
The LV volume is estimated for each image of the cardiac cycle. ED and ES are selected as the largest and smallest volumes respectively. The LV Stroke Volume (SV) is defined as the difference between ED Volume (EDV) and ES Volume (ESV) and the EF as the ratio between SV and EDV:

2.2.4.2. The Ventricular Pressure-Volume Relation
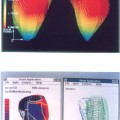
Additional information can be obtained concerning the functional characteristics of the LV by relating LV volume to LV pressure (Figure 9) recorded during or immediately prior to angiocardiography.40 Characteristic changes in the LV pressure-volume loops occur in various disease states. The pressure-volume diagram reflects the phases of the cardiac cycle beginning at ED and followed by isovolumic contraction, systolic emptying, isovolumic relaxation and diastolic filling. The area subtended by the systolic portion of the curve provides a measure of stroke work performed by the LV during systole, whereas the area subtended by the diastolic limb provides a measure of diastolic work performed on the LV by distending it during diastole.39
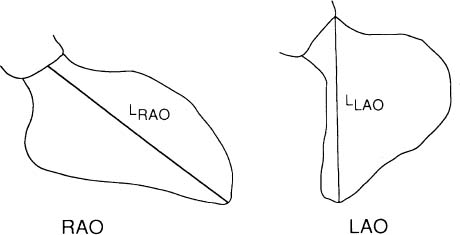
Figure 8. Diastolic left ventricular silhouettes of right anterior and left anterior obliques cineangiograms.
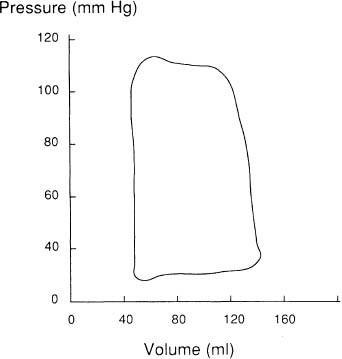
Figure 9. Simultaneous pressure and volume measurements are related to construct a pressure-volume diagram.
2.2.5. Ventricular Wall Motion
LV contractile abnormalities can be an important manifestation of coronary artery disease. These wall motion changes may represent ischemia or infarction of myocardium.41 The quantification of the extent of regional wall motion abnormalities may help in determining the myocardial effects of coronary disease. Contrast angiography and other imaging techniques permit study of ventricular wall motion. In current clinical practice, wall motion can be appreciated by visual inspection of cineventriculograms. The poor reproducibility of such an evaluation had led to the development of quantitative methods that measure the extent of wall motion at different points around the endocardial contour (Figure 10).42–45
2.2.6. Conclusion
Angiocardiography is a standard method for evaluating LV function. This method is a routine part of the cardiac catheterization. It is an accepted technique for measuring ventricular cavity volumes and intraventricular pressures. However, this procedure is invasive and not free of discomfort or risk and most importantly, it is usually not suitable for repeated applications at close intervals in the same patient. Furthermore, angiographic contrast medium may affect the LVF. The immediate hemodynamic effects include increases in cardiac output, LV ED pressure and pulmonary capillary wedge pressure.
2.3. COMPUTED TOMOGRAPHY
A problem with conventional X-radiography is the loss of depth information. The 3D anatomical structure is collapsed or projected into a 2D film. With the introduction of Computed Tomographic (CT) X-ray technique,46 the interest of X-ray methods has immediately been increased. In X-ray CT, a planar slice of the body is defined and X-rays passed through it only in directions that are contained within and are parallel to the plane of the slice. The resulting image shows the human anatomy in section with a good spatial resolution and density (linear attenuation) distribution of better than 1%.47 The CT scan consists of a series of 2D axial slices of an organ (e.g., heart) which may be stacked to form a 3D representation. The acquisition of this 3D representation is done noninvasively. CT imaging modality is based on the same physical principle than that of the conventional radiography.
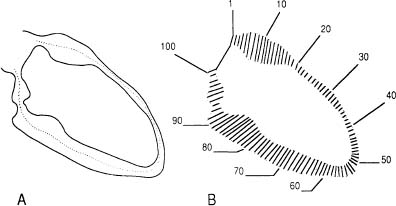
Figure 10. Centerline technique of regional wall motion analysis. (A) End-diastolic and end-systolic left ventricular endocardial outlines and centerline generated automatically midway between the two contours. (B) Motion is measured along 100 chords constructed perpendicular to the centerline.
In a common X-ray CT configuration, there are an X-ray source and an array of X-ray detectors. These two elements are connected in a fixed collinear arrangement forming a gantry. The source-detector combination measures parallel projection one sample at a time by stepping linearly across the patient. After each projection, the gantry rotates to a new position for the next projection. The gantry rotation allows the acquisition of line integrals of tissue density along multiple paths. In general, the gantry is rotated a full 180° around the patient with a sufficient number of density measurements collected to reconstruct the anatomical cross-section. The most well-known reconstruction method in CT is the standard Filtered BackProjection (FBP). This method performs image reconstruction from X-ray (line integral) projection data. Once each slice is reconstructed, using FBP algorithm, the resulting slices are stacked to form the 3D representation. For example, usually 10 to 12 tomographic slices are needed to encompass the heart entirely.
2.3.1. CT Image Reconstruction
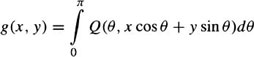
The CT image reconstruction consists of determining the density distribution g(x, y) in the x – y plane, given some subset of projections p(θ, t) in the plane. p(θ, t) is the value of the integral along the line passing through (t cos θ, t sin θ) in the direction normal to θ and is given by:
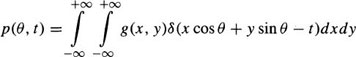
where δ is the Dirac function. With a sufficient number of projections collected between zero and π, the function, g(x, y), can be correctly reconstructed by backprojecting filtered versions of the projections.48 The filtered projections are given by:
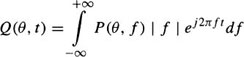
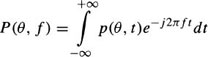
where P(θ, f) is the Fourier transform of p(θ, t) given by
The operation of backprojection for reconstructing slice data set, g(x, y), is described by
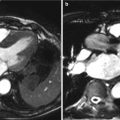
An example of a heart cross-section reconstructed slice is shown in Figure 11. To each element (pixel) in the slice matrix is assigned a CT number which is a measure of the density, with respect to water, of the tissues located in this point.
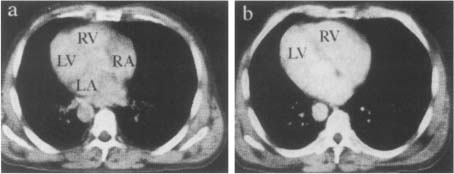
Figure 11. Heart cross-sections reconstructed by FBP algorithm. X-ray CT scan at the level of the sinus of Valsalva (a). X-ray CT scan where the septum is well visible between the two ventricles (b).
Thus, with the FBP reconstructed images, the volume of the organ scanned can be formed. This CT volumetric data sets can be obtained at high-speed with an X-ray CT scanner known as Dynamic Spatial Reconstructor (DSR).49 The DSR provides dynamic synchronous volume 3D CT images, every 1/60 seconds. This system consists of 14 X-ray sources mounted at 12 degree intervals around a circular gantry. A cone beam of X-rays is transmitted from each source to 2D detectors. In its highest temporal resolution mode, the DSR generates 14 projections through the cross-section of interest in 1/100 second, and repeated recording of new sets of 14 projections every 1/60 second.50
2.3.2. Cine-CT
CT scanning of the heart requires modification of the standard CT technique used for investigating anatomy characterized by little motion. Indeed, CT does not provide adequate information about moving structures due to mechanical limitations and time acquisition required. The shortest time needed to collect data transmitted from many angles of single rotating X-ray source is of the order of 1–2 seconds. During this lenght of time, the heart beats at least once and the CT reconstructions are therefore blurred.50 One approach to overcome the difficulties posed by the heart motion is the use of the “gated scanning technique”.51 The ECG gating methodologic strategy has enhanced the application of CT to cardiac investigation. This method involves recording the subject’s ECG during the length of time, generally spanning many heart cycles, for which projection data are recorded. Subsequent to scanning, those projections, recorded during different heart cycles but at the same instant of the cycle as determined from the ECG, are grouped together to reconstruct an image of the heart corresponding to the selected timepoint in the cardiac cycle.50 The fundamental assumption underlying this technique is that the 3D changes in location, size, shape and density of the cardiac structures are repeated in an identical, reproducible manner for many heart cycles. This assumption is of questionable validity in even healthy hearts, and is almost certainly invalid in the study of abnormal cardiac dynamics, which involve considerable beat-to-beat variability.50 Another approach to this problem is the ultrafast (Cine) CT scanner.52 This system permits to obtain scans at exposure times of 50 msec or less and can generate CT scans at multiple anatomical levels. The ultrafast scanning speed (50 msec/slice) has made CT a viable noninvasive modality to image cardiac structures. The Cine-CT scanner employs a scanning focused X-ray beam, which provides complete cardiac imaging in real time without the need for ECG gating. This CT system is not limited by the inertia associated with moving mechanical parts. It uses a focused electron beam that is successively swept across four cadmium tungstate target arcs.53 Each of the four targets generates a fan beam of photons that pass from beneath the patient to a bank of photon detectors arranged in a semicircle above the patient.
2.3.3. Evaluation of Cardiac Function
Measurement of LV EF is a widely utilized parameter of LV function that reflects the hemodynamics and prognosis of a variety of cardiovascular diseases. For this reason, there is much interest to determine LV EF accurately and provide the clinician with this valuable information. The accurate determination of EF necessitates precise measurements of ED and ES volumes. In angiocardiography, measurement of theses volumes is adversely affected by lack of sharpness of ventricular borders and varying spatial orientation of the LV. Furthermore, the use of single geometric reference (ellipsoid) to fill all possible ventricular shapes may not be appropriate.52
Related posts:
Stay updated, free articles. Join our Telegram channel

Full access? Get Clinical Tree


