INFECTIONS AND NONINFECTIOUS INFLAMMATORY DISORDERS: GENERAL MORPHOLOGY, CELLULITIS, ABSCESS, AND SUPPURATIVE ADENITIS
KEY POINTS
- The basis of the “inflammatory morphology” as seen on anatomic imaging studies is presented.
- The inflammatory morphology is nonspecific but useful in directing clinical thinking and imaging interpretation.
- The inflammatory morphology is best modeled by acute and subacute pyogenic infections but is shared by several other infections, noninfectious inflammatory diseases, and some neoplasms.
- The higher-grade patterns of disease seen here will be present in acute pyogenic infections and perhaps fungal infections, and the differential from a neoplasm is usually not difficult based on imaging and even less so when the clinical information is added.
- The lower-grade infections such as those that are partially treated or indolent fungal infections and noninfectious inflammatory diseases such as Wegener granulomatosis and Langerhans histiocytosis will more typically mimic malignancy (especially small round cell malignancies), and the differential may be more clear on the basis of imaging than it is based on the clinical situation.
- Pitfalls in the diagnosis of infectious and noninfectious inflammatory diseases versus neoplastic diseases exist and must be taken into account to produce the best possible interpretations.
- Pathophysiology of cellulitis, abscess, and suppurative adenitis is presented, and those entities are differentiated from one another.
- The effects of the pathophysiology of these conditions on their morphology as seen on computed tomography, magnetic resonance imaging, and ultrasound is presented.
- Relative value of imaging modalities in the evaluation of these conditions is considered.
GENERAL MORPHOLOGY
Inflammation is a general response of the body to a variety of disease processes. The gross morphology of the response will vary with the inciting agent, status of the immune system, intercurrent therapy, and time course of the disorder. These and other factors will influence the appearance of the inflammatory process on anatomic and physiologic imaging studies. This discussion will focus in particular on computed tomography (CT) and secondarily on magnetic resonance imaging (MRI) as the anatomic imaging studies used to evaluate the vast majority of these conditions. Ultrasound has a relatively limited role as an anatomic imaging study. Radionuclide studies are used to more physiologically assess the likelihood of infection and to monitor therapeutic response in highly selected cases. Also, inflammatory conditions cause problems with false-positive fluorine-18 2-fluoro-2-deoxy-D-glucose positron emission tomography (FDG-PET) studies in patients being studied for cancer detection or surveillance. In this discussion, mainly acute and subacute infectious diseases are used as the primary model of the morphologic changes seen with inflammation. Of course, similar or identical changes may be present in response to trauma and radiation therapy or associated with malignant tumors; those situations and others wherein the inflammatory morphology is held in common are discussed elsewhere.
Hallmarks of most head and neck soft tissues infection or inflammation are the changes in fat surrounding the muscles and other structures in the head and neck region.1,2 The surrounding fat planes will often appear swollen, especially in the subcutaneous regions where there is no resistance to expansion. Reticulated and linear densities of varying thickness are often visible within the fat (Figs. 13.1–13.6). These may be due to enlargement of existing fibrous septae, perilymphatic thickening, distention of lymphatic channels, or any combination of the three. The overlying skin is frequently thick and indistinct. Deeper fibrofatty spaces, such as the parapharyngeal space or those within the masticator space, are less distensible and frequently become completely obliterated by the inflammatory process (Fig. 13.5), even when relatively low grade (Fig. 13.3). If extensive enough, the inflammatory reactions may completely obliterate the more superficial fat planes (Fig. 13.4). More frequently, one can observe a thickened, irregular superficial fascia (platysma) in the neck and its equivalent in the face called the superficial musculoaponeurotic system (SMAS) (Fig. 13.6). On CT, the edematous fat will be increased in density, with the actual appearance often depending on the relative amounts of fat, edema, and exudate present (Figs. 13.1–13.6).2–4 For example, in thin patients, the edema may not even be apparent, whereas in heavier patients even small amounts will produce obvious changes early in the disease process. On T1-weighted (T1W) magnetic resonance (MR), the signal intensity of involved fat will be diminished, but subtle changes are more easily seen on CT (Figs. 13.6J and 13.7). Edematous fat may appear bright on T2-weighted (T2W) images, but the signal increase is not nearly as conspicuous as that in edematous brain.3,4 Short T1 inversion recovery (STIR) and fat-suppression techniques improve the detection of edema in fat and muscle on MR (Figs. 13.5 and 13.7).
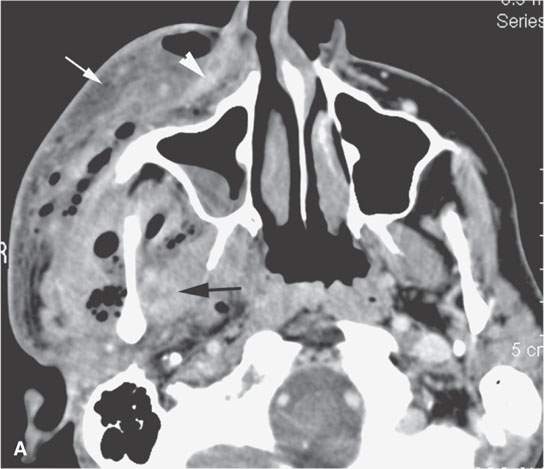
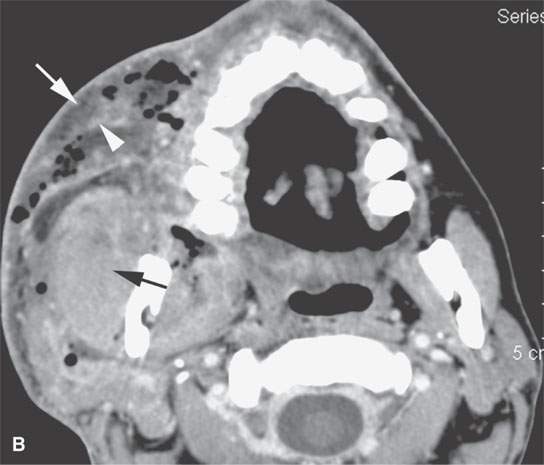
FIGURE 13.1. Contrast-enhanced computed tomography (CT) of necrotizing fasciitis as a model for the morphology of the inflammatory response as seen on CT. A, B: Subcutaneous and other edema (white arrows), thickening of the superficial musculoaponeurotic system (SMAS) layer (white arrowheads), and deeper muscles (black arrows). There are also general scattered areas of tissue necrosis admixed with gas.
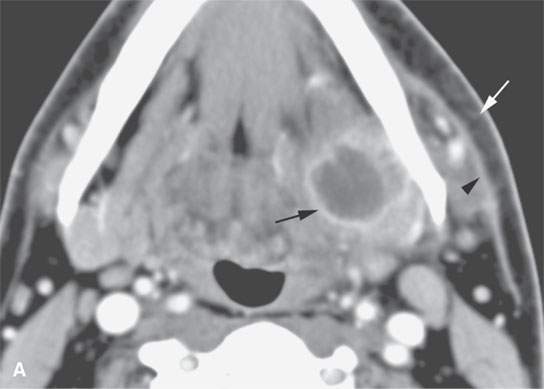
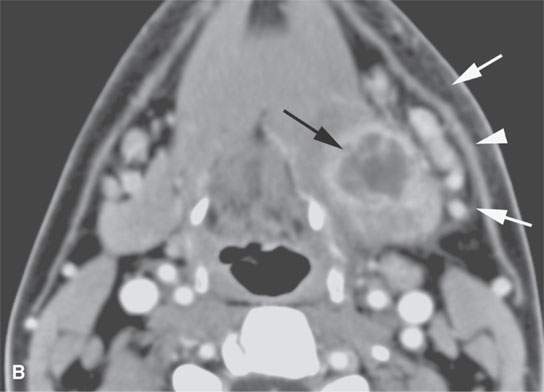
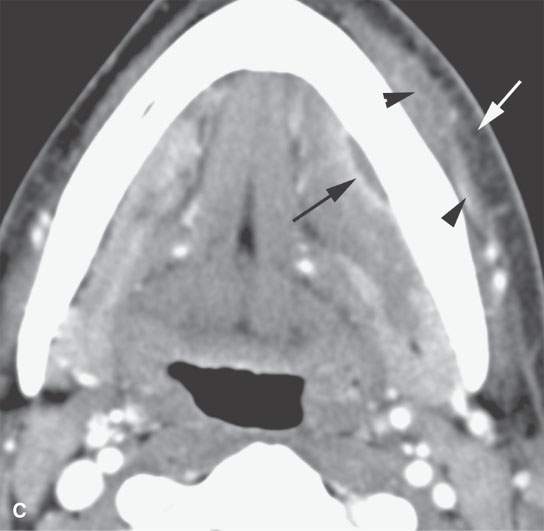
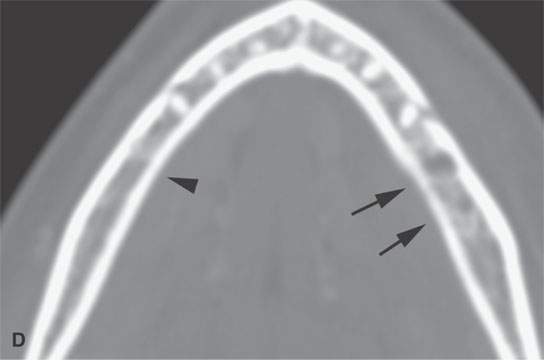
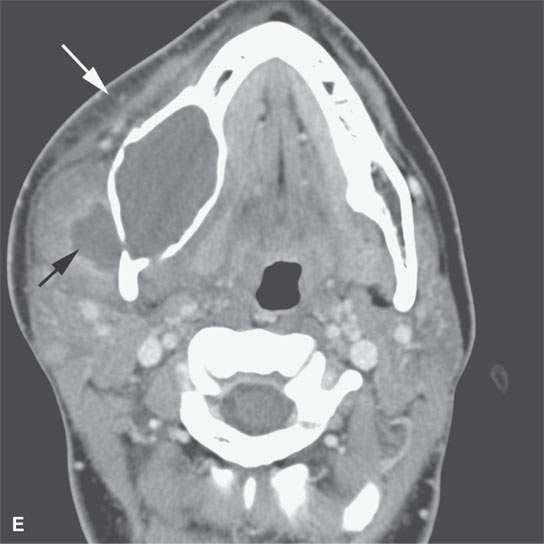
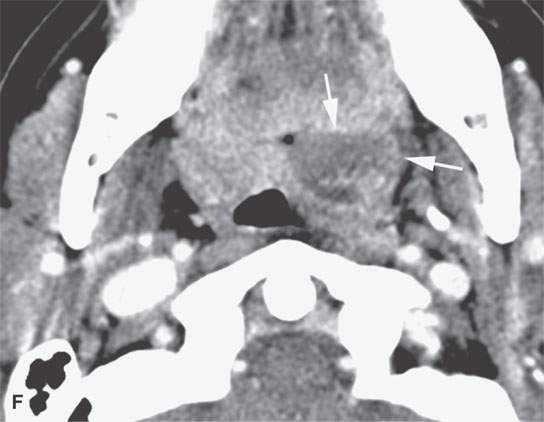
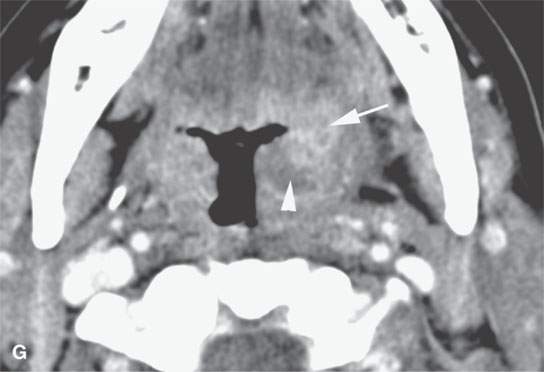
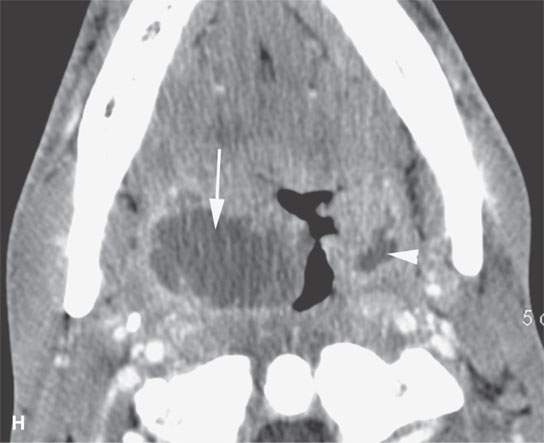
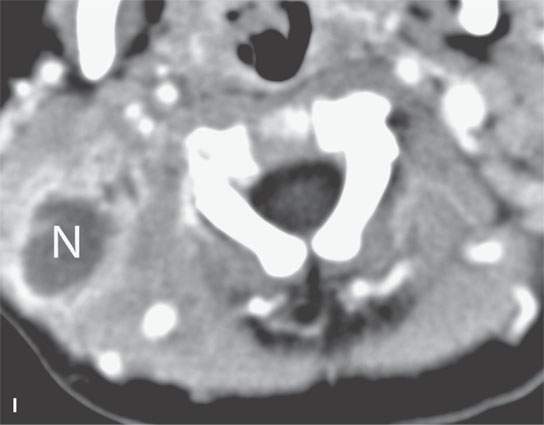
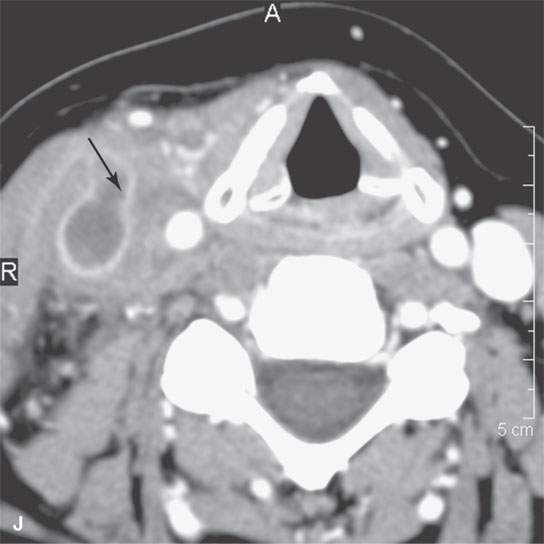
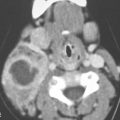
FIGURE 13.2. Contrast-enhanced computed tomography (CECT) images of abscesses and other infectious conditions that appear as abscess to illustrate the variable morphology of drainable collections of pus and a range of associated general inflammatory response/cellulitis. A, B: CECT of a dental origin abscess (black arrow) of the floor of the mouth and submandibular space with thickening of the superficial musculoaponeurotic system (SMAS) (arrowheads) and subcutaneous (white arrows) and other edema. C, D: CECT of a subperiosteal dental origin abscess (black arrow) of the floor of the mouth space with thickening of the SMAS (arrowheads) and subcutaneous (white arrows) and other edema as seen in (C) and (D) subtle periosteal bone erosion (arrows) compared to the normal side (arrowheads)E: CECT of an infected dentigerous cyst with an abscess in the masseter muscle (black arrow) and surrounding reactive changes (white arrow). F: CECT of a drainable tonsillar abscess with essentially no enhancement at its margins (arrows). G: CECT of a drainable tonsillar abscess with minimal to no enhancement at its margins with a cellulitic component (arrow) and an early, necrotic suppurative component (arrowhead). H: CECT illustrating how abscesses can compartmentalize themselves even within the same site of origin related to the existing spatial anatomy. There is a large drainable tonsillar abscess with well-developed enhancement at its margins (arrow) and a smaller left peritonsillar abscess (arrowhead). I: CECT of a suppurative level 5A lymph node (N) that has the morphology of an abscess but does not necessarily require drainage for treatment. J: CECT of pyogenic jugular thrombophlebitis that at first glance might mimic an abscess, buts its junction with the common facial vein (arrow) and conformance to the jugular vein anatomy (on many images not shown) confirms the correct diagnosis.
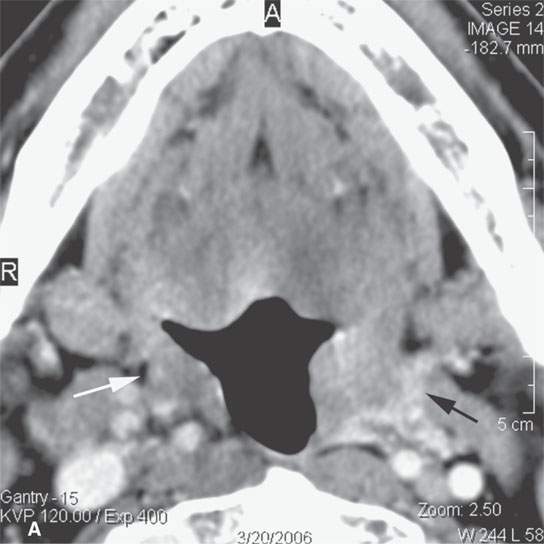
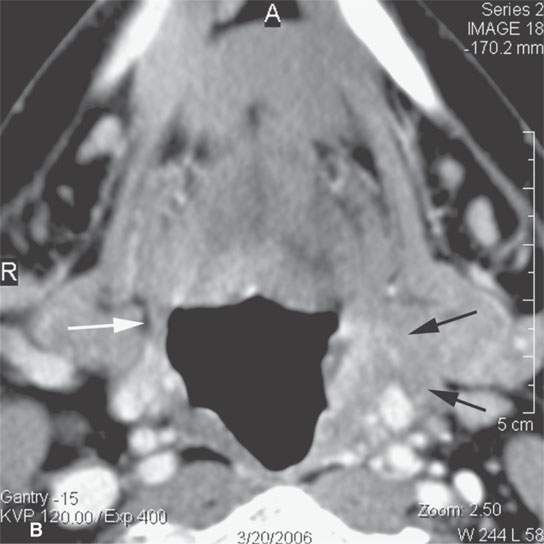
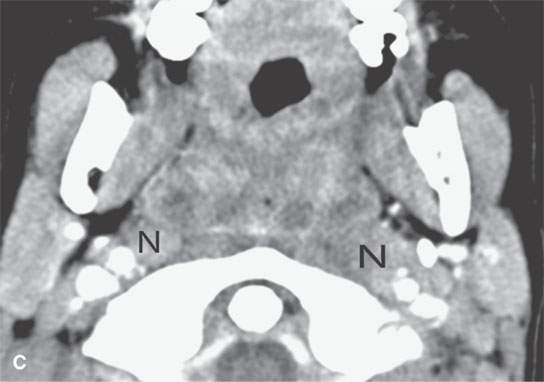
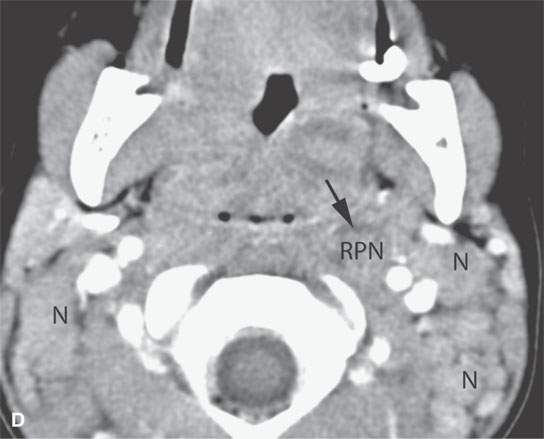
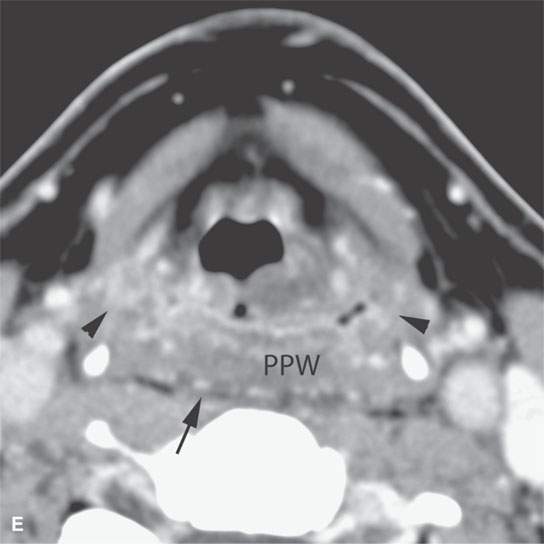
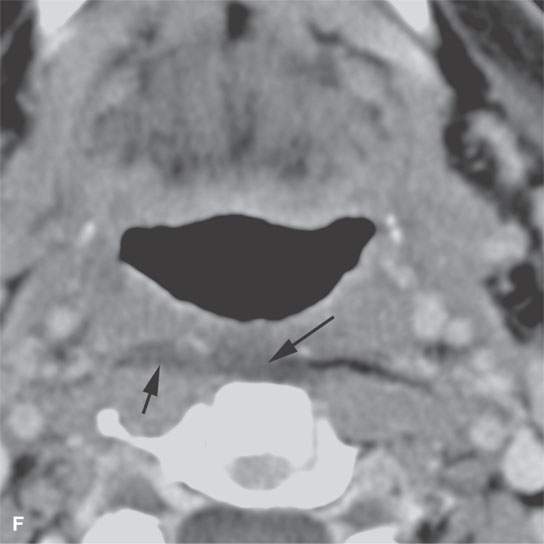
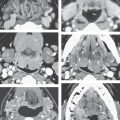
FIGURE 13.3. Contrast-enhanced computed tomography of relatively low grade inflammatory lesions to contrast with the changes as seen in Figures 13.1 and 13.2. A, B: Partially treated bacterial tonsillitis that causes loss of the parapharyngeal fat planes on the left side (black arrows) compared to the normal right side (white arrows) but shows little other evidence of associated inflammatory change and certainly no drainable pus. Such findings can mimic tonsillar carcinoma. C, D: Bacterial pharyngitis showing no obvious associated surrounding inflammatory morphologic changes, but the reactive retropharyngeal lymph nodes (N) as seen in (C) and as seen in (D) early suppurative (arrow) retropharyngeal node (RPN) and cervical reactive nodes (N) are the clues to the correct diagnosis. The study was done to exclude drainable pus the diagnosis of pharyngitis being known clinically. E, F: Candidiasis of the pharynx with subtle loss of fat planes lateral to the pyriform sinuses (arrowheads) and thickening of the posterior pharyngeal muscular wall (PPW). The only obvious sign of inflammatory change besides the pharyngeal wall swelling is the retropharyngeal edema (arrows). This is a useful sign of inflammation not often seen in neoplasms unless treated with radiotherapy.
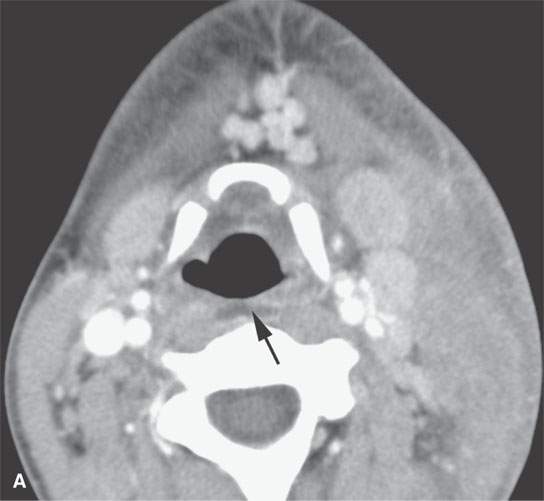
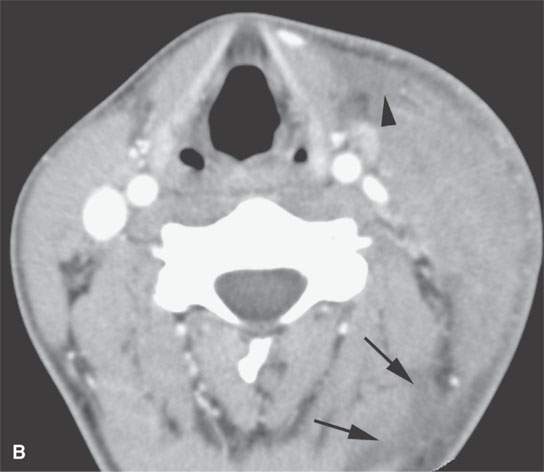
FIGURE 13.4. Contrast-enhanced computed tomography of a severe bacterial cellulitis showing a fairly classic inflammatory morphology involving both the superficial and deep tissue planes in (A) and (B). In (A), there is a small amount of retropharyngeal edema (arrow); in (B), edema can be seen deep to both the investing layer of cervical fascia (arrowhead) and the prevertebral fascia (arrows).
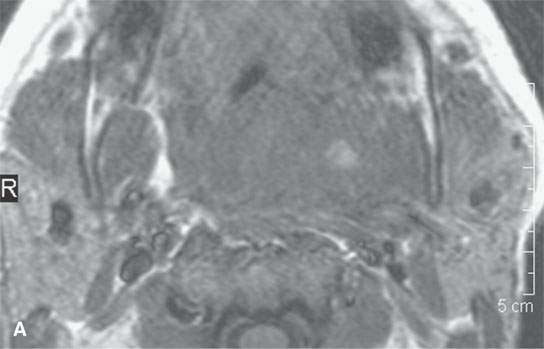
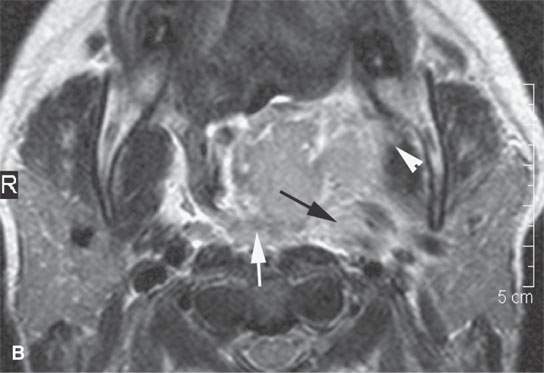
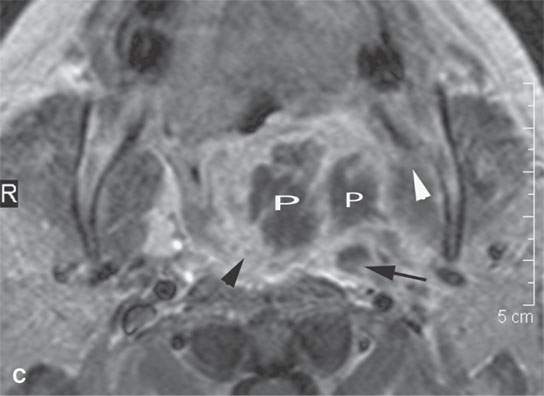
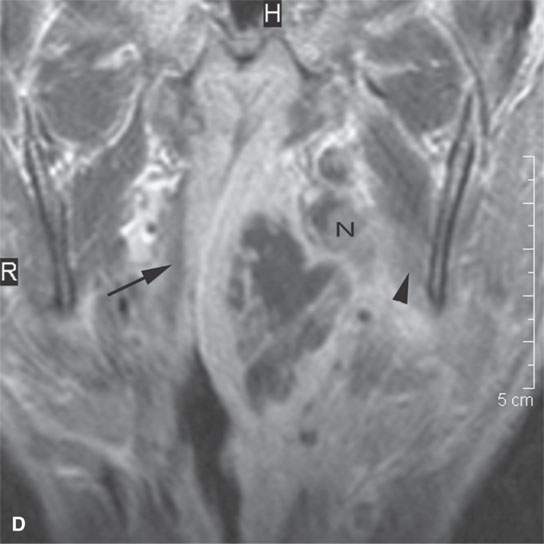
FIGURE 13.5. Magnetic resonance imaging of a patient with a severe tonsillar abscess. A: T1-weighted (T1W) non–contrast-enhanced image showing complete loss of tissue planes on the left but an otherwise uninformative image with regard to the nature of the pathology. B: T2-weighted (T2W) image shows no specifically defined drainable collection of pus, which becomes obvious in (C). It also shows transmural edema of the posterior pharyngeal wall (white arrow) and edema in the medial pterygoid muscle (white arrowhead) as well as a possible retropharyngeal lymph node that might be suppurative (black arrow). C: T1W contrast-enhanced image shows obvious drainable collections of pus (P) and likely a separate suppurative retropharyngeal node (black arrow). It also shows enhancement of the muscles shown to be edematous on the T2W sequence: the pterygoid (arrowhead) and those of the posterior pharyngeal wall (black arrowhead). D: T1W contrast-enhanced coronal is useful to appreciate the cephalocaudal extent of the abscess as well as the loss of the muscle signal of the left pharyngeal wall muscle compared to the normal on the right (arrow) and again shows the suppurative retropharyngeal lymph node (N) and medial pterygoid muscle enhancement (arrowhead).
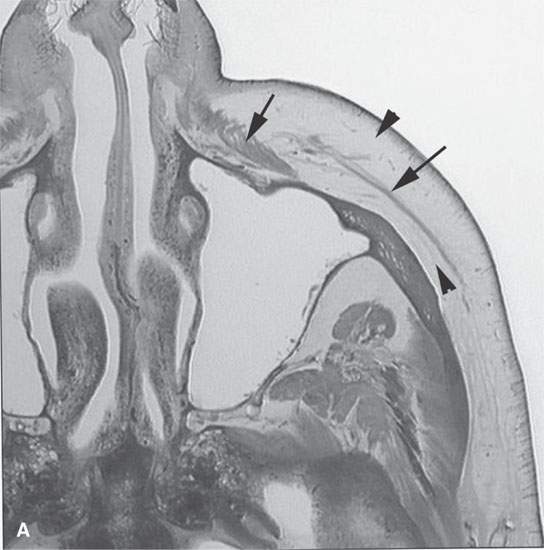
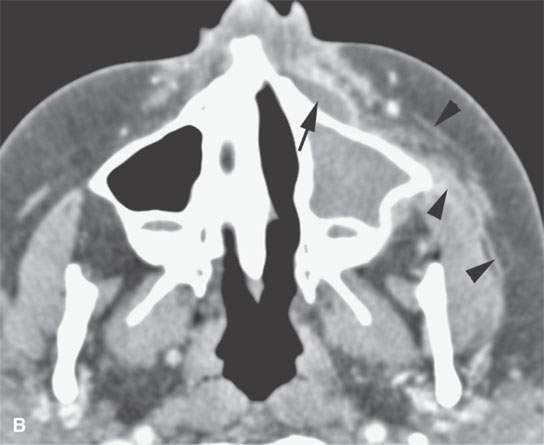
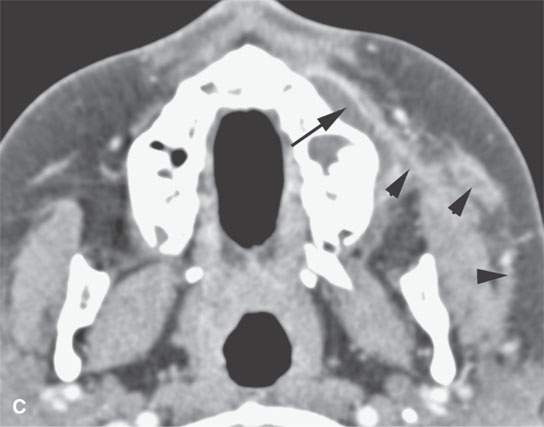
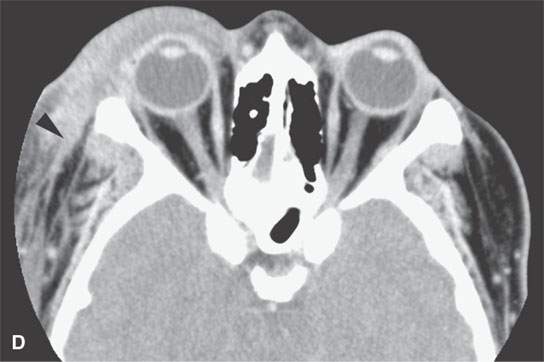
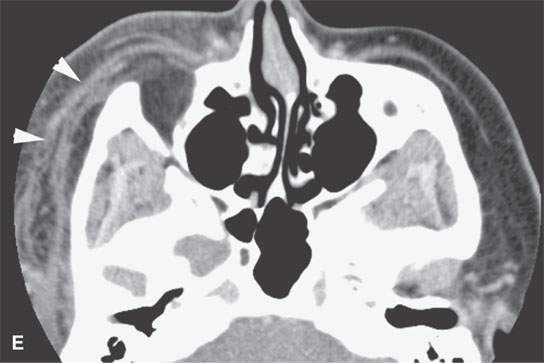
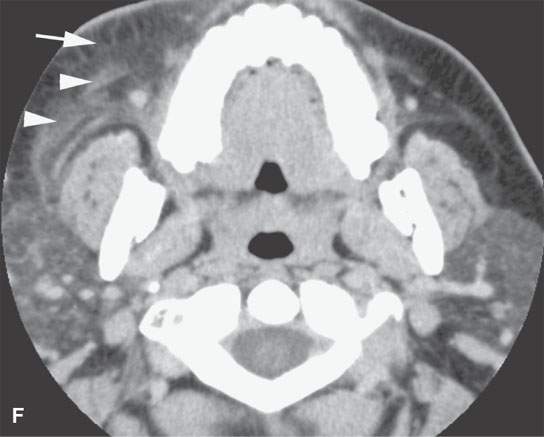
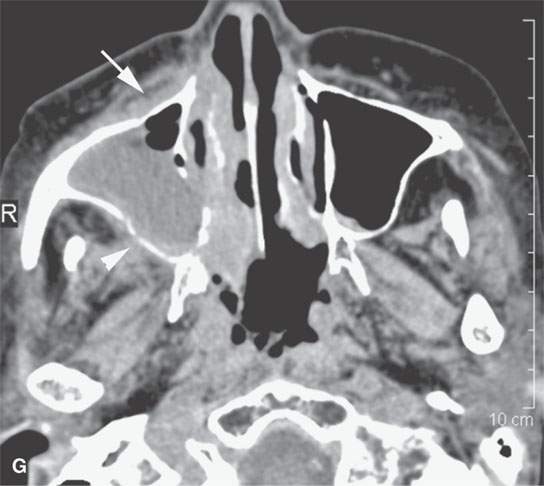
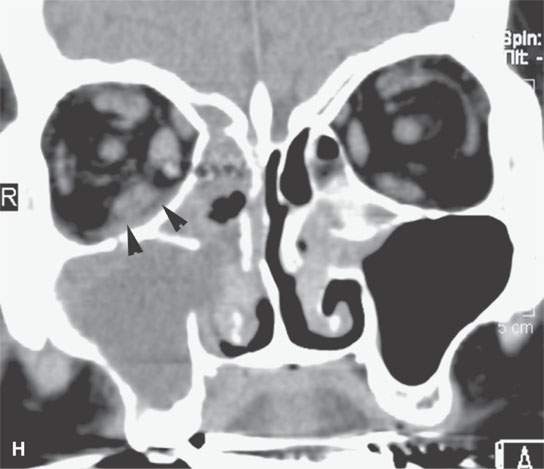
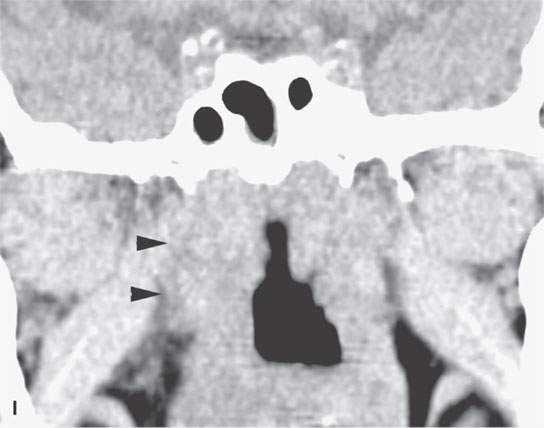
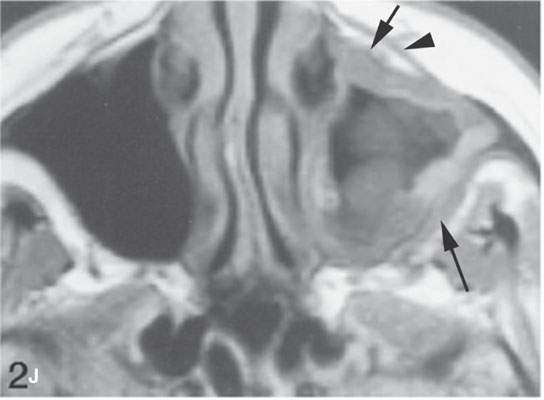
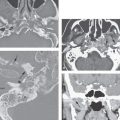
FIGURE 13.6. Anatomy and usefulness of the superficial musculoaponeurotic system (SMAS) in evaluation of inflammatory lesions. A: Whole organ section muscles within SMAS (arrows) and fat (arrowheads) superficial (subcutaneous) and deep to the SMAS. B, C: Contrast-enhanced computed tomography (CECT) of a subperiosteal dental infection shows the subperiosteal abscess (arrow) and secondary cellulitis along the SMAS (arrowheads). D–F: CECT of a preseptal cellulitis without definite lid abscess with extensive thickening of SMAS (arrowheads) and very well demonstrated edema along fibrous septations in the subcutaneous fat (arrow in F). G–I: CECT of an immune-compromised patient with invasive aspergillosis showing how changes deep to the SMAS are used to diagnose this inflammatory disease before bone destruction is present. There is thickening deep to the SMAS (arrow) anterior to the maxillary sinus as well as in the fat pad along the posterior to the sinus wall (arrowhead). The coronal section in (H) shows similar changes along the extraconal orbital fat (arrowheads). The infection also causes obliteration of the parapharyngeal part of the nasopharynx (arrowheads) in (I). J: Contrast-enhanced T1-weighted magnetic resonance imaging of an immune-compromised patient with invasive aspergillosis showing how changes deep to the SMAS are used to diagnose this inflammatory disease before bone destruction is present. There is soft tissue thickening (arrow) deep to the SMAS (arrowhead) anterior to the maxillary sinus as well as in the fat pad along the posterior to the sinus wall (arrow). Compare with the computed tomography case to realize how much easier these changes are to perceive on CT although fat-suppressed images would lessen this perceptive difference considerably.
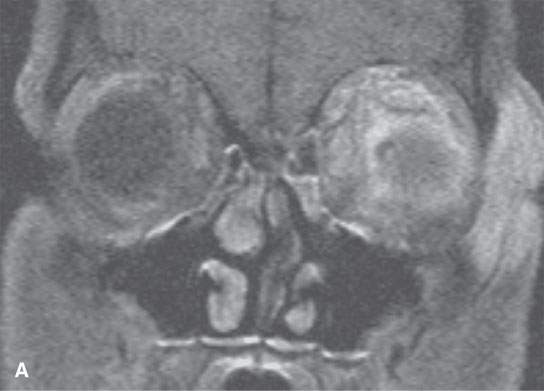
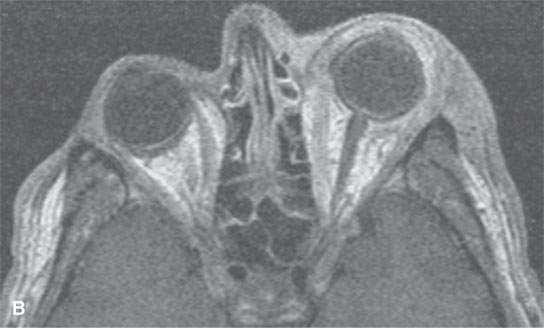
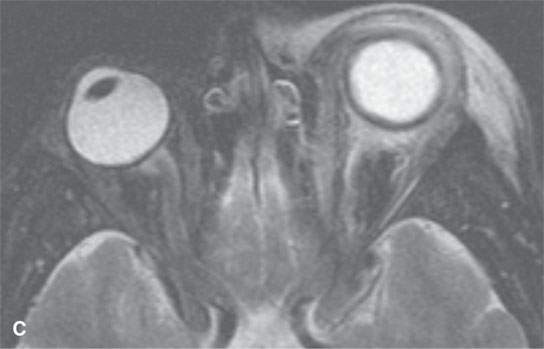
FIGURE 13.7. Magnetic resonance imaging of a patient with pre- and postseptal orbital cellulitis. A: T1-weighted fat-suppressed contrast-enhanced (CE) image shows generalized enhancement consistent with cellulitis and no drainable pus. B: T1-weighted CE image without fat suppression shows less contrast between the cellulitis and fat. C: T2-weighted fat-suppressed image shows the extent of cellulitis and edema but cannot exclude a drainable fluid collection (see also Fig. 13.5). It does provide superb contrast between the cellulitis and the fibrous and muscular tissues in the eyelid and shows the edema of the extraocular muscles, all of which is interesting but not clinically essential information.
Most inflammatory lesions have indistinct margins at their interface with surrounding soft tissues, even when the inflammation is localized (Figs. 13.1 and 13.8). Lower-grade or partially treated infection may not appear so indistinct at their interface with adjacent tissue, but there may be other signs of inflammation present such as edema in adjacent spaces and/or reactive adenopathy (Fig. 13.3). This is in part due to edema and/or exudate and in part to the vascular reaction seen with inflammatory response. The indistinct margins are most easily perceived at the borders between the lesion and fat on CT and non–contrast-enhanced T1W and fat-suppressed MR images (Figs. 13.5 and 13.7). Diffuse swelling of involved and surrounding soft tissues is another sign of inflammation (Figs. 13.1–13.7)
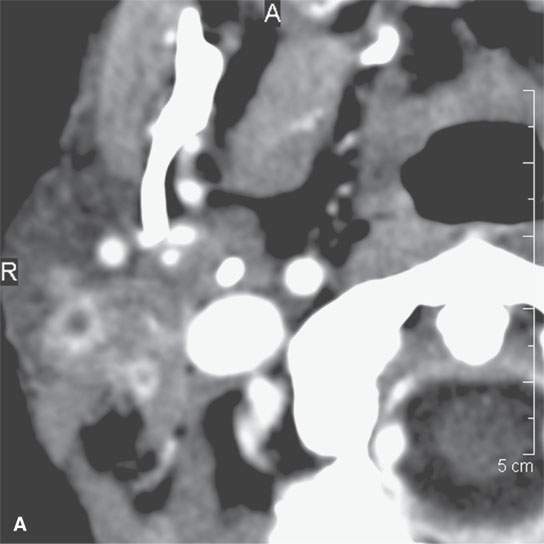
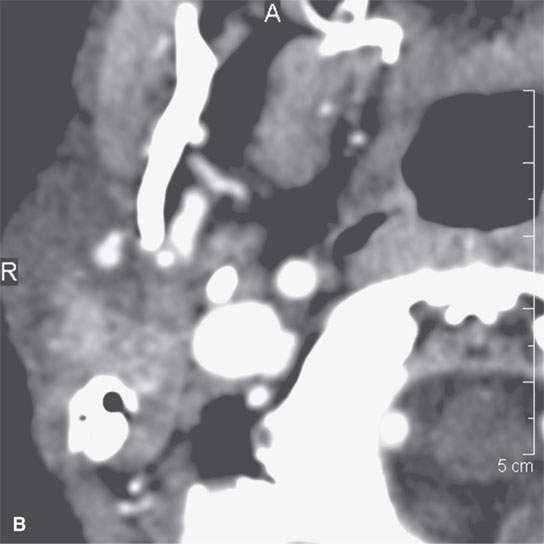
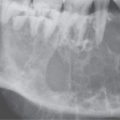
FIGURE 13.8. This patient had a low-grade parotid inflammatory process but presented as a parotid mass. While not definitive, the morphology of the lesion seen in (A) and (B) strongly suggests a focal sialadenitis, which was proven by a therapeutic day trial of antibiotics.
On CT and T1W MR, an inflamed muscle will appear obviously larger than on the unaffected side, but little obvious density change is noticeable.3–5 On T2W, STIR, or fat-suppressed MR images, edematous muscle will appear brighter than normal because of the increased water content (Figs. 13.5 and 13.7). Typically, T1W images, whether spin echo or gradient echo sequences, are less sensitive to muscle edema.
Many inflammatory reactions include a phase of increased vascularity either because of loss of autoregulation, increased capillary permeability, new capillary in growth, or all three.2,6 This can be demonstrated on contrast-enhanced magnetic resonance (CEMR) and contrast-enhanced computed tomography (CECT). Contrast will leak into inflamed tissues at a higher rate than normal tissue because of the abnormal capillary permeability (Fig. 13.9). As a result, a combination of diffuse and peripheral enhancement may be present in an abscess and surrounding cellulitis/phlegmon (Figs. 13.1–13.7).
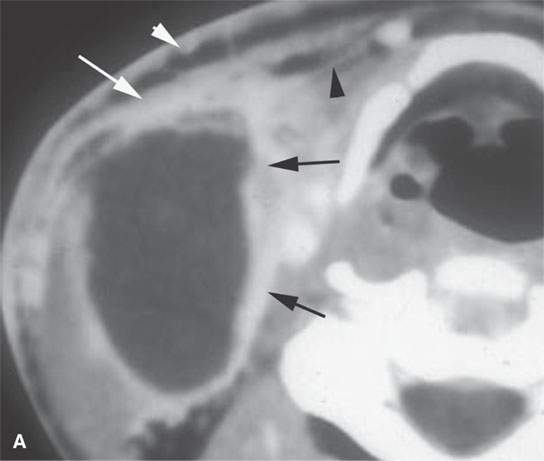
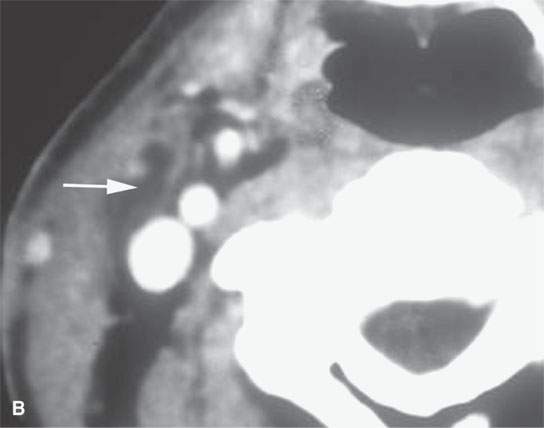
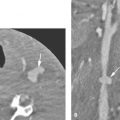
FIGURE 13.9. Contrast-enhanced computed tomography of an infected second branchial cleft cyst. A: Before treatment, the cystic mass has an obvious inflammatory morphology, including a thick enhancing rim (black arrows), thickening of the skin and subcutaneous fat (white arrowhead) and superficial fascia (white arrow), and thickening of some of the layers of investing cervical fascia (black arrowheads). B: Following 10 days of antibiotics, all of the inflammatory changes have resolved, leaving a small residual cyst that was excised (arrow).
Injured and inflamed tissue may go on to a chronic state of increased vascularity as seen on enhanced CT and MR studies. One of the better examples of this chronic, relative hypervascularity outside of head and neck imaging is the granulation tissue seen in association with herniated and/or operated discs. On imaging studies, the amount of contrast enhancement in any inflamed area may range from florid to quite subtle. Peripheral enhancement is typically very easy to appreciate on CT at the lesion–fat interface (Figs. 13.1 and 13.6) and is also usually easily discernible at the border of the rim enhancement and muscle (Figs. 13.2 and 13.9). The enhancing lesion–fat border is often less obvious on CEMR because both the enhancing margin and fat tends to be bright on non–fat-suppressed T1W images (Figs. 13.5 and 13.6J). On the other hand, changes due to enhancement within muscle may be more apparent on CEMR than CECT. Fat-suppression techniques, used in conjunction with CEMR, improve overall performance of MRI helping to demonstrate enhancement within muscle as well as at lesion–fat interfaces.
Progression to healing may leave no visible evidence of prior disease, especially in acute infections (Fig. 13.9A,B). In those infections that go on to a healing by secondary intention or pass through some state resulting in the generation of granulation tissue, considerable scar will be left at the site of the infection (Figs. 13.10 and 13.11). Eventually, this will become nonenhancing muscle-equivalent tissue on CECT. Such residual end-stage fibrosis will also be nonenhancing and muscle equivalent or generally lower in signal intensity than muscle on all MRI sequences (13.11). With extensive scarring, there may be loss of surrounding fat planes and irreversible thickening of the skin, retraction of skin or deeper anatomic structures, and thickening of various fasciae and the fibrofatty “septae” within areas of previously normal fat.
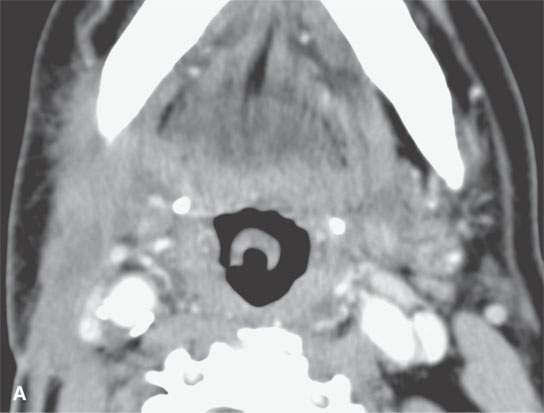
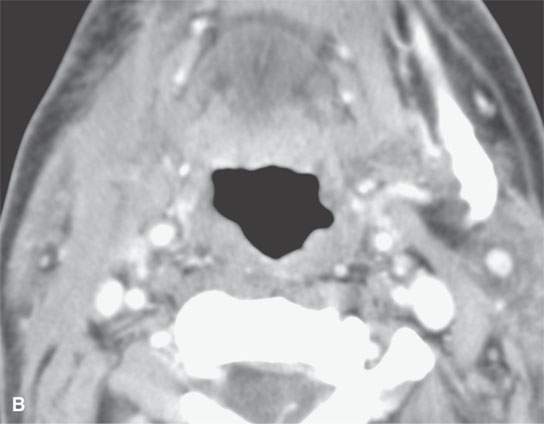
FIGURE 13.10. Contrast-enhanced computed tomography showing thick residual scar after healing of a severe deep neck abscess after a neck dissection. This tissue is slightly inhomogeneous, and any enhancement is difficult to perceive.
Related posts:
 Preseptal Compartment: Acute and Chronic Infections and Noninfectious Inflammatory Conditions
 Necrotizing (“Malignant”) Otitis Externa
 Cervicothoracic Junction: Brachial Plexus Trauma
 Oropharynx: Introduction
 Branchial Apparatus Developmental Anomalies
 Mandible and Maxilla: Odontogenic Tumors and Cysts
Stay updated, free articles. Join our Telegram channel

Full access? Get Clinical Tree


