- •
A diagnosis of PVE and CDI is sometimes difficult to reach when applying the classic modified DC, in which imaging criteria relies on ECHO alone. Nuclear medicine techniques, especially 18 F-FDG PET/CT and CCTA, have demonstrated significant additional diagnostic value and have been incorporated into the 2015 ESC guidelines as major new diagnostic criteria.
- •
A cardiac PET/CCTA scan requires proper patient preparation and specific cardiac acquisitions, including the use of iodinated contrast and ECG-gated metabolic and anatomic imaging for the evaluation of cardiovascular structures.
- •
Metabolic findings are mainly interpreted visually, with emphasis on the FDG uptake pattern. Semiquantitative values provide additional information about uptake intensity. Whether there are variations between equipment and protocols, however, have yet to be determined; currently there are no validated threshold values to confirm or rule out infection.
- •
When reading PET/CCTA images, it is essential to bear in mind possible pitfalls and confounders to prevent misinterpretation and especially to avoid false-positive results.
- •
Postsurgical inflammatory changes are a concern when PET/CCTA is performed after recent PV implantation. Nevertheless, the characteristic morpho-metabolic patterns of 18 F-FDG uptake and anatomic changes can aid in differentiating between reactive inflammation and infection.
- •
Although 18 F-FDG PET/CT is not yet strongly recommended for the diagnosis of CDI in clinical guidelines, its high accuracy has been demonstrated in confirming pocket device infection. Conversely, it is more limited in detecting lead infection and, therefore, a negative scan cannot exclude CDRIE if there is high clinical suspicion.
- •
PET/CTA and CCTA are especially helpful in the evaluation of highly complex patients, such as those with CHD, valve grafts, and patients combining PV and cardiac devices, as well as in the follow-up of nonsurgical patients.
- •
Whole-body PET/CT images must be carefully evaluated for the detection of distant IE-related lesions, such as peripheral embolisms (sometimes adding a minor diagnostic criterion), sources of bacteremia, and possible alternative diagnoses when IE is rejected.
- •
PET/CCTA is a developing technique, especially in cardiac infections. There are many frontiers to be evaluated, such as standardization of semiquantitative values, the development of selective tracers, and the definition of its usefulness in certain contexts such as native valves.
Introduction
Although major advances have been achieved in the diagnosis and treatment of infective endocarditis (IE), it remains a serious disease, often associated with a poor prognosis. Because of its highly variable clinical presentation, the diagnosis of IE is challenging and best achieved through a collaborative approach in dedicated, multidisciplinary hospital units. Native valve endocarditis (NVE) is the most common clinical scenario in this condition, but approximately 20% of IE patients have prosthetic valves (PVs) or intracardiac devices, which are important predisposing factors for the disease. These patients have a different epidemiologic profile and higher mortality than patients with NVE. The modified Duke criteria (DC) for diagnosing IE rely in part on the interpretation of echocardiographic (ECHO) studies. This task can be more complex and difficult in images of prosthetic valve IE (PVE) than in those of NVE, which limits the diagnostic performance of the DC in this scenario. In addition, ECHO visualization of small vegetations in cardiac device–related IE (CDRIE) can be suboptimal, and some device segments (especially the extravascular segments) are beyond its capability.
Because of these limitations, a conclusive diagnosis is not reached in many cases of suspected IE, which can hinder therapeutic decision making and lead to a delay in starting appropriate treatment. In recent years, two imaging techniques have shown promise for improving the diagnosis of IE. Metabolic imaging with 18 F-fluorodeoxyglucose ( 18 F-FDG) positron emission tomography/computed tomography (PET/CT) detects the activated inflammatory cells present in infection and has high sensitivity for diagnosing PVE and device infection. Cardiac computed tomography angiography (CCTA), a technique that provides precise anatomic definitions, enables visualization of IE lesions in both NVE and PVE. , Furthermore, the latest PET/CT systems can simultaneously perform CCTA ( 18 F-FDG PET/CCTA). This combination can lead to considerable diagnostic yields because of the ability of FDG PET to detect inflammation and the ability of CCTA to define structural damage. Another available technique to detect infection within nuclear cardiology is white blood cell (WBC) single photon emission computed tomography (SPECT)/CT. The WBC SPECT/CT method has also proven useful for diagnosing PVE and device infection, , although it is less sensitive and more time consuming than PET/CCTA.
In this chapter, we will summarize the practical usefulness, recommended acquisition protocols, postprocessing tasks, and interpretation of these imaging techniques in the evaluation of IE. Special emphasis is placed on discussing PET/CCTA as a comprehensive technique that provides combined anatomic and functional information, with a focus on its most relevant indication: the diagnosis of PVE and intracardiac device infections.
Technical considerations
Fundamentals of 18 F-FDG-PET/CT in cardiac inflammation and infection
Activated inflammatory cells involved in inflammatory and infectious processes show increased glycolysis and expression of GLUT-1 and GLUT-3 glucose membrane transporters, which enhance glucose uptake (and thus 18 F-FDG). Furthermore, hyperemia and increased cell diffusion in inflamed tissues increases the availability of glucose. Because 18 F-FDG uptake in normal cardiomyocytes can hamper the detection of infected foci in the heart, it is important to suppress physiologic glucose uptake by healthy cardiomyocytes before the evaluation of patients with suspected IE. Because 18 F-FDG is incorporated in the inflammatory cells and cardiomyocytes by different transporters, the use of myocardial suppression measures does not affect pathologic uptake in the infectious process. Specific protocols designed to suppress physiologic glucose uptake in healthy myocardium are discussed in detail in Chapter 23 .
Patient preparation
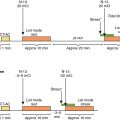
As mentioned, careful patient preparation before PET/CT imaging is critical in the evaluation of patients with suspected IE. Please refer to Chapter 23 for a detailed description of the patient’s preparation protocols ( Fig. 29.1 ). PET/CTA studies have a few absolute contraindications, one of them being severe hemodynamic instability, which would not guarantee patient safety throughout the examination.

Acquisition protocols
Technical requisites
Given the need to obtain images of moving structures with an adequate anatomic resolution and to subsequently allow precise fusion of the metabolic and morphologic acquisitions, PET/CT scanners must ideally meet certain requirements; namely, they must allow for cardiac gating of PET images and high sensitivity, which is enabled by an extended field of view (greater than 15 cm) and three-dimensional acquisition capacity. Gated CCTA images can be obtained simultaneously at the time of PET using the same scanner or, alternatively, acquired in a separate dedicated CT scanner and subsequently fused for interpretation, provided that there is no significant temporal differences between the two acquisitions. A minimum of 64 rows of detectors in the CT scanner with high temporal resolution is required to acquire relatively motion-free images.
Positron emission tomography/cardiac computed tomography angiography acquisition protocol
As in all PET/CT studies, 18 F-FDG is injected after confirmation of a baseline blood glucose level lower than 180 mg/dL (9.99 mmol/L) and the dose is individually adjusted to the patient’s weight (3.3 ± 0.3 MBq/kg).
The suggested acquisition protocol is summarized in Table 29.1 . Images should be acquired after an uptake period of at least 60 minutes (preferably 90 minutes), which allows circulating background activity to decrease and signal-to-noise and image contrast to improve. In equivocal cases, after a review of the standard images, a delayed acquisition (3 hours after tracer injection) may improve diagnostic accuracy. The patient should be placed supine. The acquisition of PET/CT images include a whole-body PET/CT scan and an electrocardiogram (ECG)-gated cardiac bed (C-Bed) to improve evaluation of the region of interest. As previously mentioned, an ECG-gated CCTA is recommended in all patients without severe renal impairment (estimated glomerular filtration rate <30 mL/min/1.73 m 2 ), who have no documented allergy to iodine contrasts, and who are able to perform a breath-hold, conducted according to current guidelines. The CCTA acquisition protocol is adjusted to the diagnostic purpose, taking into account whether the intention is evaluation of PV and/or devices, left- or right-sided IE, or combined. Intravenous beta blockers may be useful in patients with fast heart rates and no contraindications (septic and/or unstable patients). The iodinated contrast injection protocol should be adjusted individually to the patient’s body mass index, the structures to be studied, and the scan duration. A typical injection consists of 50 to 120 mL of isomolar iodinated contrast at a flow rate of 4 to 7 mL/second, followed by a 30 to 50 mL saline chaser. Usually, an adequate scan requires multiphasic acquisition of the cardiac cycle (retrospective ECG gating) to properly assess valve functionality. In device infection (electrodes usually localized in the right chambers), a prospective ECG-gated, venous phase (approximately 60 seconds after initiating contrast administration) CCTA acquisition covering the whole thorax is recommended to evaluate local soft tissue changes, lead vegetations, and the permeability of the venous vascular accesses. Dose reduction measures should be applied when possible. Nevertheless, the benefits of an early diagnosis of IE outweigh this limitation in patients with high morbidity and mortality because of their condition.
| Patient Preparation | |||||
| Myocardial suppression |
| ||||
| Venous access | Right cubital vein recommended High flow rate possibility (for purpose of CCTA) | ||||
| Blood glucose check | Baseline glycemia <180 mg/dL (correct with IV insulin if necessary) | ||||
| Heparin administration | 50 UI/kg IV 15 minutes before FDG injection | ||||
| 18 F-FDG dose administration | 3.3 ± 0.3 MBq/kg (through the previously obtained venous access) | ||||
| Patient rest | Resting (adequate room temperature) | ||||
| Acquisition Protocol | |||||
|
| ||||
| Patient position | Supine | ||||
| Planning | Scout view | ||||
| Whole-body PET/CT | 2–3 minutes per bed position 128 x 128 matrix size Nonattenuation corrected + attenuation corrected images Reconstruction algorithms: iterative, metal artifact reduction | ||||
| 8–10 minutes per bed-position ECG-gated 256 x 256 matrix size Localized to the region of interest (cardiac or whole thorax) Reconstruction algorithms: iterative, metal artifact reduction | ||||
| CCTA | ECG-gated Acquisition protocol and contrast injection according to the diagnostic purpose Consider IV beta-blocker administration (stable patients, heart rate >65 beats/min) | ||||
| ECG gating | Region | Phase | Flow rate | ||
| NVE/PVE |
| Cardiac | Arterial |
| |
| CDI | Prospective | Thorax | Venous |
| |
| Grafts |
| Thorax | Arterial Venous |
| |
Image reconstruction
PET images should preferably be reconstructed using iterative algorithms, with application of all possible corrections to the nonattenuation-corrected (NC) and attenuation-corrected (AC) images. In addition, software-based metal artifact reduction algorithms, if available, should be activated to avoid false-positive uptake derived from metal implants affecting the CT-based attenuation maps.
The dedicated C-Bed reconstruction allows for a more accurate assessment of the pattern of FDG uptake in the PVs. It has a better contrast resolution (longer acquisition time that provides more counts per pixel and smoother reconstruction kernels), better spatial resolution (larger matrix and smaller pixel size), and less scattering, thus improving sensitivity to detect low metabolic activity and providing more precise information on the maximum extent and distribution of the 18 F-FDG uptake. Recommended acquisition parameters for the C-Bed acquisition are included in Table 29.1 . The ECG-gated FDG images provide better metabolic and anatomic image fusion and interpretation and, if necessary, allow for the selection of specific phases of the cardiac cycle. ,
CCTA images should be reconstructed according to CCTA guidelines, usually using a medium kernel and thin reconstruction slices to allow for the visualization of relatively small structures and lesions. For a proper evaluation of valve functioning, the most usual procedure is to reconstruct a data set of 20 phases at each 5% increase of the cardiac cycle (0% to 95% of the R-R interval).
Image interpretation
The metabolic images are fused with their corresponding CT anatomic images for analysis: the whole-body PET images are fused with the unenhanced and non–ECG-gated whole-body CT images, and the gated cardiac PET images are fused with the CCTA images. Regarding the metabolic images, because metallic artifacts could propagate to the AC images and create a false-positive metabolic signal associated with the prosthetic material, NC images should always be reviewed to avoid interpretation of these reconstruction artifacts as pathologic 18 F-FDG uptake. The study should be systematically analyzed, including a review of the images in the axial plane and multiplanar reorientation to obtain cardiac axes, valvular planes, and all the needed projections of the studied structures. Maximum intensity projections and cine images can help the evaluation of prostheses or anatomic lesions (vegetations, pseudoaneurysms). ,
The interpretation of the PET/CCTA images is based on a visual assessment of the location and distribution pattern of FDG uptake (visual analysis), the intensity of the uptake values (quantitative analysis), the presence or absence of anatomic lesions related to IE in the CCTA, and the correlation between the metabolic and anatomic images. Because many of the morpho-metabolic characteristics visualized will be related to the type of surgical procedure and prosthesis, it is recommended to have this information before reading a PET/CCTA study.
Metabolic images
Qualitative analysis
Visual interpretation of PET/CCTA images is based on subjective evaluation of 18 F-FDG uptake. This includes 18 F-FDG location and uptake pattern, 18 F-FDG uptake intensity, and correlation of FDG uptake with the anatomic structures and/or lesions on the CCTA. In terms of the location and uptake pattern, an important starting point for interpretation is to bear in mind that noninfected PV can sometimes display 18 F-FDG uptake. Thus, FDG uptake associated with cardiac prosthetic material should not invariably be interpreted to indicate infection. Prior studies have shown that the distribution pattern is a key feature when evaluating the probability that prosthetic/periprosthetic hypermetabolism corresponds to infection or to a reactive inflammation/healing response. Although some cases may remain difficult to interpret, in general, a diffuse and homogeneous distribution is related to inflammation, whereas focal or heterogeneous 18 F-FDG uptakes are highly suggestive of infection. , Meanwhile, when considering 18 F-FDG uptake intensity, the tracer uptake is considered pathologic when it is observed to have a greater intensity than in other organs considered as the reference, usually the hepatic parenchyma. Finally, as will be discussed in detail later, the presence of anatomic lesions on the CCTA that could be associated with endocarditis is probably the most specific piece of information to determine the likelihood that 18 F-FDG uptake corresponds to infection.
Globally, we can define uptake suggestive of infection as an intense 18 F-FDG uptake (hypermetabolism) with focal and/or heterogeneous distribution, in relation to the prosthetic material or specific cardiac lesions (e.g., pseudoaneurysm, abscess), identified in both the AC and NC images, and uptake NOT suggestive of infection as absent or mild 18 F-FDG uptake with a homogeneous distribution, in relation to the prosthetic material, and without underlying anatomic lesions related to IE.
Regarding the visual interpretation of cardiac devices by PET/CCTA, two main parts of the device system should be independently analyzed: the generator/ pocket and the leads. In the generator/pocket, focal/heterogeneous 18 F-FDG uptake beyond the recent postimplantation period (>6 weeks), and especially when associated with soft tissue inflammatory changes, should suggest infection. Meanwhile, leads are not usually associated with metabolic activity and so any 18 F-FDG uptake along lead segments should suggest infection and is highly suggestive when associated with vegetations/thrombi.
Quantitative analysis
The intensity of 18 F-FDG uptake can be assessed through different quantitative measures: the maximum standardized uptake value (SUV max ) in the visually abnormal area and the SUV ratio or target-to-background ratio (TBR), calculated as the ratio of the SUV max in the prosthetic material to the mean SUV of a reference organ, usually the blood pool or liver. This ratio intends to overcome bias related to individual differences in 18 F-FDG metabolism.
Quantitative assessment of 18 F-FDG uptake lends support to the visual information. Nevertheless, there are some potential causes of SUV variability that must be taken into account during the interpretation, including the 18 F-FDG dose and circulation time, prescan blood glucose levels, the PET/CT system used, and the scan parameters (acquisition protocol and reconstruction algorithms among other factors). Therefore the diagnosis should not rely exclusively on quantitative values, which should be considered as supporting data rather than as a conclusive criterion.
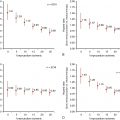
As previously mentioned, noninfective PVs can display some degree of FDG uptake. Prior studies have attempted to determine quantitative cutoff values to diagnose infection. At the moment, however, they are only estimated ranges of values and can sometimes even overlap with the so-called normal values found in noninfected prostheses. For example, in a cohort of 92 patients, cutoff values of SUV max greater than or equal to 3.7 and SUV ratio greater than or equal to 1.69 enabled identification of positive cases with a sensitivity of 91% and specificity of 79%. A specificity of 100% for confirming infection was reached with cutoff values of SUV max greater than or equal to 6.87 and SUV ratio greater than or equal to 3.45. A recent meta-analysis found that median SUV max values for rejected PVE ranged from 0.5 to 4.9 and for definite PVE ranged from 4.2 to 7.4. A recently published series reported similar results, with a SUV ratio cutoff of greater than 2.0 being 100% sensitive and 91% specific for infection. Because multiple variables can potentially influence quantitative measures, the generalizability of values is somewhat limited. Therefore standardization of patient preparation, image acquisition, reconstruction, and analysis across centers and vendors remains a challenge that must be resolved. The EANM Research Ltd. (EARL) accreditation system has been proposed for this purpose. It was designed, however, for oncologic scans, so its validity for cardiac studies, which require maximum spatial resolution, still needs to be determined. Moreover, its high level of image smoothing results in lower SUV values compared with images based on other reconstruction methods (i.e., time-of-flight).
Quantitative assessment of cardiac device infection (CDI) is relatively easy and useful when evaluating the pocket. Conversely, because lead vegetations are usually small and show a low grade of FDG uptake, SUV max values are usually too close to the patient’s background metabolic activity, leading to very low specificity (50%) of quantitative information for the diagnosis of CDRIE.
Computed tomography and cardiac computed tomography angiography images
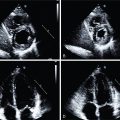
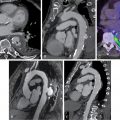
Cardiac lesions related to IE include leaflet thickening, vegetations (mobile soft-tissue lesions attached to valves or leads), perivalvular extension of the infection in the form of abscesses (noncavitated, extraluminal soft-tissue lesions) or collections (fluid-filled cavities), pseudoaneurysms (saccular enlargement of a vascular structure or contrast-filled soft-tissue cavitation arising from it), and fistulae (abnormal contrast-filled tracts or communications between vascular structures; Fig. 29.2 ).

Infective involvement of the coronary arteries and/or coronary artery disease (CAD), which is highly relevant preoperative information, can be ruled out depending on the quality of the scan and is another important reason for the acquisition of a dedicated CCTA in combination with PET/CT.
Anatomic lesions related to device infection are infrequent but highly specific. Fat stranding or fluid collections around the generator can be visualized in advanced lesions. Lead vegetations are difficult to identify on CCTA because they are usually very small, and motion and metal artifacts of the leads can significantly affect their visualization.
Overall interpretation of positron emission tomography/cardiac computed tomography angiography scans
After an overall evaluation, studies can be classified as:
- •
Positive for active infection when there is intense and focal or heterogeneous hypermetabolic activity related to the prosthetic material or to the cardiac lesions (if present).
- •
Negative for active infection when there is no significant metabolic activity related to the prosthetic material or to the cardiac lesions (i.e., noninfective postoperative complications or old lesions secondary to past or cured endocarditis).
- •
Doubtful when there is midintensity and fairly heterogeneous 18 F-FDG uptake (unclear metabolic pattern), especially in newer postoperative patients.
Finally, whole-body fused images must be carefully reviewed to detect IE-related peripheral findings, such as embolic events, alternative diagnoses other than IE, and incidental neoplastic lesions that could be the source of infection.
Infection versus postoperative inflammation
Because PET/CCTA has high sensitivity for detecting not only infection but also inflammatory activity, caution is advised when interpreting images acquired in patients who have recently undergone cardiac surgery. The postoperative inflammatory response may result in 18 F-FDG uptake in the immediate postoperative period and could, therefore, lead to a misdiagnosis of infection. The inflammatory reaction after surgery may depend on the extent of surgery and the type of materials used. Certain specific situations are known to generate a significantly higher inflammatory response, such as the use of adhesive/hemostatic material to seal anastomoses and valve replacements requiring extensive removal of cardiac tissue and calcifications. Moreover, in addition to inflammatory cells, the postsurgical reparative process involves the activation of other cells, such as fibroblasts, which can also show 18 F-FDG uptake. Finally, it is unknown how long the inflammatory reaction and the repair process can persist over time, so some degree of FDG uptake can be nonspecific.
To avoid false-positive diagnoses from early postoperative inflammation, European Society of Cardiology (ESC) guidelines have recommended avoiding the use of PET/CT within 3 months after surgery. Nevertheless, recent evidence supports the idea that there are metabolic and anatomic features that can help in differentiating between inflammation and infection and that recent valve implantation would not be a significant predictor of false-positive interpretations. Morphologic and metabolic findings in postoperative inflammation and infection are described in Table 29.2 . A recently published series of PET/CTA performed in a group of patients without IE evaluated after valve implantation surgery showed that 18 F-FDG can be visually detected in a high number (around 80%) of implanted PV but usually display (93%) a diffuse and homogeneous distribution pattern characteristic of inflammation. These metabolic features seem to remain stable for at least 1 year after surgery and, in combination with the absence of anatomic lesions, result in a proposed “normality criteria” (see Table 29.2 ), which allow for reasonable differentiation of postoperative inflammation from active infection in most cases. In practice, there would not be significant differences in the 18 F-FDG uptake values or distribution pattern between valve type (mechanical or biologic) or position (aortic or mitral). Therefore, because 18 F-FDG uptake can be normally visualized in noninfected PV and its duration over time is unknown, two main concepts can be extracted: (1) At the moment, the best way to avoid misinterpretation is to bear in mind the morpho-metabolic patterns that may more likely correspond to infection or inflammation, and (2) this differentiation is possible even in recently implanted valves, questioning the 3-month safety period of current guidelines.
In cardiac devices, postimplantation inflammation is a less significant issue. Studies have demonstrated that very little inflammatory activity persists 6 weeks after implantation, suggesting that 18 F-FDG uptake after this period (especially focal or heterogeneous) should suggest infection. , Metabolic activity in relation to the device leads is unexpected, so any 18 F-FDG uptake is highly suspicious of infection.
Clinical applications of 18 F-FDG-PET/CCTA
Case vignette 1: Prosthetic valve endocarditis
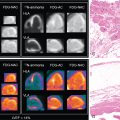
A 71-year-old female with a bioprosthetic aortic valve replacement presented with a 2-month history of fever and blood cultures positive for Streptococcus salivarius. Because of suspicion of PVE, she underwent an ECHO that was negative for vegetations, showing only mild leaflet thickening and thickening of the mitral-aortic intervalvular fibrosa. A diagnosis of endocarditis remained as possible. An 18 F-FDG-PET/CCTA was performed and confirmed PVE (focal hypermetabolism on the bioprosthetic ring and soft tissue thickening at the mitral-aortic fibrosa). Whole-body images also demonstrated a splenic embolic lesion, which is a frequent clinical complication of IE ( Fig. 29.3 ). The IE Expert Team decided on a 6-week antibiotic treatment and the patient showed a favorable clinical course.

Related posts:
 Radiopharmaceuticals for clinical SPECT and PET and imaging protocols
 Imaging in patients with acute chest pain in the emergency department
 Key concepts in risk stratification and cost-effectiveness using nuclear scintigraphy in stable coronary artery disease
 Patient with known or suspected cardiac sarcoidosis
 Artificial intelligence in nuclear cardiology
 Large-vessel vasculitis
Stay updated, free articles. Join our Telegram channel

Full access? Get Clinical Tree


