Chapter 13
Inflammatory liver diseases
Ersan Altun1, Mohamed El-Azzazi1,2,3,4, and Richard C. Semelka1
1The University of North Carolina at Chapel Hill, Department of Radiology, Chapel Hill, NC, USA
2University of Dammam, Department of Radiology, Dammam, Saudi Arabia
3King Fahd Hospital of the University, Department of Radiology, Khobar, Saudi Arabia
4University of Al Azhar, Department of Radiology, Cairo, Egypt
- Autoimmune liver disorders are inflammatory liver diseases characterized by:
- Inflammatory cell infiltrate in the portal tracts.
- Presence of autoantibodies and increased levels of transaminases, Ig G.
- Entities Include:
- Primary sclerosing cholangitis (PSC).
- Autoimmune hepatitis (AIH).
- Primary biliary cirrhosis (PBC).
- Overlap Syndrome.
- Sarcoidosis.
- Inflammatory cell infiltrate in the portal tracts.
Primary sclerosing cholangitis (PSC)
- Chronic cholestatic liver disease of presumed autoimmune origin.
- Characterized by diffuse cholangitis and progressive fibrosis of intrahepatic and extrahepatic bile ducts.
- PSC is more common in males. 60–80% of patients have associated inflammatory bowel disease, particularly ulcerative colitis.
- Patients with PSC have a higher risk of developing cholangiocarcinoma. The absolute increase of cholangiocarcinoma has been reported as high as in 10% of patients with PSC. In clinical practice the incidence appears much lower. Additionally, there has been increased risk of developing hepatocellular carcinoma, which is significantly lower compared to chronic hepatitis B and C.
- Morphologic changes:
- Lymphocytic infiltrate with fibrosing cholangitis of intra and extrahepatic bile ducts and progressive obliteration of their lumens.
- Between areas of scarring and progressive stricture, bile ducts become ectatic, presumably the result of downstream obstruction. This creates the “string of pearls” or “beaded” bile duct appearance. Multifocal strictures and dilatations.
- The disease culminates in cirrhosis.
- Lymphocytic infiltrate with fibrosing cholangitis of intra and extrahepatic bile ducts and progressive obliteration of their lumens.
- MR findings of PSC:
- Early Findings: Biliary ductal findings are seen without associated parenchymal findings. Mild wall thickening (<2 mm) and mildly increased enhancement of biliary ducts. Focal strictures and dilatations are apparent, but may be subtle. Best looked for on source images of a 3D MRCP image. The lateral segment of the left lobe tends to experience slightly greater disease (Figures 13.1 and 13.2).
- Late Findings: Parenchymal findings are seen in addition to biliary ductal findings. Macronodular regeneration pattern, which is characteristically central regeneration in pattern, is distinctive. Central regeneration and hypertrophy of the segments 1–2–3–4 associated with peripheral atrophy is seen commonly (Figures 13.3–13.5). Central regeneration also contributes the biliary obstruction, as the regenerative liver compresses/occludes peripheral ducts (Figure 13.5). Wedge-shaped, segmental or peribiliary transient increased enhancement of the hepatic parenchyma, which becomes isointense with the remaining liver parenchyma on the later phases, may be seen, reflecting the inflammatory nature of the condition (Figure 13.5). Peripheral wedge-shaped atrophy may show mildly high signal on T2-WI, low signal on T1-WI and mildly increased enhancement, which is more prominent on the interstitial phase. Occasionally, wedge-shaped regions of mildly high T1 signal is apparently presumed to represent inspissated bile in partially obstructed bile ducts/ductules (Figure 13.4).
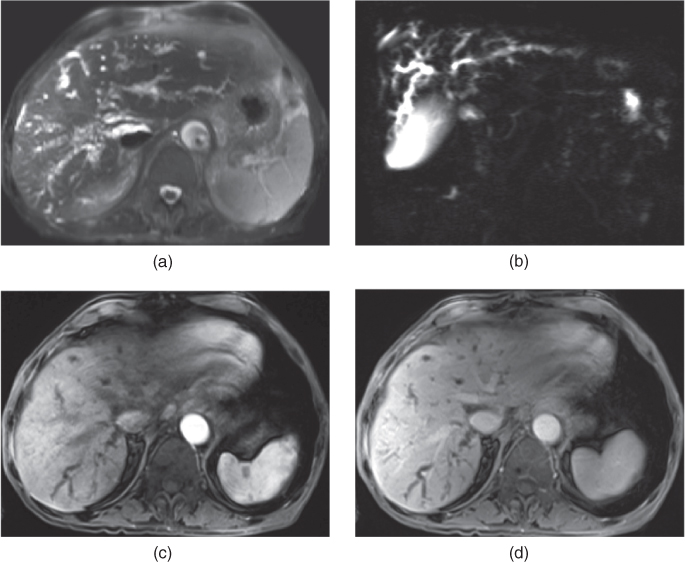
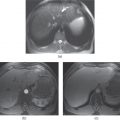
Figure 13.1 Transverse fat-suppressed T2-weighted SS-ETSE (a), coronal thick slab MRCP (b), T1-weighted postgadolinium fat-suppressed hepatic arterial phase (c) and hepatic venous phase (d) 3D-GE images show bile duct involvement without the evidence of parenchymal changes secondary to PSC. The bile ducts show irregular focal strictures – beading with resultant dilatation.
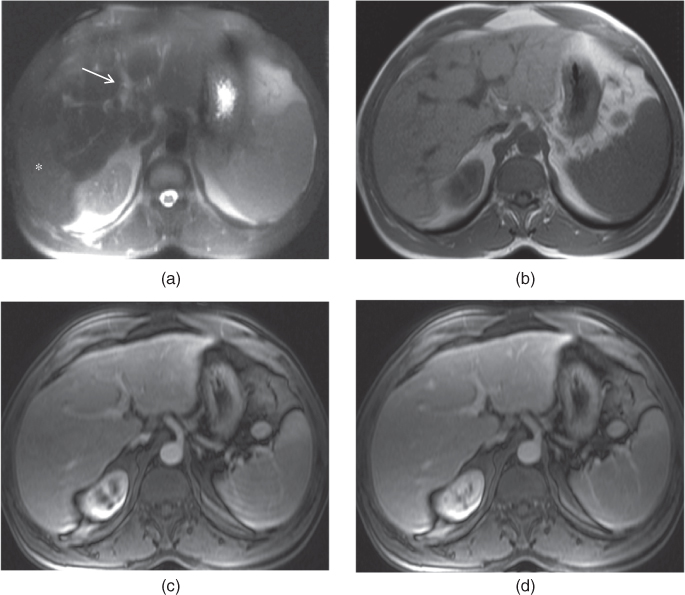
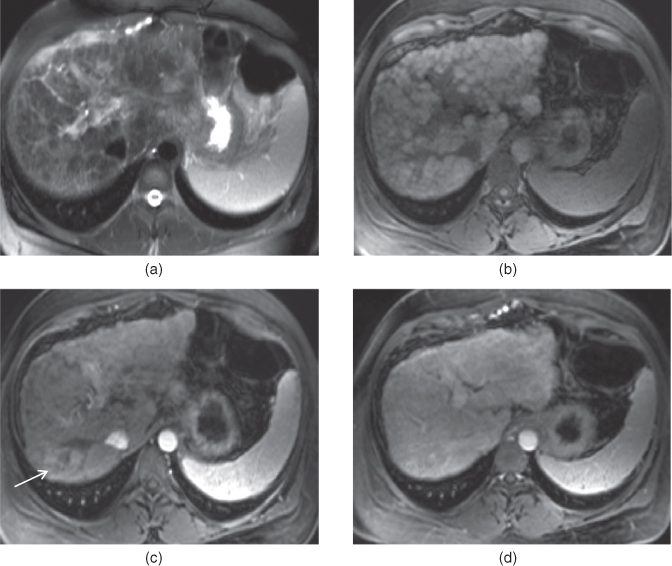
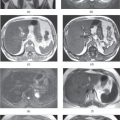
Figure 13.2 Transverse fat-suppressed T2-weighted SS-ETSE (a), T1-weighted 2D-GE (b), T1-weighted postgadolinium fat-suppressed hepatic arterial phase (c) and hepatic venous phase (d) 3D-GE images show biliary ductal involvement with early parenchymal changes secondary to PSC. The bile ducts show mild dilatation in the left lobe of the liver (arrow, a). The segments II and III appear hypertrophic due to central regeneration. Peripheral atrophy of the posterior segment of the right lobe (asteriks, a) is noted. The atrophic segment demonstrates mildly high T2 signal (asteriks, a).
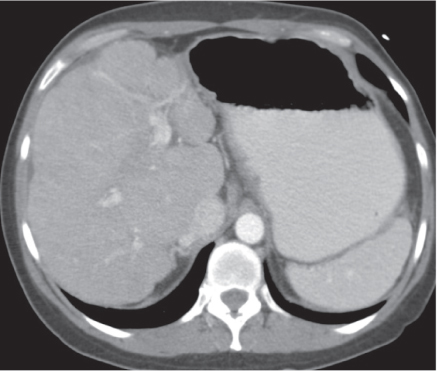
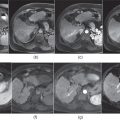
Figure 13.3 Transverse postcontrast hepatic venous phase CT image shows advanced form of PSC with resultant cirrhosis. The liver has nodular contours with macronodular regenerative pattern. The caudate lobe appears prominently hypertrophic.
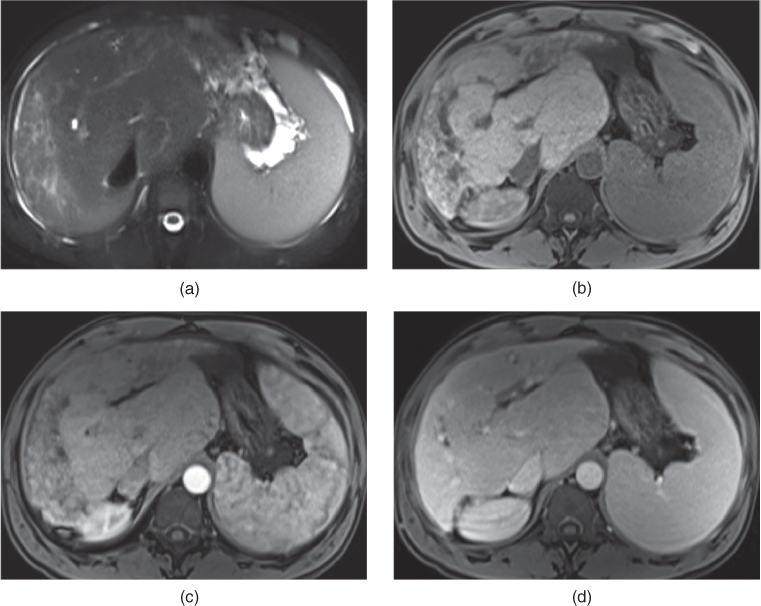
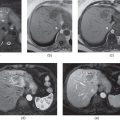
Figure 13.4 Transverse fat-suppressed T2-weighted SS-ETSE (a), T1-weighted fat-suppressed 3D-GE (b), T1-weighted postgadolinium fat-suppressed hepatic arterial phase (c) and hepatic venous phase (d) 3D-GE images demonstrate advanced form of PSC with cirrhosis. Central regeneration including the hypertrophy of the caudate lobe is detected. The peripheral atrophy is very prominent in both lobes. The atrophic peripheral right lobe shows increased T2 signal. Additionally, increased T1 signal is noted in the peripheral atrophic liver due to inspissated bile.
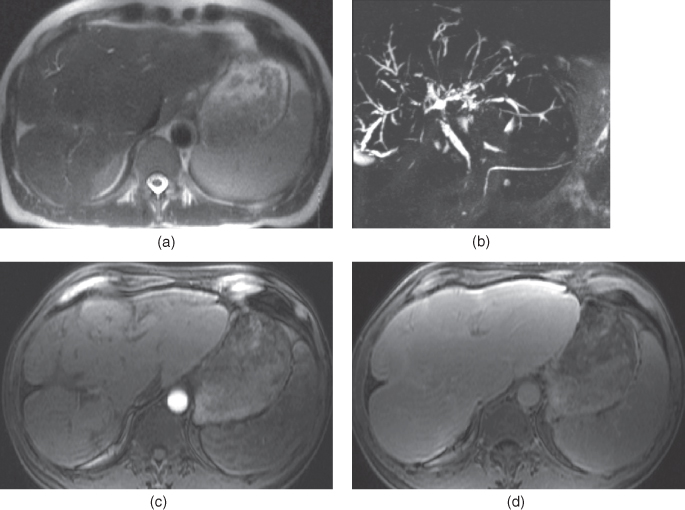
Figure 13.5 Transverse fat-suppressed T2-weighted SS-ETSE (a), coronal thick slab MRCP (b), T1-weighted postgadolinium fat-suppressed hepatic arterial phase (c) and hepatic venous phase (d) 3D-GE images show prominent central regeneration of the segments I, II, III and IV with associated peripheral atrophy, which is more prominent at the right lobe. In addition to the parenchymal changes of PSC, intrahepatic bile ducts demonstrate peripheral dilatation secondary to strictures and compression due to central regeneration.
- MR and MRCP are superior to CT because they can visualize the bile ducts with greater contrast resolution, and higher soft tissue contrast to examine for neoplasms.
- Early Findings: Biliary ductal findings are seen without associated parenchymal findings. Mild wall thickening (<2 mm) and mildly increased enhancement of biliary ducts. Focal strictures and dilatations are apparent, but may be subtle. Best looked for on source images of a 3D MRCP image. The lateral segment of the left lobe tends to experience slightly greater disease (Figures 13.1 and 13.2).
- Differential Diagnosis Chronic Budd–Chiari.
- May possess similar morphologic findings:
- Hypertrophy of the caudate lobe.
- Presence of regenerative nodules and fibrosis are present in both entities. The regenerative nodules are small.
- Hypertrophy of the caudate lobe.
- In contrast, chronic Budd–Chiari shows hepatic vein absence or thrombosis, and shows distinctive intrahepatic venous collaterals.
- In PSC:
- Central regenerative nodules involve more of the entire central region of the liver, so segment II is also involved, whereas Chronic Budd–Chiari tends to show massive segment I dilation in isolation.
- Sarcoidosis
Sarcoidosis may possess the identical imaging features of PSC with central regeneration. Clinical picture and lab test may allow the distinction. To date, no other hepatic condition has been identified that routinely shows this appearance.
- Central regenerative nodules involve more of the entire central region of the liver, so segment II is also involved, whereas Chronic Budd–Chiari tends to show massive segment I dilation in isolation.
- May possess similar morphologic findings:
Autoimmune hepatitis (AIH)
- The incidence of AIH is 1.9/100.000.
- The great majority of patients are middle-aged women.
- Associated with increased levels of antinuclear antibody and antismooth muscle antibody.
- AIH is characterized by the presence of piecemeal necrosis with a predominant lymphoplasmacytic cell infiltrate and fibrosis which my lead to cirrhosis.
- The risk of developing HCC is low.
- On CT and MRI:
- AIH usually presents with a prominent pattern of liver fibrosis/cirrhosis with global prominent atrophy of the liver (Figure 13.6). The cirrhosis may also have bizarre shape (Figure 13.7).
- At initial presentation there may be substantial inflammatory enhancement. Patchy transient heterogeneous enhancement on the hepatic arterial dominant phase images, which fade to isointensity with the background liver parenchyma on the later phases may be seen (Figure 13.6).
- The risk of developing HCC is low.
Related posts:
Stay updated, free articles. Join our Telegram channel

Full access? Get Clinical Tree


