Abstract
FDG PET/CT is a hybrid functional and anatomical imaging method with substantial application in oncology. This chapter introduces FDG PET/CT and how the functional and anatomic components combine into one examination.
Keywords
FDG, PET/CT, attenuation correction
18F-flourodeoxyglucose positron emission tomography/computed tomography (FDG PET/CT) provides noninvasive metabolic and anatomic imaging. The radioisotope, flouride-18, has a short half-life allowing for imaging with limited patient dose. Fluoride-18 is used to chemically replace a hydroxyl group on glucose, and the resultant FDG is taken up into cells analogous to glucose. As tumor cells often uptake more glucose than normal tissues, FDG allows effective imaging of tumors.
The majority of this textbook focuses on hybrid FDG PET/CT for oncology. More than 1.7 million PET examinations are performed each year in the United States. There are several interesting facts about these PET examinations.
- 1
Greater than 95% of PET scans are performed with FDG as the radiotracer.
- 2
95% of PET scans are performed for oncology (3% for cardiology, 2% for neurology).
- 3
Greater than 95% of PET scans are performed as hybrid PET/CT studies. (Data from IMV 2015 PET Imaging Market Summary Report, http://www.imvinfo.com/index.aspx?sec=pet&sub=dis&itemid=200083 .)
Let’s look at each point.
- 1.
Greater than 95% of PET scans are performed with FDG as the radiotracer.
FDG is by far the most commonly used radiotracer for PET imaging. There are other PET radiotracers that are U.S. Food and Drug Administration (FDA) approved for imaging, and many more which are not FDA approved, but the vast majority of PET scans are currently performed with FDG as the tracer. Thus the majority of this book focuses on the interpretation of FDG PET. The final chapter introduces other radiotracers with strong potential for increased utilization in the future.
- 2.
95% of PET scans are performed for oncology.
There are important applications of PET for cardiology and neurology; however, the vast majority of PET examinations are performed to evaluate patients with malignancy. Thus this book focuses on oncologic FDG PET.
- 3.
Greater than 95% of PET scans are performed as hybrid PET/CT studies.
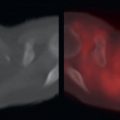
There are several reasons for this. First, PET scans are easier to interpret when they are corrected for attenuation. A PET camera counts 511 keV photons that are received by its detectors, but this is not the number of photons that are actually emitted. Many photons are attenuated while passing through the body before they reach the camera. In general, the deeper the photons originate within the body, the more tissue they need to pass through, and the more attenuation occurs. Thus the camera sees a greater percentage of the photons that originate near the body surface, less from those that originate deeper within the body. We can create an image from the number of photons actually detected by the PET camera. This is called the nonattenuation corrected image ( Fig. 1.1 ).

FIG. 1.1
Nonattenuated corrected maximum intensity projection image from an FDG PET scan.
Arrow points at the liver surface, which appears to have more photon counts than the deeper portions of the liver.
Notice how the surface of the body appears to have more counts than areas deeper in the body. For example, the superficial portion of the liver (arrow) appears to have more counts than the deeper portions of the liver in the nonattenuation corrected image (see Fig. 1.1 ). However, we know that in a normal liver, the number of photons emitted from the liver cells should be about equal. This limits visualization of the deeper structures in the body.
When we “correct” for attenuation, the FDG images appear the way we are used to seeing them ( Fig. 1.2 ).

FIG. 1.2
Attenuated corrected maximum intensity projection image from the same FDG PET scan as Fig. 1.1 .
Arrow points at the liver surface, which after attenuation correction appears to have the same photon counts as the deeper portions of the liver.
Now the liver appears homogeneous in the attenuation corrected image (see Fig. 1.2 ). How is this attenuation correction done? The PET/CT camera uses the data from CT photon attenuation as a map to “correct” for attenuation of the photons created by positron annihilation. In general, the attenuation corrected image is much easier to interpret. How does a PET-only camera correct for attenuation? A PET-only camera uses a transmission positron source. Thus both PET-only and PET/CT cameras can effectively correct for attenuation. However, the CT scan takes only seconds to acquire on a PET/CT, but the transmission data may take 30 minutes to acquire on a PET-only camera. Thus the use of hybrid PET/CT allows much faster patient throughput than a PET-only camera.
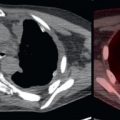
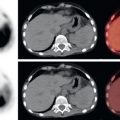
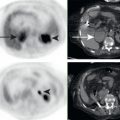
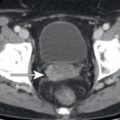
Second, the CT component of a PET/CT allows for lesion localization. Sometimes it is difficult to determine where a PET focus is in the body ( Fig. 1.3 ). Fig. 1.3 depicts a patient with breast cancer. There is an FDG focus in the right pelvis. What this FDG focus represents depends on where this focus is. If it is within a bone, then it is suspicious for an osseous metastasis. However, if it is outside the bone in a muscle, then it is probably physiologic muscle and is benign. The ability to fuse the FDG PET and CT images ( Fig. 1.4 ) allows for localization of the FDG focus to the bone, and thus the FDG focus is suspicious for osseous metastasis. This biopsy was proven to be an osseous metastasis.

FIG. 1.3
Axial FDG PET through the pelvis in a patient with breast cancer.
There is an FDG focus in the right pelvis (arrow) . The midline FDG avidity is urine in the bladder.