, Lawrence A. Zumo2 and Valerie Sim3
(1)
Parkinson’s Clinic of Eastern Toronto, Toronto, ON, Canada
(2)
Silver Spring, Cheverly, MD, USA
(3)
Centre for Prions and Protein Folding Diseases, University of Alberta, Edmonton, AB, Canada
Abstract
Neurology is a medical discipline which demands thorough history taking and precise localization based on physical examination. Neuroimaging modalities further aid the physician in diagnosing and managing of patients. In support of the dictum “insight before application”, ascribed to Max Planck, we present a brief but critical summary of applicable biochemical and biophysical principles of neuroimaging and neurosonology. Major technologic advances in neuroradiology have resulted in the detection and better characterization of neurologic diseases; computerized tomography revolutionized clinical medicine in the 1970s, and magnetic resonance imaging has subsequently had a tremendous impact on neurologic practice. Fundamental principles of the most commonly encountered neuroimaging techniques are explained in this chapter, including CT, MRI, angiography, ultrasound, PET and SPECT.
1.1 Computerized Tomography (CT)
This modality utilizes cross sectional imagery based on the absorption of X-rays by biological tissues. Signal is measured in Hounsefield units (approximately −1,000 (air) to +1,000 (blood)), an arbitrary scale reflecting the attenuation coefficient of the differential attenuation properties of biological tissues. In modern machines, slice images are acquired at discrete intervals, either in axial or coronal plane, and are then reformatted in any desired plane (2 –5 mm average slice thickness) or as volumetric (3D) representation of the structures. In 1989, an improvement of CT scanning was introduced; spiral CT (helical or volume acquisition) allows data to be acquired continuously by constant rotation of the X-ray tube detector coupled with constant moving of patient on the gantry. This makes shorter scanning times possible and lowers the amount of contrast material required.
A CT scan is often the initial imaging modality used in neurological conditions. A complete CT scan can be done in 5 minutes or less. Acute haemorrhage is readily identified on CT. The main disadvantage of a CT scan is that the posterior fossa and brainstem are not as well visualized.
1.1.1 CT Densities and Windowing
For CT images, signal is referred to as density. Whiter areas are hyperdense, darker areas are hypodense. A CT scan is a better tool for imaging bone structures, acute hemorrhage, and calcification, all of which appear hyperdense (white). Cerebrospinal fluid (CSF) is hypodense compared to brain, and air appears black. Different “window” settings can be selected, allowing details to be seen within the bone (bone windows) or the brain (brain window) (Fig. 1.1).
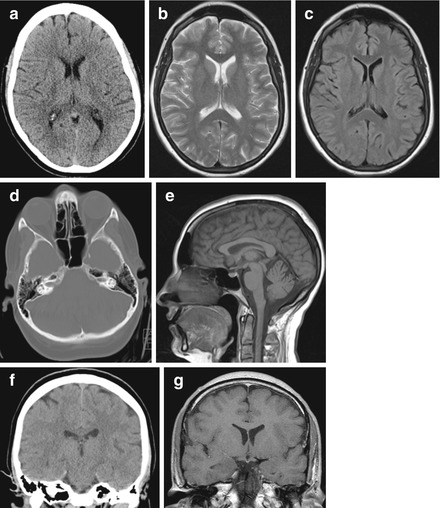

Figure 1.1
Imaging planes and CT/T1/T2/FLAIR examples. (a) Axial CT; (b) Axial T2-weighted MRI; (c) Axial FLAIR MRI; (d) Axial CT bone window; (e) Sagittal T1 MRI; (f) Coronal CT; (g) Coronal T1 MRI
1.1.2 CT Contrast
CT scans can be obtained with and without intravenous contrast. Iodine-based dyes are the most common dyes used. Contrast dye can leach through a disrupted blood–brain barrier, as seen with tumours or inflammatory lesions, leaving behind contrast which is radio-opaque, and thus visible by CT. The major side effect of concern, apart from allergic reaction, is nephrotoxicity which probably occurs in less than 1 % of normal individuals, but can be as high as 10–20 % of people with chronic kidney disease. Renal function should always be assessed before administering contrast.
1.1.3 CT Angiography (CTA)
Blood vessels can also be imaged using contrast dye. The bone densities are subtracted from the final image, leaving high resolution images of the intraluminal flow of neck and intracranial vessels (see Fig. 11.4).
1.2 Magnetic Resonance Imaging (MRI)
An MRI scan will take 20 minutes or much longer, depending on the sequences used, but provides more detailed information than CT scan about inflammatory lesions and posterior fossa or brainstem pathology. There are many different types of MRI sequences and these can seem confusing at first glance. To more easily identify and interpret the MRI scan types, it is important to understand some of the fundamentals of MRI physics. A simplified explanation follows.
MRI is based on nuclear magnetic resonance (NMR), a technique originally used by scientists for chemical analysis of molecules. It relies on calculations and extrapolations of magnetic relaxation times of nuclear particles. For clinical MRI, hydrogen protons are the particles analyzed, as these protons have significant magnetic moments (existing in the nucleus without associated neutrons) and are extremely abundant in tissues.
1.2.1 Spins and Magnetic Fields
Protons are positively charged particles at the centre of all atomic nuclei. Because they are always spinning and are charged, they create small magnetic fields, like tiny bar magnets. Thus protons have both a spin and a magnetic dipole. We humans are full of protons, but the spins and dipoles are random so all net dipole is zero (ie. we are not magnetized). However, when we are put into an MRI magnet, some of the dipoles align themselves with the magnetic field (in essence magnetizing the tissue to a small degree, enough to interfere with pacemakers, which is why this is an important screening question before any person enters the magnet!). More dipoles line up in the direction of the field such that the sum of all dipole vectors is 0°. This is the new baseline state.
1.2.2 Generating MRI Signals
Once tissue is in this baseline magnetized state with the net dipole pointing to 0°, a radiofrequency pulse can be given. This causes the protons to enter a higher energy state, flipping to orient at 180°. As more protons “flip”, the net dipole vector increases, becoming 90° when there are equal protons in both states. In the MRI machine, a receiver is located at 90° to the baseline state; the magnetic field at 90° induces a current (signal) in this receiver, proportional to the field strength. As soon as the radiofrequency pulse is stopped, the signal in this receiver “decays” as protons flip back to their baseline state. This decay, or relaxation, has two main forms for the purposes of clinical neuroradiology, T1 and T2 (measured in milliseconds):
T1–longitudinal (spin lattice) relaxation time:
This is the time it takes for the net dipole to completely return to 0° from 90° after the radiofrequency pulse is stopped; that is, the time when the 90° receiver no longer has current induced by magnetic field from the tissue. It is strongly dependent on MRI field strength. Larger fields give better anatomic resolution in T1-weighted images. Most clinical MRIs use magnets of at least 3 T (60,000 times the earth’s magnetic field).
T2–transverse nuclear spin magnetization decoherence:
When protons spin, they act like a top which is about to fall over, that is, they wobble around a central axis. This movement is called precession. The precession of protons is random (incoherent) at baseline, even after being put into the MRI machine. Once a radiofrequency pulse is given, it causes excited protons to precess in synchronization (coherently). This precessional frequency can then be detected by the 90° receiver once the radiofrequency pulse is stopped. The T2 relaxation time is the time it takes for the synchronization of precession to disappear or become incoherent again. T2 is less dependent on magnetic field so larger MRI fields have less effect on T2 image quality.
1.2.3 T1 and T2 Intensities (Table 1.1)
For MRI images, signal is referred to as intensity. Whiter areas are hyperintense, darker areas are hypointense. A short relaxation time produces a high signal (hyperintense); long relaxation gives low signal (hypointense).
T1-weighted images: ideal for displaying anatomical structures; less sensitive to water. Grey matter is hypointense (greyer), white matter hyperintense (whiter).
< div class='tao-gold-member'>
Only gold members can continue reading. Log In or Register to continue
Stay updated, free articles. Join our Telegram channel

Full access? Get Clinical Tree


