Knee Anatomy
The knee is a synovial joint that consists of hyaline cartilage articulations between the femur, the tibia, and the patella ( Fig. 7.1 ). The menisci are C-shaped fibrocartilage structures between the femur and the tibia ( Fig. 7.1E ). A prominent joint recess, the suprapatellar recess or pouch, extends superiorly from the knee joint between the patella and the femur and communicates with the medial and lateral joint recesses, which extend over the medial and lateral aspects of the femoral condyles beneath the patellar retinaculum ( Fig. 7.1F ). In the sagittal plane, the quadriceps fat pad is located anteriorly between the suprapatellar recess and quadriceps tendon, and the prefemoral fat pad is located between the suprapatellar recess and the femur. The infrapatellar fat pad of Hoffa is an intra-capsular but extra-synovial fat pad between the anterior knee joint and the patellar tendon. Various bursae exist around the anterior knee joint, including the prepatellar bursa anterior to the patella, the superficial infrapatellar bursa anterior to the distal patellar tendon, and the deep infrapatellar bursa between the patellar tendon and proximal tibia ( Fig. 7.1F ). Additional bursae are present around the medial knee, including the pes anserine bursa deep to the pes anserinus tendons, and the semimembranosus–tibial collateral ligament bursa, which has an inverted U shape located at the joint line between the medial collateral ligament and the semimembranosus tendon ( Fig. 7.1F ). These latter two bursae do not communicate with the knee joint. A more common bursa is the semimembranosus-medial gastrocnemius bursa, which, when distended, is called a Baker (or popliteal) cyst . This bursa communicates to the knee joint in 50% of adults who are older than 50 years and becomes a common recess for joint fluid and intra-articular bodies.


The knee joint is stabilized by a number of ligaments. Medially, the medial collateral ligament extends from the medial femoral condyle to the tibia in the coronal plane. Thin, deep layers of the medial collateral ligament (meniscofemoral and meniscotibial ligaments) extend from the meniscus to the femur and tibia, respectively, whereas a thicker, more superficial layer (tibial collateral ligament) extends from the femur to insert distally on the tibia deep to the pes anserinus. Superficial to the medial collateral ligament is found the deep crural fascia. The lateral or fibular collateral ligament originates from the lateral femur and extends over the popliteus tendon to insert on the lateral aspect of the fibula with the biceps femoris tendon. Other supporting structures of the posterolateral knee include the popliteofibular ligament and the arcuate ligament. The popliteofibular ligament extends from the popliteus tendon to the styloid process of the proximal fibula, whereas the arcuate ligament extends from the femur and joint capsule to the fibula tip as well. When a fabella is present, another posterolateral structure is the fabellofibular ligament. An additional ligament, the anterolateral ligament, extends from the lateral femoral epicondyle region to the anterolateral tibia between the tubercle of Gerdy and the fibula, with fibers also attaching to the lateral meniscus. The anterior and posterior cruciate ligaments within the intercondylar notch extend from the femur to the proximal tibia as intra-capsular but extra-synovial structures.
With regard to tendons around the knee, anteriorly the quadriceps femoris tendon inserts on the superior patellar pole, although superficial fibers extend over the patella (termed the prepatellar quadriceps continuation ) to insert on the tibial tuberosity as part of the patellar tendon. The medial and lateral patellar retinaculum extends from each side of the patella to the femur; the medial aspect is reinforced by the medial patellofemoral ligament, which extends from the medial patella to the adductor tubercle region of the medial femoral condyle. The distal aspect of the vastus medialis, termed the vastus medialis obliquus , blends with the medial patellar retinaculum to insert onto the medial patella. Medially and anteriorly, the sartorius, gracilis, and semitendinosus tendons insert on the tibia near the tibial collateral ligament as the pes anserinus (a helpful mnemonic is “Say Grace before Tea” where S, Sartorius; G, Gracilis; and T, semiTendinosis; or the abbreviation for sergeant as “SGT”). Posterior and proximal to the pes anserinus, the semimembranosus primarily inserts on the tibia just beyond the tibia articular surface, although the distal anatomy is quite complex. Posteriorly, the medial and lateral heads of the gastrocnemius originate from the posterior aspect of the femoral condyles. Laterally, the biceps femoris tendon and lateral collateral ligament attach to the lateral margin of the fibular head. The direct arm of the long head of the biceps femoris tendon inserts on the lateral aspect of the fibula with the lateral collateral ligament, whereas the anterior arm of the long head biceps femoris inserts more anterior on the fibula. The short head of the biceps femoris also has two insertions: the direct arm insertion on the proximal fibula medial to the long head and the anterior arm insertion on the proximal tibia. The popliteus tendon originates at the lateral aspect of the femur, lies within a groove or sulcus of the lateral femur, and courses obliquely with its muscle belly located between the posterior aspect of the tibia and the tibial artery and vein. Anterolaterally, the iliotibial tract or band inserts on the tubercle of Gerdy of the proximal tibia.
With regard to the peripheral nerves, the sciatic nerve bifurcates as the tibial nerve, which extends distally posterior to the popliteal artery and vein, and the common peroneal nerve, which courses laterally parallel and posterior to the biceps femoris tendon. The common peroneal or fibular nerve curves anteriorly around the fibular neck deep to the peroneus longus origin and bifurcates as the superficial peroneal nerve, which courses along the peroneal musculature, and the deep peroneal nerve, which continues to the interosseous membrane and follows the anterior tibial artery between the tibia and fibula.
Ultrasound Examination Technique
Table 7.1 is a checklist for a knee ultrasound examination. Examples of diagnostic knee ultrasound reports are shown in Boxes 7.1 and 7.2 .
Examination: Ultrasound of the Right Knee
Date of Study: March 11, 2016
Patient Name: Meg White
Registration Number: 8675309
History: Trauma
Findings: The extensor mechanism, including the quadriceps tendon, patella, and patellar tendon, is normal without bursal abnormalities. No significant joint effusion or synovial hypertrophy. The medial collateral and lateral collateral ligaments are normal. Unremarkable iliotibial tract, biceps femoris, popliteus tendon, and common peroneal nerve. No Baker cyst. Limited evaluation of the menisci is unremarkable.
Impression: Unremarkable ultrasound examination of the right knee.
Examination: Ultrasound of the Right Knee
Date of Study: March 11, 2016
Patient Name: Frank Ricard
Registration Number: 8675309
History: Pain, evaluate for cyst
Findings: The extensor mechanism, including the quadriceps tendon, patella, and patellar tendon, is normal. There is a moderate-sized joint effusion and no synovial hypertrophy or intra-articular body. The medial and lateral collateral ligaments are normal, as is the iliotibial tract, biceps femoris, popliteus tendon, and common peroneal nerve. There is medial compartment joint space narrowing and osteophyte formation with mild extrusion of the body of the medial meniscus, which is abnormally hypoechoic. No parameniscal cyst. There is a Baker cyst measuring 2 × 2 × 6 cm. Abnormal hypoechogenicity is noted at the inferior margin of the Baker cyst. There is also a hypoechoic cleft involving the posterior horn of the medial meniscus, which extends to the articular surface.
Impression:
- 1.
Baker cyst with evidence for rupture.
- 2.
Medial compartment osteoarthritis with moderate joint effusion.
- 3.
Suspect posterior horn medial meniscal tear. Consider MRI for confirmation if indicated.
- 1.
General Comments
Ultrasound examination of the majority of the knee structures is completed with the patient supine; the posterior structures are best evaluated with the patient prone. A high-frequency transducer of at least 10 MHz is typically used, with the exception of the posterior knee, for which a transducer of less than 10 MHz may be needed to penetrate the deep soft tissues. Evaluation of the knee may be focused over the area that is clinically symptomatic or that is relevant to the patient’s history. Regardless, a complete examination of all areas should always be considered and is recommended for one to become familiar with normal anatomy and normal variants and to develop a quick and efficient sonographic technique.
Anterior Evaluation
The primary structures evaluated from the anterior approach are the quadriceps tendon, the patella, the patellar tendon, the patellar retinaculum, the suprapatellar recess, the medial and lateral recesses, and the bursae around the anterior knee. Examination is begun in the sagittal plane proximal to the patella ( Fig. 7.2A ). This plane demonstrates the normal hyperechoic and fibrillar appearance of the quadriceps tendon ( Fig. 7.2B ). Slight flexion of the knee with a posterior pad or roll is helpful as this position straightens and tenses the extensor mechanism to reduce tendon anisotropy. Often, the trilaminar appearance of the quadriceps tendon can be appreciated, with the rectus femoris as the anterior layer, the combined vastus medialis and intermedius as the middle layer, and the vastus intermedius as the deepest layer (see Quadriceps Femoris Injury ). The quadriceps tendon is also evaluated in short axis ( Fig. 7.3 ). Returning to the quadriceps tendon in long axis, the suprapatellar recess is identified deep to the quadriceps tendon and evaluated for anechoic or hypoechoic joint fluid, which would separate the quadriceps fat pad (located superficial) from the prefemoral fat pad (located deep) ( Fig. 7.2 ). Slight knee flexion also shifts fluid from other parts of the knee joint into the suprapatellar recess. The transducer is then moved inferiorly below the patella in the sagittal plane to visualize the hyperechoic, fibrillar, and uniform patellar tendon ( Fig. 7.4 ). The infrapatellar fat pad of Hoffa appears minimally hyperechoic or isoechoic to muscle deep to the patellar tendon. The transducer should also be floated on a layer of gel over the patella and proximal patellar tendon to evaluate for patellar fracture, as well as prepatellar bursal fluid, because the latter may be easily redistributed out of view with the slightest transducer pressure. The region around the distal patellar tendon is also evaluated for superficial and deep infrapatellar bursal fluid; minimal fluid in the latter is considered physiologic (see Other Bursae ). Although long axis is most important in evaluation of extensor mechanism abnormalities, imaging should also be completed in short axis to ensure a thorough evaluation, especially with the patellar tendon, where a focal abnormality may not be located in midline ( Fig. 7.5 ).


The transducer is then moved to both the medial and lateral margins of the patella in the transverse plane ( Fig. 7.6 ). The thin hyperechoic patellar retinaculum is visualized as well as potential distention of the medial and lateral joint recesses, which is more apparent when the knee is completely extended. One must be careful not to displace joint fluid from view with transducer pressure (see Joint Effusion and Synovial Hypertrophy ). The patellar retinaculum may demonstrate three defined layers. Within the medial patellar retinaculum, the medial patellofemoral ligament may be identified as a hyperechoic, compact fibrillar structure, which extends from the adductor tubercle of the femur to the patella. Finally, with the knee in flexion, the hypoechoic hyaline cartilage that covers the trochlea of the anterior femur can be visualized in the transverse plane superior to the patella ( Fig. 7.7A and B ), and the hypoechoic hyaline cartilage covering the anterior and central aspects of the femoral condyles can be seen in the parasagittal plane ( Fig. 7.7C ). With knee flexion, the anterior aspect of the anterior cruciate ligament can be visualized in the oblique sagittal plane with the transducer angled from the intercondylar notch to the medial tibia.


Medial Evaluation
For medial knee evaluation, the patient remains supine and rotates the hip externally to gain access to the medial structures. The structures of interest include the medial collateral ligament (composed of several layers), the body and anterior horn of the medial meniscus, and the pes anserinus. To begin, the transducer is placed in the coronal plane along the medial joint line, which is identified by the bone contours of the femoral condyle and the proximal tibia ( Fig. 7.8A ). The hyperechoic and fibrillar superficial layer of the medial collateral ligament (or tibial collateral ligament) is easily identified in long axis ( Fig. 7.8B ), which extends from the medial femoral condyle distally and to the proximal tibial metaphysis. With rotation of the transducer short axis to the tibial collateral ligament, the anteroposterior extent of this structure can be appreciated ( Fig. 7.9A and B ). By toggling the transducer along the long axis of the tibial collateral ligament, the borders of the ligament can be better appreciated because the ligament fibers become hypoechoic as a result of anisotropy and the adjacent soft tissues remain hyperechoic ( Fig. 7.9C ). Returning to the coronal plane or long axis to the tibial collateral ligament, the thinner hyperechoic deep layers of the medial collateral ligament, also called the meniscofemoral and meniscotibial ligaments , are identified from the meniscus to the femur and tibia, respectively ( Fig. 7.8B ). The fibrocartilage meniscus is identified as a triangular hyperechoic structure between the femur and the tibia. The transducer is then moved anteriorly from the coronal plane to the oblique-sagittal plane to visualize the anterior horn of the medial meniscus.


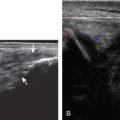
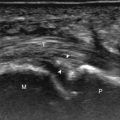
Returning back to the coronal plane long axis to the tibial collateral ligament, the transducer is moved distally beyond the joint line along the tibial collateral ligament and slightly anterior to visualize its attachment on the tibia, approximately 4–5 cm beyond the joint line ( Fig. 7.10A ). Here, the pes anserinus can be seen as three hyperechoic tendons superficial to the tibial collateral ligament that converge onto the tibia. Toggling the transducer is often helpful because this will cause the tendons of the pes anserinus superficial to the tibial collateral ligament to appear hypoechoic from anisotropy and be more conspicuous. By turning the transducer to the oblique-axial plane along the long axis of each pes anserinus tendon, the individual sartorius, gracilis, and semitendinosus tendons can be seen; they extend to their tibial attachment as the pes anserinus ( Fig. 7.10B ). The more proximal aspects of the pes anserinus tendons can also be visualized when the posterior knee is evaluated. One potential pitfall in evaluation of the posterior aspect of the medial meniscus body is misinterpretation of the adjacent semimembranosus tendon anisotropy as a parameniscal cyst. Identification of a hypoechoic round structure just distal to the meniscus with an associated osseous groove represents anisotropy of the semimembranosus tendon at its tibial insertion ( Fig. 7.11 ). The normal semimembranosus tendon may be confirmed with the transducer repositioned long axis and perpendicular to the tendon to demonstrate the normal hyperechoic and fibrillar echotexture.


Lateral Evaluation
For evaluation of the lateral knee structures, the leg is internally rotated, or the patient rolls partly onto the contralateral side. Structures of interest laterally include the iliotibial tract (or band), the lateral (or fibular) collateral ligament, the biceps femoris tendon, the anterolateral ligament, the supporting structures of the posterolateral corner of the knee, and the common peroneal nerve. To begin, the transducer may be initially placed over the anterior knee long axis to the patellar tendon. The transducer is then moved laterally ( Fig. 7.12A ) and the next fibrillar structure identified is the iliotibial tract or band, which inserts on the Gerdy tubercle of the proximal tibia, which may also be identified via palpation ( Fig. 7.12B ). The transducer is then moved proximally to evaluate the tissues between the iliotibial tract and the distal femur for disorders related to iliotibial band friction syndrome.


Next, the transducer is moved laterally to the coronal plane over the lateral femoral condyle to identify an important bone landmark, which is the groove or sulcus for the popliteus tendon. At this site, the femoral attachment of the lateral collateral ligament is identified at the proximal ridge of the groove, as well as the adjacent popliteus tendon. To visualize the lateral collateral ligament in long axis, the proximal aspect of the transducer is then fixed to the femur at this site while the distal aspect is rotated posteriorly toward the fibular head ( Fig. 7.13A ). In this position, the hyperechoic and fibrillar echotexture of the lateral collateral ligament is seen, which extends from the lateral femoral condyle to the lateral aspect of the fibular head ( Fig. 7.13B and C ). The proximal aspect of the lateral collateral ligament extends over the popliteus tendon located within the femoral groove. The distal insertion on the fibula may appear thickened and heterogeneous owing to the bifurcating distal biceps femoris tendon seen both superficial and deep to the lateral collateral ligament ( Fig. 7.13C ). If the knee is in valgus angulation, the lateral collateral ligament may have a wavy appearance with anisotropy. This effect can be minimized with the patient positioned so that the opposite knee is flexed under the knee being examined, or with a pillow placed between the knees, which places the knee in slight varus angulation.


After the transducer is moved along the lateral collateral ligament to its fibular attachment, the distal aspect of the transducer is fixed to the fibular head while the proximal aspect is rotated posteriorly to the coronal plane ( Fig. 7.14A ) to bring the biceps femoris tendon into view; this tendon is differentiated from ligament by the less compact fibrillar echotexture and the associated hypoechoic muscle more proximally ( Fig. 7.14B ). Both the lateral collateral ligament and the biceps femoris tendon insert onto the lateral aspect of the proximal fibula. The distal biceps femoris may appear heterogeneous as fibers bifurcate both superficial and deep to the lateral collateral ligament at the fibula, which should not be mistaken for tendinosis (see Fig. 7.13C ). The transducer placement for evaluating the iliotibial tract, lateral collateral ligament, and biceps femoris has the configuration of a “Z.”


As the transducer is then moved posteriorly from the biceps femoris in the coronal plane, the relatively hypoechoic and striated appearance of the common peroneal nerve can be seen in long axis ( Fig. 7.15A ), although peripheral nerves are more conspicuous when visualized in short axis ( Fig. 7.15B ). Evaluation proximal to the fibula is best evaluated in short axis from a posterior approach with the patient prone, which shows the relative locations of the lateral collateral ligament, the biceps femoris, and the common peroneal nerve ( Fig. 7.15B ).

To evaluate the anterolateral ligament, the transducer is placed over the anterolateral tibia approximately midway between the Gerdy tubercle and the fibula and angled toward the proximal lateral collateral ligament origin ( Fig. 7.16A ). The anterolateral ligament will be seen as a linear hyperechoic structure attaching to the lateral meniscus and the proximal femur from the tibia ( Fig. 7.16B ) ( ).


Returning to the popliteus groove in the lateral femoral condyle in the coronal plane, the popliteus tendon may be followed as it curves posteriorly around the knee joint. The adjacent hyperechoic fibrocartilage body and anterior horn of the lateral meniscus may also be evaluated. Because of the curved course of the popliteus tendon, this tendon is assessed in segments to avoid misinterpretation of hypoechoic anisotropy as tendon abnormality ( Fig. 7.17A ). The popliteus muscle is best evaluated from a posterior approach, in which the muscle belly is located between the tibia and the tibial vessels (see Posterior Evaluation ). Finally, a hyperechoic extension from the popliteus tendon at the joint line may be seen, which attaches to the fibular styloid, called the popliteofibular ligament ( Fig. 7.17B ). Other supporting structures of the posterolateral corner, such as the arcuate ligament and the possible fabellofibular ligament, are difficult to identify.

Posterior Evaluation
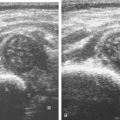
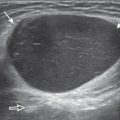
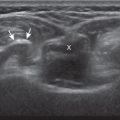
To evaluate the posterior structures of the knee, the patient is turned prone. The structures and pathology of interest include a Baker (or popliteal) cyst, the posterior horns of the menisci, the cruciate ligaments, and the neurovascular structures of the posterior knee. Examination begins with evaluation for a Baker cyst. The key bone landmark is the rounded surface of the medial femoral condyle with a layer of hypoechoic hyaline cartilage. To identify this site, the transducer may be placed over the central aspect of the posterior knee in the transverse plane to identify the neurovascular structures and bone landmarks of the intercondylar notch ( Fig. 7.18 ). The transducer is then moved medially to identify the medial femoral condyle ( Fig. 7.19 ). At this site, the medial head of the gastrocnemius and semimembranosus tendons are seen, with the latter seen more medially. These are the key soft tissue landmarks as a Baker cyst must display a channel or neck between these two tendons. The semitendinosus tendon is also identified immediately superficial to the semimembranosus tendon. To assist in identifying these tendons, the transducer can be toggled to create anisotropy, which causes the tendons to become hypoechoic ( Fig. 7.20 ) ( ). In addition, toggling the transducer can correct for anisotropy and avoid the pitfall of mistaking a hypoechoic tendon from anisotropy as a Baker cyst ( Fig. 7.20A ). The course of the medial head of the gastrocnemius tendon is not parallel to that of the semimembranosus tendon; therefore, it may be difficult to have both tendons appear hyperechoic in the same plane. If a Baker cyst is identified, the transducer is then turned in the sagittal plane to evaluate the extent of the Baker cyst and to assess for rupture. The semitendinosus can also be imaged from this point distally to its insertion at the pes anserinus.


The transducer is then moved over the medial aspect of the posterior knee in the sagittal plane to again identify the posterior femoral condyle ( Fig. 7.21A ). At this location, the posterior horn of the medial meniscus is evaluated; this structure normally appears hyperechoic and triangular ( Fig. 7.21B ). A lower-frequency transducer (less than 10 MHz) may be required to visualize the meniscus. At the medial aspect of the medial meniscus posterior horn, the semimembranosus can be seen as it inserts on the posteromedial tibial cortex, just beyond the meniscus at a prominent concavity or sulcus in the bone. With anisotropy, the normal semimembranosus tendon may appear hypoechoic and may potentially simulate a parameniscal cyst (see Fig. 7.11 ).


The transducer is then moved toward the midline in the sagittal plane, and the posterior cruciate ligament is seen with its attachment to the posterior tibia, identified by characteristic bone contours ( Fig. 7.21C ). The normal posterior cruciate ligament may appear artifactually hypoechoic as a result of anisotropy, but its thickness should be uniform and less than 1 cm. Anisotropy of the posterior cruciate ligament may be reduced with the heel-toe maneuver or the use of beam steering (available on some ultrasound machines). The transducer is then moved laterally to assess the posterior horn of the lateral meniscus, although accurate identification of pathology is difficult in this location because the popliteus tendon and sheath cross at the peripheral aspect of the lateral meniscus ( Fig. 7.21D ).
The transducer is then turned to the transverse plane and positioned over the intercondylar notch (see Fig. 7.18A ). Normally, this space should be hyperechoic, which contains the anterior cruciate ligament along the lateral aspect and the adjacent hyperechoic fat (see Fig. 7.18B ). Identification of the anterior cruciate ligament may be improved by toggling the transducer because the normal ligament becomes hypoechoic relative to the adjacent hyperechoic fat as a result of anisotropy. Finally, the popliteal artery and vein are evaluated in short axis and long axis. The muscle belly of the popliteus is located between these vessels and the tibia. The tibial nerve can be followed proximally to its junction with the common peroneal nerve at the sciatic nerve, which is evaluated with the posterior thigh. Although the sciatic nerve demonstrates a honeycomb appearance from hypoechoic nerve fascicles and surrounding hyperechoic connective tissue, the smaller peripheral nerve branches may consist of only a few hypoechoic fascicles.
Joint Abnormalities
Joint Effusion and Synovial Hypertrophy
Increased joint fluid in the knee is characterized by anechoic or hypoechoic distention of the knee joint recesses. Evaluation of the anterior knee joint recesses, namely the suprapatellar recess, and medial and lateral recesses are most accessible. With 30 degrees of knee flexion, there is preferential distention of the suprapatellar recess with joint fluid that extends superiorly from the central joint compartment ( Fig. 7.22 ; see Fig. 7.1F ). Suprapatellar recess distention will separate the quadriceps and prefemoral fat pads, and extend superiorly and anteriorly to contact the quadriceps tendon. Often small amounts of fluid may only be seen superolateral to the patella in the suprapatellar recess, where detection may be improved with quadriceps muscle contraction. This is an ideal location for ultrasound-guided aspiration or injection. In knee extension, joint recess distention may be seen only medial or more likely lateral to the patella in the transverse plane without distention of the suprapatellar recess ( Fig. 7.23 ). Larger joint effusions will typically distend all three recesses. When imaging the medial and lateral recesses, transducer pressure should be minimized to avoid collapse of the joint recess and displacement of the joint fluid out of view ( ). Joint fluid may also collect in the popliteus tendon sheath or in a Baker cyst when communication exists with the posterior knee joint. The lateral perimeniscal recesses may also distend, which should not be mistaken for parameniscal cyst ( Fig. 7.24 ). A superior patellar plica, which is located in the transverse plane through the suprapatellar recess superior to the patella, may uncommonly completely separate the suprapatellar recess into two compartments ( Fig. 7.25 ). In the setting of an intra-articular fracture, several layers of varying echogenicity within the joint may be visible as a lipohemarthrosis ( Fig. 7.26 ).


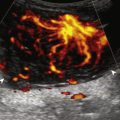
The causes of joint effusion are many; however, ultrasound including color or power Doppler imaging cannot distinguish between aseptic and septic effusion ( Figs. 7.27 and 7.28 ). If joint recess distention is not anechoic but rather hypoechoic, isoechoic, or hyperechoic to subcutaneous fat, then considerations include complex fluid versus synovial hypertrophy. Compressibility of the joint recess, redistribution of recess contents, or swirling of the contents with compression or joint movement, and lack of internal flow on color Doppler imaging all suggest complex fluid rather than synovial hypertrophy ( ). The differential diagnosis for complex fluid includes infection ( Fig. 7.28 ), gout, hemorrhage ( Fig. 7.29 ), and lipohemarthrosis (see Fig. 7.26 ). If there is concern for infection, percutaneous aspiration should be considered.


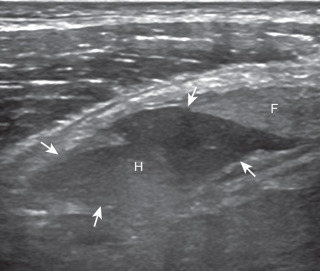
Inflammatory synovial hypertrophy may be associated with cortical erosions, characterized by cortical irregularity and discontinuity visualized in two planes, often associated with increased blood flow on color Doppler imaging. Although synovial hypertrophy may also result from inflammation, such as chronic infection (see Fig. 7.28 ), rheumatoid arthritis ( Fig. 7.30 ), seronegative arthritis ( Fig. 7.31 ), crystal deposition ( Fig. 7.32 ), and particle disease from arthroplasty wear ( Fig. 7.33 ), synovial proliferative disorders such as pigmented villonodular synovitis ( Fig. 7.34 ), lipoma arborescens, and synovial chondromatosis are other considerations, with possible hyperechoic foci seen in the last condition when calcified. The differential diagnosis for mixed hyperechoic and hypoechoic tissue associated with the suprapatellar recess with compressible vascular channels is synovial hemangioma (see Vascular Abnormalities ). Localized nodular synovitis may also occur in the knee joint recesses, and it typically appears hypoechoic and noncompressible with possible increased through-transmission ( Fig. 7.35 ). Dynamic imaging may demonstrate snapping of synovial hypertrophy ( ). In the setting of a total knee arthroplasty, abnormal synovial hypertrophy may cause snapping, termed patellar clunk syndrome ( Fig. 7.36 ) ( ). Within joint fluid, intra-articular bodies may be identified, commonly in a Baker cyst (see Baker Cyst ) or suprapatellar recess ( Fig. 7.37 ). Such intra-articular bodies may be hypoechoic if cartilaginous or echogenic with shadowing if calcified or ossified and may be mobile with dynamic imaging ( ). When an intra-articular body is identified, the hyaline articular cartilage should be evaluated for a donor site ( Fig. 7.38 ).


Cartilage Abnormalities
One common cause of joint effusion is a cartilage abnormality. Meniscal degeneration may appear as heterogeneous or internal hypoechogenicity, whereas a meniscal tear appears as a well-defined anechoic or hypoechoic cleft that extends to the articular surface, or possibly meniscal irregularity and truncation ( Fig. 7.39 ). Sensitivity and specificity for diagnosis of meniscal tears using ultrasound have been described as 88% and 85%, respectively. Because ultrasound evaluation of the menisci is limited due to incomplete visualization and inadequate delineation of displaced tears, MRI remains the imaging method of choice for evaluation of the menisci. However, evaluation of the menisci can be accomplished in minutes, and pathologic features may be seen, including displacement of meniscal tissue during knee movement visualized dynamically ( and ). The posterior horn of the medial meniscus is the most common site for tears, so evaluation should be at least considered at this site.