CHAPTER 12 Liver
CLINICAL CONSIDERATIONS
Laboratory Tests Relevant to Hepatic Imaging
Antismooth Muscle Antibody
An increased antismooth muscle antibody level can be present in the setting of autoimmune hepatitis.
LIVER ANATOMY
Brief Review of Segmental Anatomy
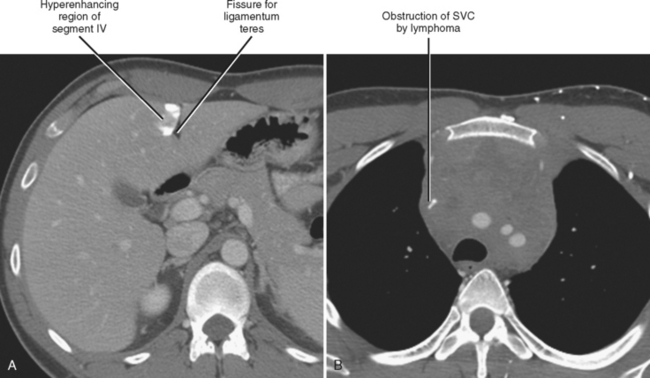
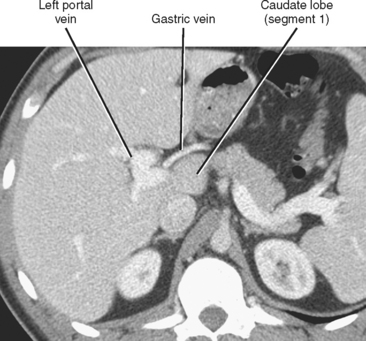
Knowledge of segmental anatomy of the liver is critical because the hepatic segments represent discrete regions that can be surgically isolated and removed. Localization of an abnormality to the correct segment is a necessary part of surgical planning. Several systems are currently in use describing the anatomic segments of the liver (Table 12-1). The Couinaud–Bismuth system is currently the most often used nomenclature, although many surgeons are transitioning to the Brisbane terminology. According to the Brisbane 2000 Terminology of Liver Anatomy, the liver is divided into a right hemiliver (commonly referred to as the right lobe) and a left hemiliver (commonly referred to as the left lobe) by a vertical plane along the course of the middle hepatic vein that intersects the gallbladder fossa. The right hemiliver is divided into anterior and posterior sections (also known as segments under the terminology of Goldsmith and Woodburne) by a vertical plane along the right hepatic vein. The medial and lateral sections of the left hemiliver are divided by the fissure for the ligamentum teres, which contains the falciform ligament. The caudate lobe (segment I) protrudes from the right hemiliver between the portal vein and inferior vena cava (IVC).
Table 12-1 Nomenclature in Common Use for Describing Liver Anatomy
| Brisbane | Couinaud–Bismuth | Goldsmith and Woodburne |
|---|---|---|
| Right Hemiliver | Right Lobe | Right Lobe |
| Anterior Section | Anterior Segment | |
| Segment VIII (upper) | Segment VIII (upper*) | |
| Segment V (lower) | Segment V (lower*) | |
| Posterior Section | Posterior Segment | |
| Segment VII (upper) | Segment VII (upper) | |
| Segment VI (lower) | Segment VI (lower) | |
| Left Hemiliver | Left Lobe | Left Lobe |
| Medial Section | Medial Segment | |
| Segment IVa (upper) | Segment IVa (upper) | |
| Segment IVb (lower) | Segment IVb (lower) | |
| Lateral Section | Lateral Segment | |
| Segment II (upper) | Segment II (upper) | |
| Segment III (lower) | Segment III (lower) | |
| Caudate | Segment I | Segment I |
* Upper refers to above the transverse scissura described by the right and left portal veins; lower refers to below the transverse scissura described by the right and left portal veins.
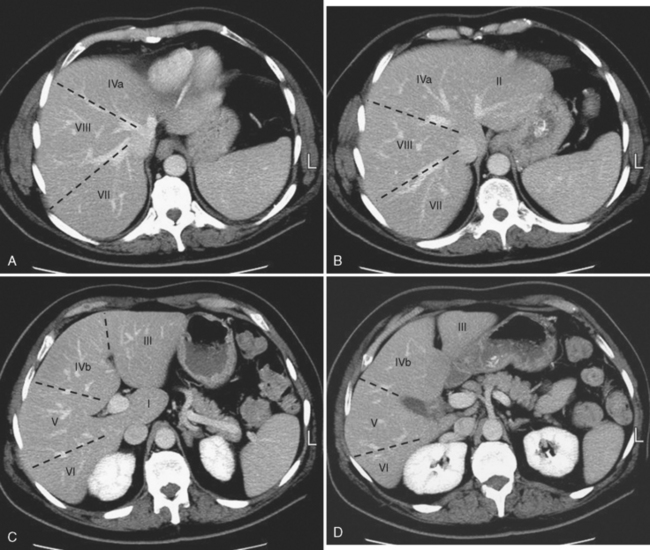
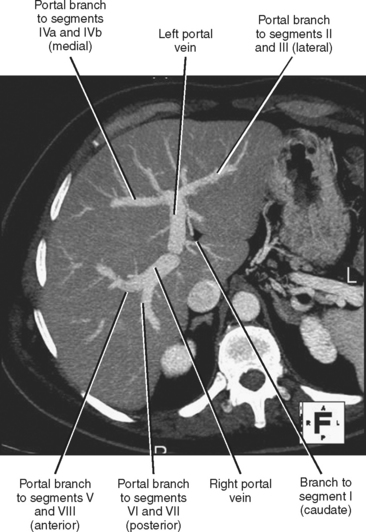
The liver is further divided into segments by a transverse plane (scissura) along the right and left portal vein branches. Each segment has its own blood supply and biliary drainage. These segments are illustrated for multidetector computed tomography (CT) in Figure 12-1. For purposes of this textbook, we refer to the right and left lobes of the liver and use predominately the Couinaud–Bismuth terminology for segments, because this terminology is most familiar to radiologists. However, it is important to be familiar with systems of nomenclature in common use at one’s own institution to facilitate accurate communication.
Clinically Relevant Vascular Anatomy of the Liver
Hepatic Veins
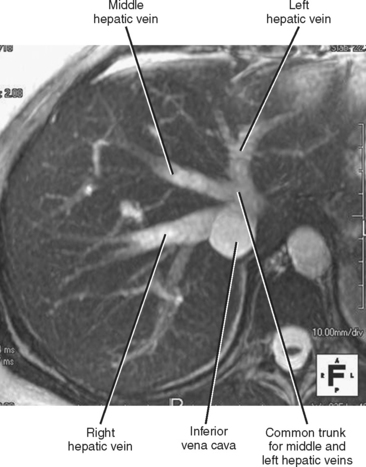
The right, middle, and left hepatic veins converge at the hepatic venous confluence and drain blood from the liver into the IVC just below the right atrium. The hepatic venous confluence has a variety of configurations, but most commonly, the middle and left hepatic veins share a common trunk before entering the IVC (Fig. 12-2). Segment I (caudate lobe) has a separate venous drainage directly to the IVC.
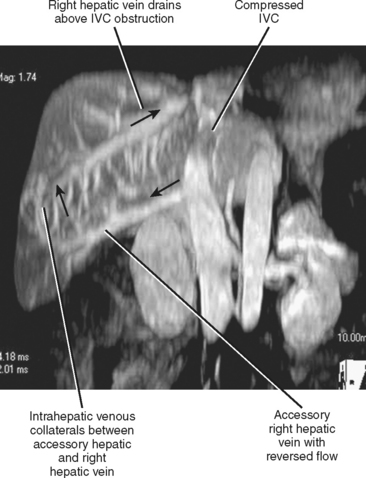
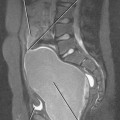
Many individuals have accessory hepatic veins that drain the inferior right hepatic lobe directly into the IVC. In some patients, more than one inferior accessory vein is present. These have a similar relevance to hepatic transplant surgery as large tributaries of the middle hepatic vein. In general, tributaries and accessory hepatic veins in the range of 5 to 10 mm in diameter that cross a transection plane are considered significant. Inferior accessory hepatic veins can also serve as a collateral pathway to circumvent intrahepatic vena cava obstruction (Fig. 12-3).
Portal Veins
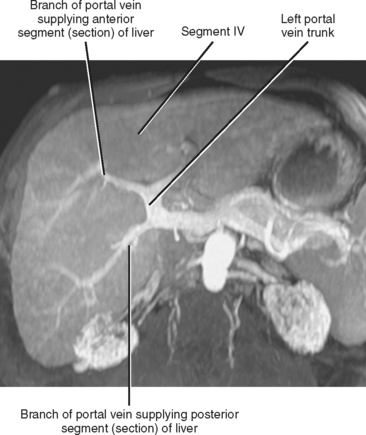
The portal vein forms from the confluence of the splenic and superior mesenteric veins, and normally contributes a substantial portion of the hepatic blood flow (at least 75%). The main portal vein travels within the hepatoduodenal ligament as it enters the liver hilum. The portal vein typically bifurcates into right and left branches, each of which subsequently branches into anterior and posterior branches (right portal vein) or medial and lateral branches (left portal vein) (Fig. 12-4). These major branches further bifurcate to supply their respective hepatic segments. The portal vein branch to the caudate lobe can originate from either the left or the right portal vein.
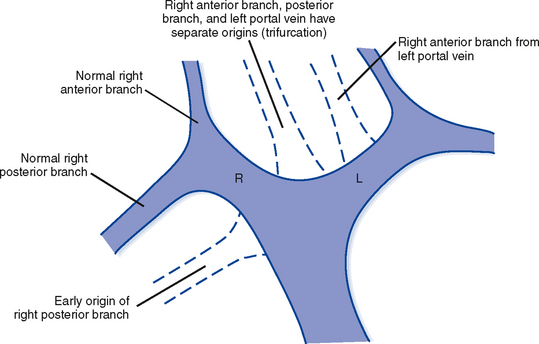
The branching pattern of the portal vein may have important implications for the liver surgeon. It is important to recognize portal vein branching variants in patients scheduled for liver resection or donor hemihepatectomy to prevent inadvertent interruption of the portal blood supply to the remaining liver. A variety of portal vein branching variations have been described. Portal trifurcation refers to simultaneous branching of the main portal vein into right posterior segment, right anterior segment, and left portal vein branches (Fig. 12-5). Additional variants are possible involving the lack of a common trunk for the right posterior and anterior segment branches, including origin of the right posterior segment branch from the main portal vein and origin of the right anterior segment branch from the left portal vein (Figs. 12-6 and 12-7). Other, less frequent anomalous portal branching patterns are possible. Some studies have demonstrated a somewhat weak concordance between anomalous portal vein branching and variant bile duct anatomy. However, bile duct anomalies can be present in the absence of variant portal venous branching, and the presence of a normal/classic portal vein branching pattern does not preclude anomalous biliary anatomy. Anomalous branching of the portal vein has also been associated with malposition of the gallbladder. Additional congenital variants of the portal vein include prepancreatic portal vein (often associated with situs inversus), double portal vein, and agenesis of the main portal vein or one of its major branches.
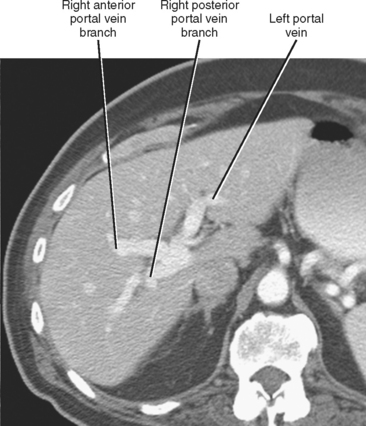
Figure 12-5 Contrast-enhanced axial computed tomographic scan of a patient with portal trifurcation.
Hepatic Artery
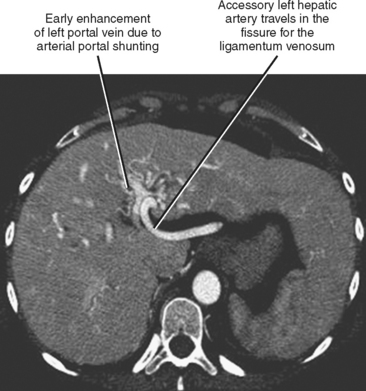
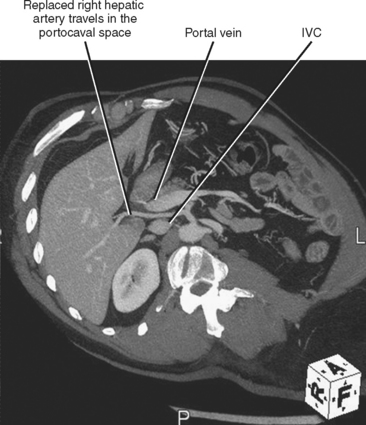
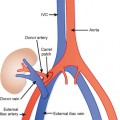
Fortunately, most replaced or accessory arteries can be identified by looking in only two locations. The replaced or accessory left hepatic artery arising from the left gastric artery can be found traveling in the fissure for the ligamentum venosum (Fig. 12-8). The replaced or accessory right hepatic artery can usually be identified in the portocaval space (Fig. 12-9). The most common hepatic artery variants are the left hepatic artery (or a portion thereof) arising from the left gastric artery and the right hepatic artery (or a portion thereof) originating from the superior mesenteric artery. Other variants include origin of the hepatic artery directly from the aorta; origin of one of the hepatic arteries before the origin of the gastroduodenal artery; trifurcation of the hepatic artery into left, right, and gastroduodenal arteries; and origin of the left hepatic artery from the celiac axis.
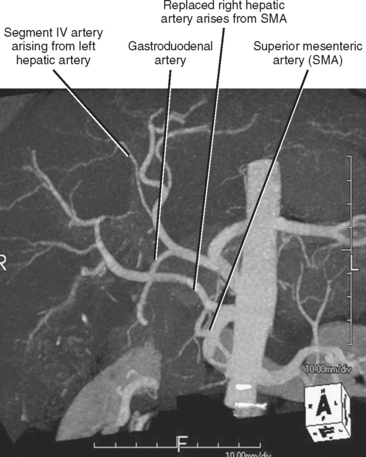
The artery supplying segment IV of the liver is often overlooked but is important to identify in patients who may be undergoing hemihepatectomy (including living hemiliver donors) (Fig. 12-10). In particular, it is important to note whether the segment IV artery arises from the left or right hepatic artery. When arising from the right hepatic artery, additional steps are needed to preserve the segment IV artery during right hepatectomy. A segment IV artery arising from the right hepatic artery has occasionally been referred to as a middle hepatic artery. The posterior part of segment IV can also receive blood supply from caudate artery branches.
Nonportal Venous Supply to the Liver
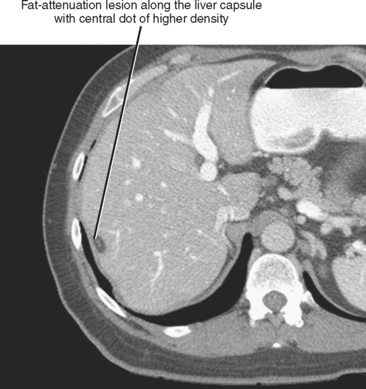
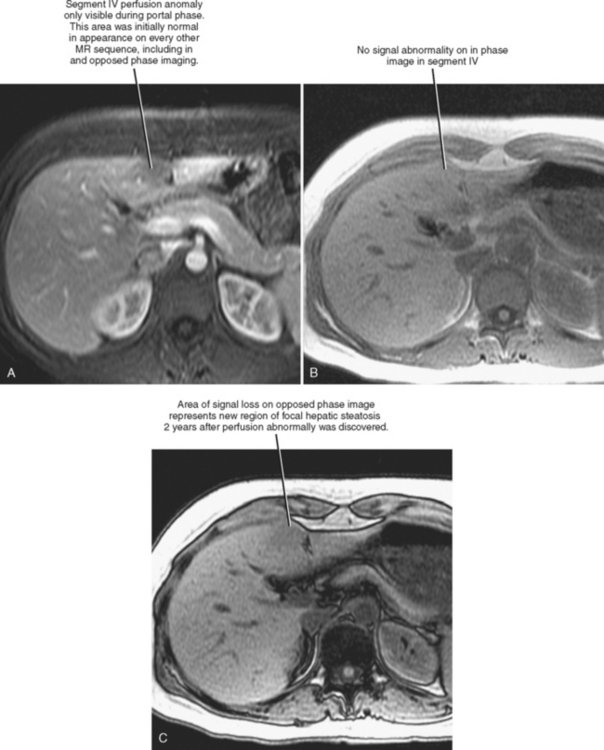
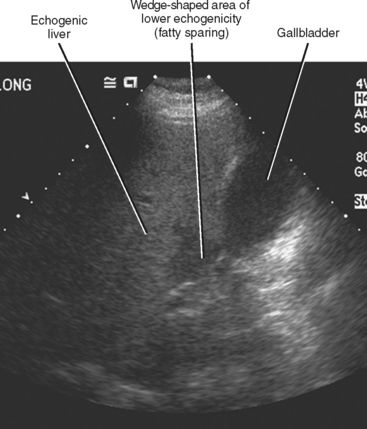
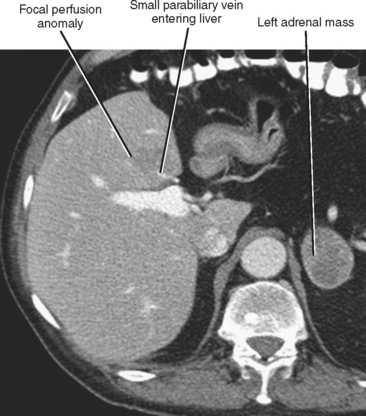
Four major groups of veins drain into the liver aside from the main portal vein: paraumbilical, cholecystic, gastric, and parabiliary. Most radiologists associate the paraumbilical veins (also referred to as the superior and inferior veins of Sappey) with portal hypertension; in which case, they serve to divert portal blood flow to the systemic circulation. However, the paraumbilical veins normally drain toward the liver and into the hepatic parenchyma along the falciform ligament. These veins may be responsible for fatty infiltration or perfusionrelated pseudolesions in this location (Fig. 12-11). Paraumbilical veins communicate with the epigastric veins and can serve as a collateral pathway in the setting of superior vena cava or IVC obstruction. This helps explain the occasional finding of focal enhancement in the region of the falciform ligament on early-phase CT or magnetic resonance imaging (MRI) in patients with caval obstruction (Fig. 12-12). Hepatic inflow via the cystic (or cholecystic) vein may result in a perfusion-related pseudolesion in the region of the gallbladder fossa during enhanced CT and MRI, or may manifest as areas of focal fatty sparing adjacent to the gallbladder fossa in the setting of hepatic steatosis (Fig. 12-13). Gastric veins that drain into the liver are another potential source of perfusion-related pseudolesions, focal fatty infiltration, or focal fatty sparing involving segments II, III, and IV (Fig. 12-14). The last major group of systemic inflow veins is the parabiliary veins, better known for their role in bypassing portal vein occlusion (cavernous transformation of the portal vein). These veins drain the region of the pancreatic head and duodenum, course along the common bile duct in the hepatoduodenal ligament, and enter the liver at the hilum. They are responsible for perfusion-related pseudolesions and focal fatty infiltration or sparing adjacent to the liver hilum in the caudate and left hepatic lobes (Fig. 12-15).
NORMAL IMAGING APPEARANCE OF THE LIVER
Computed Tomography
With CT, normal hepatic parenchyma is of homogeneous density, with attenuation values in the range of 45 to 65 HU. The normal liver is typically 5 to 10 HU denser than the normal spleen on an unenhanced CT image. The normal liver can vary considerably in shape between individuals. Typical liver volumes as determined by CT are approximately 1700 and 1400 ml for male and female individuals, respectively, although this also varies considerably between individuals. The degree of parenchymal enhancement after administration of intravenous contrast material varies with injection rate, injected volume, and the timing of image acquisition after contrast administration. Peak liver enhancement increases with contrast volume and concentration, and decreases with increasing body weight. Peak hepatic parenchymal enhancement lags behind that of the renal cortex and pancreas. Table 12-2 presents the timing of the various phases of a dynamic contrastenhanced CT examination in a typical patient.
Table 12-2 Timing of Hepatic Enhancement Phases after Start of Contrast Bolus
| Phase | Timing |
|---|---|
| Early arterial (for computed tomography angiographic studies) | 20-25 seconds |
| Late arterial | 30-40 seconds |
| Portal venous | 60-90 seconds |
| Equilibrium | 3-5 minutes |
These estimates vary depending on type of scanner and injection protocol.
DIFFUSE ABNORMALITIES OF THE LIVER
Approach to Diffuse Liver Abnormalities
Table 12-3 Causes of Diffusely Altered Appearance of the Liver
| Imaging Examination | Decreased | Increased |
|---|---|---|
| Echogenicity (US) | Hepatitis, tumor | Steatosis, fibrosis, tumor |
| Attenuation (CT) | Steatosis, hepatitis, tumor | Iron, glycogen, amiodarone (Fig. 12-16), iodine |
| T1W SI (in-phase MRI) | Iron,* edema | Steatosis, gadolinium, manganese |
| T1W SI (opposed-phase MRI) | Steatosis, iron* | Gadolinium, manganese |
| T2W SI (MRI)† | Iron | Edema, fibrosis, fat |
CT, Computed tomography; MRI, magnetic resonance imaging; SI, signal intensity; T1W, T1-weighted; T2W, T2-weighted; US, ultrasound.
* Signal loss because of iron will worsen as echo time increases.
† Echo train spin-echo sequence without fat suppression.
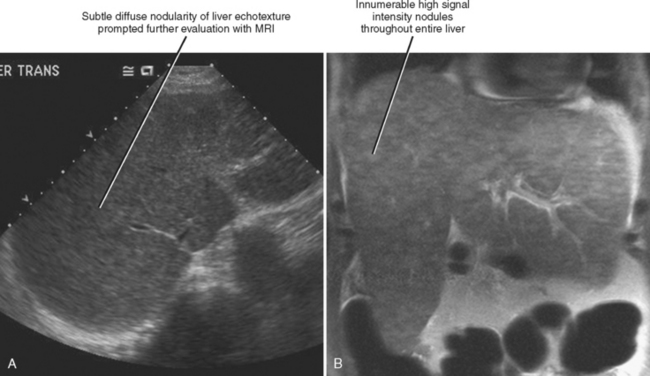
Table 12-4 Hemodynamic Disturbances of the Liver
| Condition | Enhancement Pattern and Associated Findings |
|---|---|
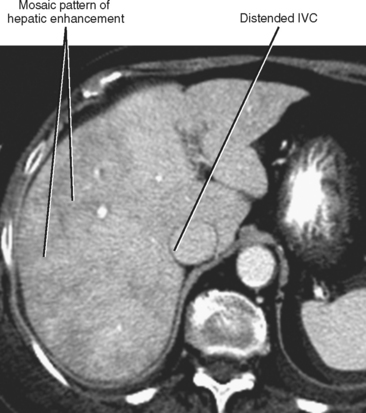
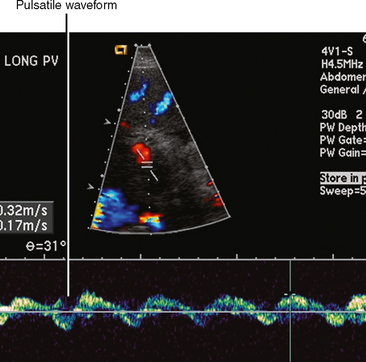
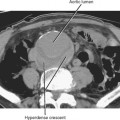
| Hepatic congestion (Fig. 12-18) | Heterogeneous, mosaic-like pattern of enhancement associated with enlargement of the inferior vena cava (IVC) and hepatic veins. Reflux of contrast into the IVC and hepatic veins can be present, although this finding alone is not specific for cardiac dysfunction. Doppler ultrasound can demonstrate pulsatility of the portal vein (Fig. 12-19). |
| Budd–Chiari syndrome | Decreased early peripheral enhancement and increased enhancement of the central portions of the liver, particularly the caudate lobe. Nonenhancing hepatic vein or IVC thrombus may be present. |
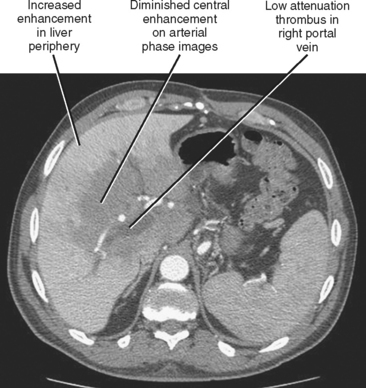
| Main portal vein occlusion (Fig. 12-20) | Preferential early enhancement of the liver periphery with diminished central and caudate lobe enhancement. This pattern approximates the opposite of that seen with Budd–Chiari syndrome. |
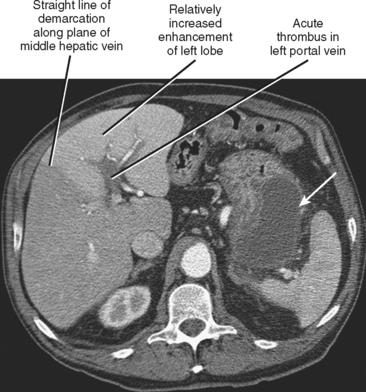
| Right or left portal vein occlusion (Fig. 12-21) | Increased enhancement of liver on side of occlusion during arterial phase with straight border along middle hepatic vein. Steatosis involving one lobe of liver may develop over time (Fig. 12-22). |
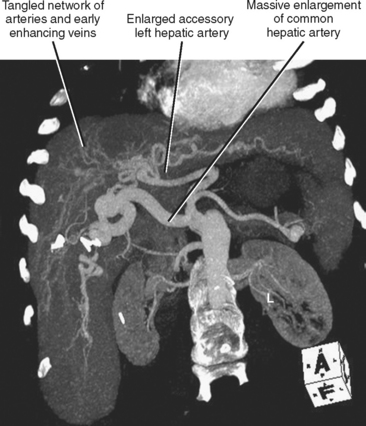
| Hereditary hemorrhagic telangiectasia (Fig. 12-23) | Multiple intrahepatic vascular malformations and arteriovenous shunts can result in a bizarre, diffusely heterogeneous early enhancement pattern. Marked enlargement of the hepatic artery is often present. |
Specific Deposition Disorders of the Liver
Steatosis
More commonly referred to as fatty liver, hepatic steatosis is often dismissed as a clinically insignificant radiologic finding. However, diffuse fatty infiltration of the liver can be associated with increased liver function tests, and if left unchecked, some types of steatosis can progress to steatohepatitis (manifesting as diffuse fatty infiltration, abnormal liver function tests, and hepatomegaly) and cirrhosis. For this reason, steatosis is a finding worthy of reporting. Hepatic steatosis results from a variety of hepatic insults in addition to dietary indiscretion (Box 12-1).
Sonography is the least specific cross-sectional imaging modality for the diagnosis of hepatic steatosis. The diagnosis may be suggested when the hepatic parenchyma demonstrates increased echogenicity associated with sound attenuation, resulting in poor depth of penetration and poor visualization of the hepatic veins, portal triads, and diaphragm (Fig. 12-24).
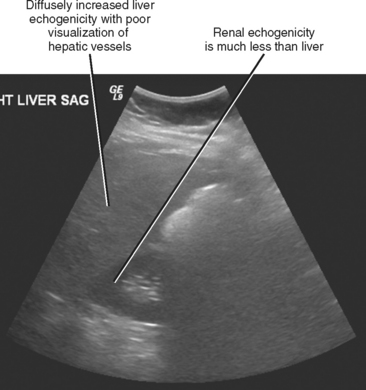
Figure 12-24 Longitudinal right upper quadrant sonogram through the liver and right kidney of a patient with hepatic steatosis.
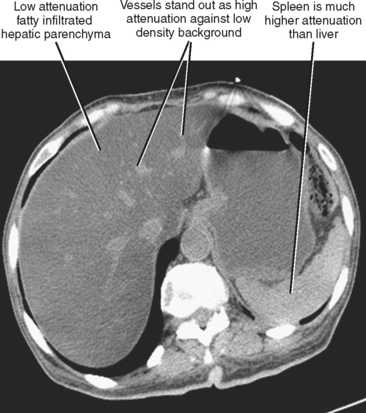
CT is more specific for the diagnosis of steatosis, which is suggested when the hepatic parenchyma is at least 10 HU lower in attenuation than the spleen on an unenhanced scan or 25 HU lower on a portal-phase contrast-enhanced CT scan. A liver attenuation of less than 40 HU on an unenhanced CT scan is also suggestive of steatosis. Steatosis can be subjectively diagnosed when hepatic vessels stand out as hyperdense against the low-attenuation background of fatty liver parenchyma (Fig. 12-25). This degree of steatosis may create the appearance of an enhanced scan.
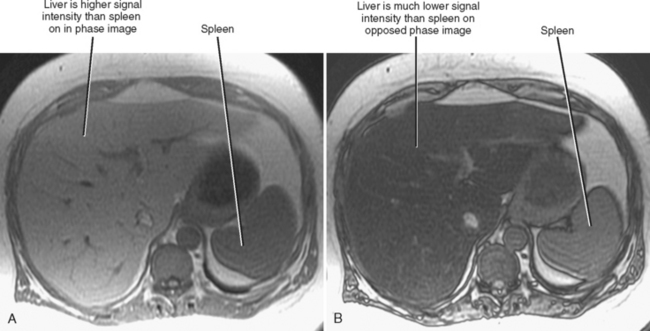
Chemical-shift MRI is highly specific for the diagnosis of hepatic steatosis. Areas of fatty infiltration will lose signal intensity on opposed-phase gradient-echo images relative to in-phase images (Fig. 12-26). Chemical-shift imaging is much more sensitive to the presence of steatosis than fat saturation or short tau inversion recovery MRI, because the latter techniques do not suppress the signal from water protons. MR spectroscopy has been used to further quantify the degree of fatty infiltration of the liver.
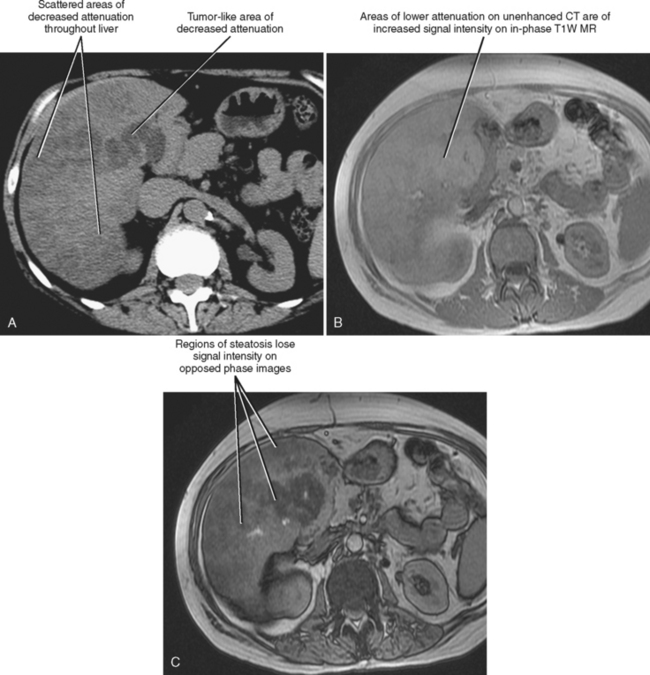
Steatosis may manifest in a variety of patterns and distributions (Box 12-2) (Fig. 12-27). Regardless of the pattern or imaging modality used to image the patient with hepatic steatosis, areas of uncomplicated fatty infiltration should not cause mass effect or displace vessels. One additional feature of hepatic steatosis is its capacity to change or fluctuate significantly over a relatively short period (<1 month) given changes in patient behavior or exposure. Resolution can occur in response to correction of the underlying metabolic abnormality or removal of the responsible hepatic toxin, whereas progression can result from continued exposure.
Diffusely infiltrating lymphoma can mimic hepatic steatosis but can be distinguished with chemical-shift MRI. Acute hepatitis from causes other than steatosis may cause a relatively low-attenuation liver on CT, but such a liver may be decreased or normal in echogenicity with sonography and often will be associated with periportal edema and gallbladder wall thickening. Table 12-5 summarizes imaging findings that suggest hepatic steatosis.
Table 12-5 Imaging Findings of Hepatic Steatosis
| US | |
| CT | |
| MRI | |
| All modalities |
CT, Computed tomography; MRI, magnetic resonance imaging; US, ultrasound.
* Iron deposition may also cause signal loss on opposed-phase images if the out-of-phase echo time is longer than the in-phase echo time (common with 3.0-Tesla magnetic resonance scanners).
Iron Deposition
Iron may be deposited in the liver in two general ways. Deposition of iron directly into the hepatocytes occurs with primary or hereditary hemochromatosis, an autosomal recessive disorder resulting in abnormally increased intestinal absorption of iron. Hereditary hemochromatosis affects the liver, pancreas, heart, joints, endocrine glands, and skin. The spleen is typically unaffected by hereditary hemochromatosis. The presence of excess iron causes organ damage, resulting in cirrhosis, diabetes, heart failure, and arthralgias. These patients are also at increased risk for HCC (Fig. 12-28).
Iron deposition within the liver is not easily detected with ultrasonography, although the secondary effects (cirrhosis, HCC) may be evident. Unenhanced CT of patients with increased hepatic iron may demonstrate a dense liver (>70 HU) (Fig. 12-29). However, increased liver attenuation on unenhanced CT is not specific for the presence of iron, because patients receiving amiodarone therapy, patients exposed to a prior intravenous iodine dose, and some patients with glycogen storage disease may also have increased attenuation of their liver on CT (see Fig. 12-16).
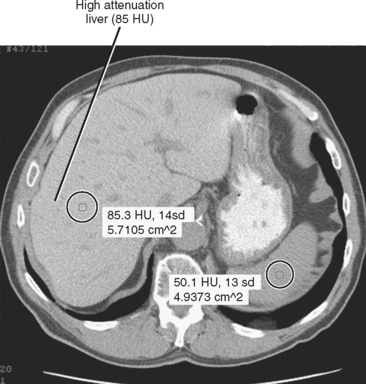
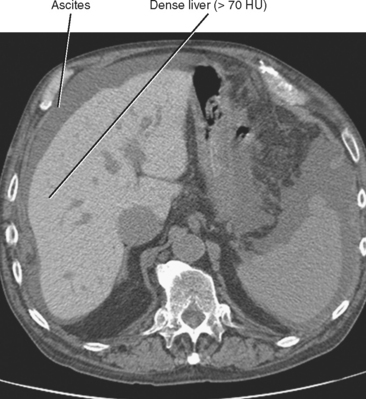
Figure 12-16 Unenhanced axial computed tomographic image through the abdomen of patient taking the drug amiodarone.
MRI is more specific for iron deposition, demonstrating signal loss on all pulse sequences because of the ferromagnetic properties of iron (Figs. 12-30 and 12-31). T2*-weighted images (gradient-echo images obtained with a relatively long TE) are highly sensitive to the presence of iron and may be used to quantify the amount of iron present. We frequently consult the in-phase and opposed-phase gradient-echo images routinely obtained as part of our liver protocol to confirm the presence of iron, because the liver will appear to lose signal on the longer TE images in such cases.
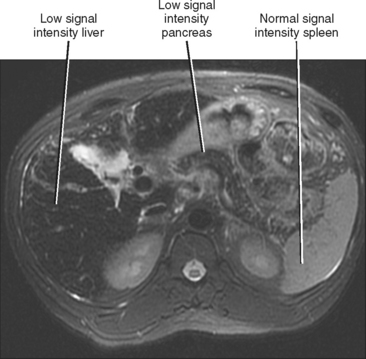
Figure 12-30 Axial T2-weighted magnetic resonance imaging through the upper abdomen of a patient with primary hemochromatosis.
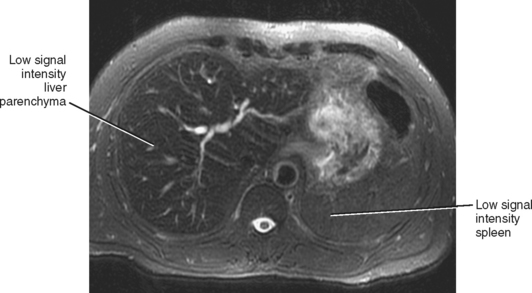
Figure 12-31 Axial T2-weighted magnetic resonance image of a patient with hemosiderosis associated with end-stage renal disease.
MRI can also demonstrate excess iron within the pancreas and heart in patients with hereditary hemochromatosis (see Fig. 12-30). As with the liver, these organs will demonstrate a decrease in signal intensity on most imaging sequences, most noticeable on T2*-weighted images. Once the diagnosis of hereditary hemochromatosis has been established, it is important to assess the liver for evidence of organ damage (cirrhosis) and the presence of HCC (see Fig. 12-28). Nodules or masses within the liver that demonstrate increased signal intensity on T2-weighted images or nodular enhancement after administration of intravenous gadolinium chelate should be viewed with suspicion. Table 12-6 summarizes the imaging findings of hepatic iron deposition disorders.
Table 12-6 Imaging Findings of Hepatic Iron Deposition
| US | |
| CT | |
| MRI |
CT, Computed tomography; MRI, magnetic resonance imaging; US, ultrasound.
Uncommon Deposition Disorders
Although glycogen deposited within the liver as a result of glycogen storage disease may appear hyperattenuating on CT images, a low-density liver resulting from associated hepatic steatosis is more common. As with other storage diseases, hepatomegaly may be present. Patients with glycogen storage disease type I (von Gierke) or type III are at risk for development of hepatic adenomas.
Making Sense of Cirrhosis
Causes of Cirrhosis
Cirrhosis is a nonspecific diagnosis that is the end result of a variety of hepatic insults leading to hepatocellular injury. Most cases of cirrhosis apparent on imaging studies are due to alcohol abuse or viral hepatitis. Table 12-7 lists various categories of causes of cirrhosis.
Table 12-7 Causes of Cirrhosis
| General Category | Common Examples |
|---|---|
| Infection | Viral hepatitis |
| Drugs and toxins | Alcohol, methotrexate |
| Biliary abnormalities | Primary sclerosing cholangitis, primary biliary cirrhosis |
| Metabolic disorders | Hereditary hemochromatosis |
| Cardiovascular disorders | Congestive heart failure, Budd–Chiari syndrome |
| Steatohepatitis | Nonalcoholic steatohepatitis |
| Granulomatous disorders | Sarcoidosis |
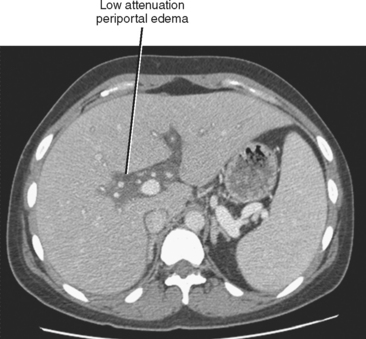
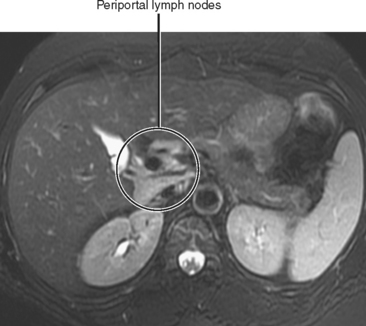
Cirrhosis is usually preceded by hepatitis. This inflammatory process of the liver may be caused by toxic, metabolic, immune, infectious, or other types of insult. In the acute phase, hepatitis may be characterized clinically by some combination of fever, right upper quadrant pain, malaise, jaundice, elevated liver function tests, and hepatomegaly. Acute hepatitis uncommonly manifests sonographically as hepatomegaly with decreased echogenicity of the hepatic parenchyma and relatively increased echogenicity of the portal vein walls (sometimes referred to as the “starry-sky” appearance), although some studies show this is a nonspecific finding. Periportal edema manifests as periportal sonolucency. Thickening (edema) of the gallbladder wall may be noted. With CT, the periportal edema appears as fluid attenuation tracking along the portal vessels in the place of periportal fat (Fig. 12-32). Alcoholic and nonalcoholic steatohepatitis may be associated with low-attenuation hepatic parenchyma caused by fatty infiltration. Chronic active (viral) hepatitis is frequently associated with lymphadenopathy in the hepatoduodenal ligament (Fig. 12-33). With MRI, the periportal edema present in acute hepatitis manifests as high periportal signal intensity on T2-weighted images. The liver may also demonstrate mildly increased signal intensity on T2-weighted and decreased signal intensity on T1-weighted images, although these changes are likely to be subtle. Associated steatosis will be most evident with in- and opposed-phase MRI.
Gross Morphologic Findings and Patterns of Cirrhosis
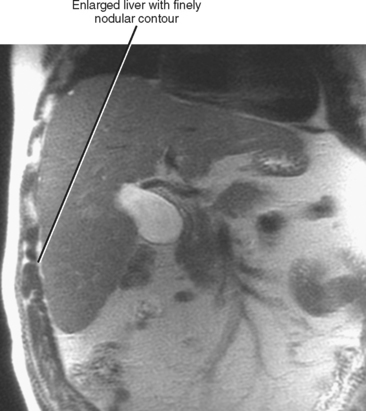
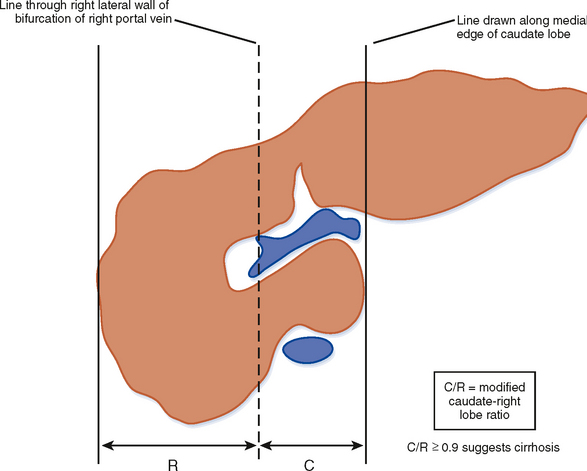
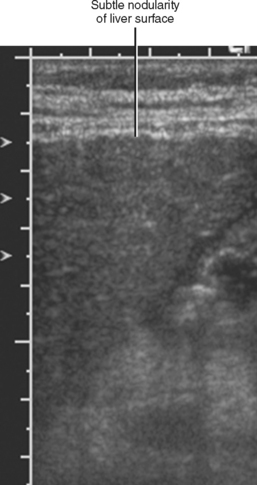
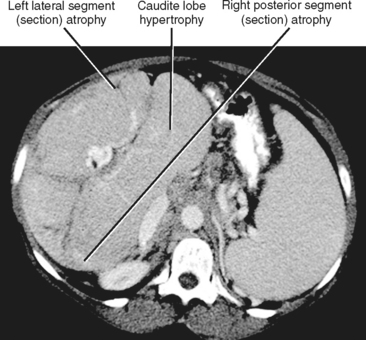
Figure 12-34 illustrates some typical morphologic changes of cirrhosis that may be present on imaging studies. Not all findings will be present in all cases of cirrhosis, and early in its course, morphologic changes of cirrhosis may be undetectable with imaging. It is also important to emphasize that not all cirrhotic livers will be reduced in volume. Some cirrhotic livers will appear normal in size or enlarged (Fig. 12-35). A quantitative approach to diagnosing cirrhosis has been advocated by some. In our experience, however, calculation of such ratios as the caudate-right lobe ratio is rarely necessary to suggest the diagnosis of cirrhosis because other morphologic findings are usually sufficient. For readers who prefer objective criteria, we include an illustration of the modified caudate-right lobe ratio (Fig. 12-36). A modified caudate-right lobe ratio of at least 0.9 has been shown to have an accuracy rate of almost 75% for the diagnosis of cirrhosis when applied to MR images and should be expected to work equally well for CT. Examination of the left lateral segment (lateral section) of the liver with a high-frequency linear US transducer may identify subtle nodularity of the liver or rounding of the contour of the left lateral segment that may aid in suggesting a diagnosis of cirrhosis (Fig. 12-37).
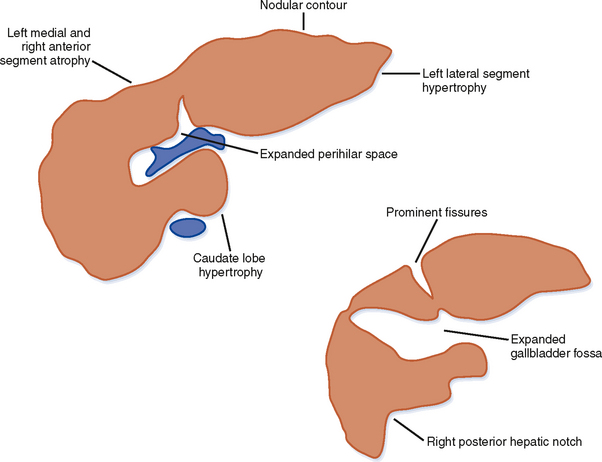
A cirrhotic liver consists of regenerative nodules with intervening fibrosis, regardless of cause. As a result, significant overlap of imaging findings exists between the various causes of cirrhosis. Despite this overlap, certain imaging appearances are more commonly associated with a particular causative factor. For example, enlargement of the caudate lobe and a right posterior hepatic notch are more common with alcoholic cirrhosis than with viral-induced cirrhosis, although this combination of findings is not specific. Unfortunately, a specific imaging diagnosis is not possible in the majority of cases of cirrhosis, and multiple contributing causes may be present in any given patient (e.g., alcohol and viral hepatitis). Therefore, imaging findings should always be correlated with clinical data before rendering a specific diagnosis. Table 12-8 lists imaging findings that can suggest the cause of cirrhosis.
Table 12-8 Imaging Findings Suggestive of (But Not Specific for) Cause of Cirrhosis
| Causative Factors | Imaging Findings |
|---|---|
| Primary sclerosing cholangitis (Fig. 12-38) | |
| Primary biliary cirrhosis (Fig. 12-39) | |
| Hereditary hemochromatosis (see Figs. 12-28 and 12-30) | |
| Schistosomiasis | |
| Congenital hepatic fibrosis (considered distinct from cirrhosis) |
* Low signal intensity surrounding the intrahepatic portal vein branches, most conspicuous on portal- and equilibrium-phase gadolinium-enhanced images.
† Liver iron deposition is not uncommon in cirrhosis of other causes; however, the pancreas is uninvolved in such cases.
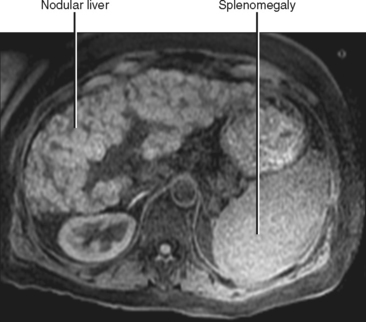
Extrahepatic Findings in Cirrhosis
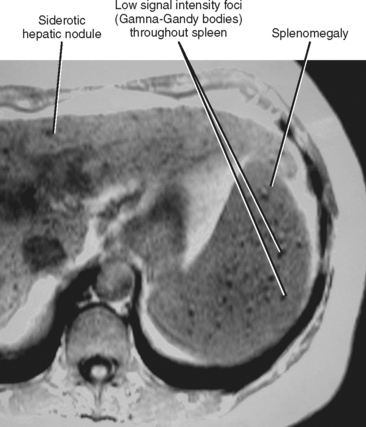
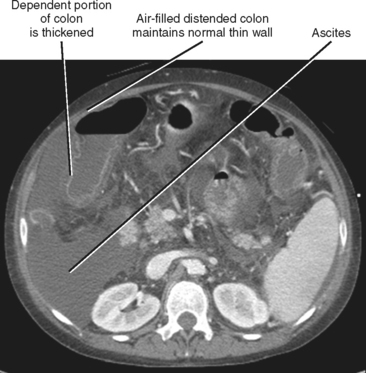
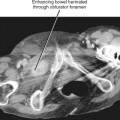
When imaging findings suggest the diagnosis of cirrhosis, one should be sure to look for the host of extrahepatic findings that may be present. Stigmata of portal hypertension include splenomegaly, ascites, and varices (Fig. 12-40). Table 12-9 outlines some of the more common venous collateral pathways encountered in patients with portal hypertension. Enlarged lymph nodes are commonly seen in the hepatoduodenal ligament and elsewhere in the setting of cirrhosis. Siderotic deposits within the spleen (Gamna–Gandy bodies) may be noted on MRI (Fig. 12-41). These lesions are most conspicuous on long TE gradient-echo images and appear as small, very-low-signal intensity foci scattered throughout the spleen. Patients with advanced cirrhosis may manifest bowel wall thickening. Edematous thickening of the ascending colon is particularly characteristic, although other segments of large or small bowel may be involved. Colon thickening related to cirrhosis and portal hypertension should not be confused with inflammatory or neoplastic processes. Thickening related to cirrhosis can be seen along the dependent wall of the colon or involving the haustrations. Air-distended nondependent portions of the colon often maintain a thin wall in the setting of portal hypertension (Fig. 12-42).
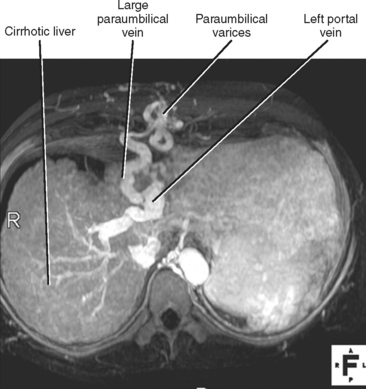
Table 12-9 Common Collaterals of Portal Hypertension
| Varices | Typical Supply* | Comments |
|---|---|---|
| Esophageal and paraesophageal | Left gastric (coronary) vein | Predominately (but not exclusively) drain* to azygous/hemiazygous system |
| Gastric | Left gastric vein and short gastric veins | Isolated gastric varices and enlarged gastroepiploic veins suggest splenic vein occlusion |
| Left renal vein shunts | Gastric (gastrorenal shunt) and splenic (splenorenal shunt) veins | |
| Paraumbilical | Left portal vein | Drain cephalad to the internal thoracic veins or caudally to the superior epigastric veins (and eventually inferior epigastric and external iliac veins) |
| Extraperitoneal | Mesenteric veins | Drain to gonadal, paravertebral, and other extraperitoneal veins |
* In this table, supply and drainage refer to the abnormal (portal to systemic) pattern induced by portal hypertension.
Imaging Mimics of Cirrhosis
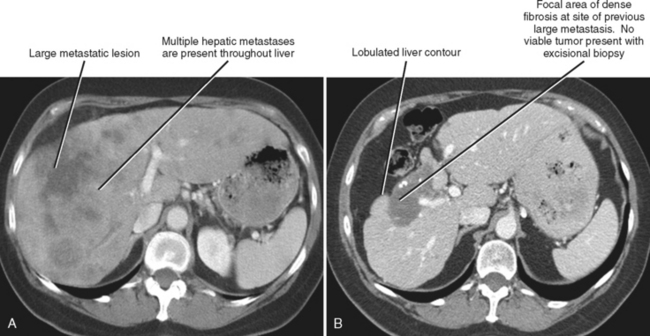
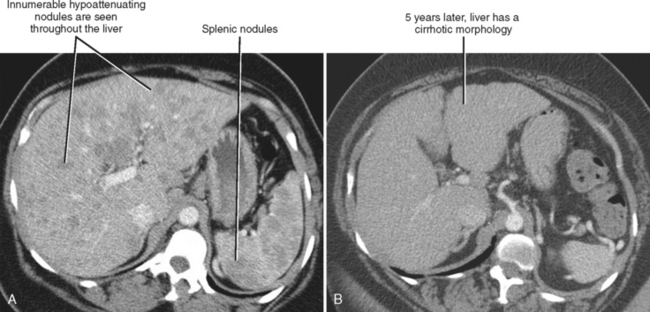
One should be aware of entities that may simulate some of the morphologic features of cirrhosis. Patients with liver metastases who have been treated with chemotherapy may occasionally develop morphologic changes in the liver that simulate cirrhosis (Fig. 12-43). This has most frequently been described with breast carcinoma, although other tumors may behave similarly. Some chemotherapy agents can also directly cause hepatotoxicity. Diffuse metastatic disease replacing normal hepatic parenchyma can simulate cirrhosis by creating a nodular architecture that may be associated with stigmata of portal hypertension. The liver contour may appear irregular in patients with pseudomyxoma peritonei, and mucin may simulate simple ascites in such patients, potentially creating confusion with cirrhosis (Fig. 12-44). An appearance of cirrhotic liver morphology may also be created after partial hepatectomy or in the setting of congenital segmental atrophy, although there should be no nodularity or fibrosis of such a liver in the absence of true cirrhosis. Areas of scarring and liver regeneration after fulminant hepatitis and nodular regenerative hyperplasia (regenerative nodules that occur in the absence of fibrosis) may likewise simulate cirrhosis. Granulomatous diseases such as sarcoidosis can mimic cirrhosis early in their course (because of innumerable nodules throughout the liver) or progress to cirrhosis over time (Fig. 12-45).

Parenchymal Findings Associated with Cirrhosis
The cirrhotic hepatic architecture is typically heterogeneous and hyperechoic with grayscale US. Unenhanced CT and MRI may show heterogeneity because of areas of fibrosis, fatty infiltration, or iron deposition (Fig. 12-46). Contrast-enhanced CT and MRI often reveal heterogeneous enhancement because of hemodynamic alterations, as well as differential enhancement of cirrhotic nodules and fibrosis.
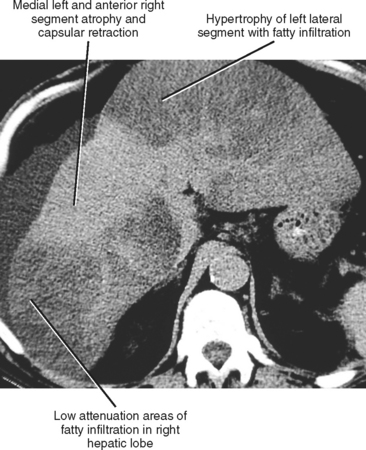
Figure 12-46 Axial unenhanced computed tomographic image through the liver in a patient with cirrhosis and hepatic steatosis.
Regenerative nodules are present in all cirrhotic livers but are not always obvious with imaging. MRI is better than US or CT for demonstrating regenerative nodules throughout the liver (Fig. 12-47
Stay updated, free articles. Join our Telegram channel

Full access? Get Clinical Tree


