Liver, Biliary Tree, and Gallbladder
William E. Brant
Liver
Imaging Methods. CT, MR, and US all produce high-quality images of the liver parenchyma. Dynamic bolus contrast-enhanced MDCT is the current method of choice for most hepatic imaging. Fast imaging techniques that control motion have increased the role of MR as a problem-solver and often as the primary hepatic imaging modality. US is used as a screening method for patients with abdominal symptoms and suspected diffuse or focal liver disease. Color flow and spectral Doppler are used to assess hepatic vessels and tumor vascularity. Radionuclide imaging is used in the characterization of cavernous hemangiomas and focal nodular hyperplasia.
MDCT of the liver is performed using a three-phase or four-phase protocol of multiple scans of the entire liver (1). Initial noncontrast images are followed by rapid bolus IV contrast injection by a mechanical injector. Immediate images are optimally obtained during peak hepatic arterial enhancement phase to detect hypervascular tumors and other lesions supplied primarily by the hepatic artery. Arterial phase-enhancing lesions, such as hepatocellular carcinoma (HCC), are high attenuation on a background of lower attenuation, minimally enhanced, parenchyma. Maximum enhancement of the liver is attained during portal venous phase to demonstrate hypovascular lesions as low-attenuating masses on a background of brightly enhanced parenchyma. Because about two-thirds of the hepatic blood supply comes from the portal vein, maximum enhancement of the liver parenchyma occurs at 60 to 120 seconds following hepatic arterial enhancement. Further delayed images are obtained several minutes after contrast injection to document late-contrast fill-in of hemangioma and delayed enhancement of cholangiocarcinoma.
Hepatic MR imaging is performed with a broad array of fast spin-echo, breath-hold gradient recall, short-time inversion-recovery, fat-suppressed, and in-phase/out-of-phase pulse sequences (1). The goal is to maximize lesion detection by using the striking contrast resolution of MR while minimizing motion artifact by rapid scan breath-hold sequences. Dynamic contrast enhancement is achieved with MR by repeating full liver scans multiple times in the first minutes following gadolinium injection. Two major classes of gadolinium-based contrast agents are in use. Extracellular agents, such as gadopentetate dimeglumine (Magnevist®), are akin to iodine-based contrast agents used in CT. Liver-specific contrast agents such as gadoxetate disodium (Eovist®) have conventional properties of the extracellular agents as well as being taken up by hepatocytes, which improves the detection and characterization of small lesions (2,3). Diffusion-weighted MR has emerged as a method of hepatic lesion detection and characterization in patients who cannot receive IV contrast (4). MR spectroscopy is used for quantitation of liver fatty infiltration and other diffuse hepatic diseases (5).
US is used as a rapid screening modality to detect diseases of the liver, biliary tree, and gallbladder. Hepatic US imaging is reviewed in Chapter 35.
Radionuclide imaging of the liver is inferior to CT, MR, or US for lesion detection but offers functional information in characterizing lesions such as focal nodular hyperplasia. Radionuclide blood pool imaging is very useful for definitive diagnosis of cavernous hemangioma. Hepatic radionuclide imaging is reviewed in Chapter 58.
Fine-needle aspiration for cytology and core needle biopsy for histology, guided by US or CT, are popular and safe methods to obtain tissue diagnoses.
Anatomy
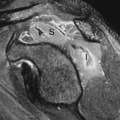
Couinaud Segments. The vascular anatomy that defines the surgical approach to lesion resection is the anatomy most relevant to liver imaging. A numbering system developed by Couinaud (pronounced “kwee-NO”) is commonly used internationally and provides standardized identification of hepatic segments (Fig. 26.1) (Table 26.1). The eight Couinaud segments have separate vascular inflow, outflow, and biliary drainage and can each be resected without damaging the remaining segments. Division of the liver into eight segments is based on a concept of three longitudinal planes and two transverse planes. A longitudinal plane through the middle hepatic vein, inferior vena
cava (IVC), and gallbladder fossa divides the liver into right and left lobes. A longitudinal plane through the right hepatic vein divides the right lobe into anterior (VIII and V) and posterior (VII and VI) segments. A longitudinal plane through the left hepatic vein divides the left lobe into medial (IVa and IVb) and lateral (II and III) segments. A transverse plane through the left portal vein divides the left lobe into superior (IVa and II) and inferior (IVb and III) segments. An oblique transverse plane through the right portal vein divides the right lobe into superior (VIII and VII) and inferior (V and VI) segments. Segment I is the caudate lobe that extends between the fissure of the ligamentum venosum and the IVC. Hepatic venous drainage from the caudate lobe is directly into the IVC via small veins.
cava (IVC), and gallbladder fossa divides the liver into right and left lobes. A longitudinal plane through the right hepatic vein divides the right lobe into anterior (VIII and V) and posterior (VII and VI) segments. A longitudinal plane through the left hepatic vein divides the left lobe into medial (IVa and IVb) and lateral (II and III) segments. A transverse plane through the left portal vein divides the left lobe into superior (IVa and II) and inferior (IVb and III) segments. An oblique transverse plane through the right portal vein divides the right lobe into superior (VIII and VII) and inferior (V and VI) segments. Segment I is the caudate lobe that extends between the fissure of the ligamentum venosum and the IVC. Hepatic venous drainage from the caudate lobe is directly into the IVC via small veins.
 Figure 26.1. Couinaud Liver Segments. A. Superior portion of the liver. B. Inferior portion of the liver. CT scans illustrate the Couinaud classification of the numbering of liver segments. The longitudinal plane of the right hepatic vein divides VIII from VII in the superior portion of the liver and V from VI in the inferior portion of the liver. The longitudinal plane of the middle hepatic vein through the gallbladder fossa separates IVa from VIII in the superior liver and IVb from V in the inferior liver. The longitudinal plane of the left hepatic vein and fissure of the ligamentum teres separates IVa from II in the superior liver and IVb from III in the inferior liver. The axial plane of the left portal vein separates IVa superiorly from IVb inferiorly and II superiorly from III inferiorly in the left lobe. The axial plane of the right portal vein separates VIII and VII superiorly from V and VI inferiorly in the right lobe. The caudate lobe (segment I) extends between the fissure of the ligamentum venosum anteriorly and the inferior vena cava posteriorly. |
Blood supply to the liver is approximately two-thirds via the portal vein and one-third via the hepatic artery. When IV contrast is administered as a bolus during rapid CT scanning, the maximum liver parenchymal enhancement will be delayed by 1 to 2 minutes following initiation of injection. This delay reflects the transit time of contrast agent through the GI tract and spleen before accessing the liver through the portal vein. Tumors, which are supplied primarily by the hepatic artery, will enhance maximally during the early hepatic arterial phase, whereas the liver parenchyma enhances maximally during the portal venous phase.
Table 26.1 American and International Nomenclature for Anatomic Segments of the Liver | |||||||||||||||||||||
|---|---|---|---|---|---|---|---|---|---|---|---|---|---|---|---|---|---|---|---|---|---|
| |||||||||||||||||||||
Perfusion abnormalities are seen on post-IV contrast CT and MR because of variations in the hepatic arterial and portal venous blood supply to various areas of the liver (6). This dual blood supply has a compensatory relationship: arterial flow increases when portal venous flow decreases and increased portal venous flow compensates for decreased hepatic arterial flow.
Transient enhancement differences are seen during either arterial phase imaging or portal venous phase imaging on MDCT and dynamic MR. These abnormalities have been termed “THADs” (transient hepatic attenuation differences) or “THIDs” (transient hepatic intensity differences) (7,8,9). Portal venous flow may be altered by (1) portal blockade by tumor or thrombus; (2) extrinsic compression caused by ribs or diaphragmatic slips, or tumors on the liver capsule; or (3) “third inflow” from systemic veins in the pericholecystic, parabiliary, and epigastric–paraumbilical venous systems (Fig. 26.2). Systemic venous blood drains into hepatic sinusoids altering normal intrahepatic blood flow. This results in focal areas of increased or decreased enhancement during the various phases of parenchymal enhancement. Hepatic arterial flow may also be increased by (1) focal hypervascular lesions, (2) inflammation of adjacent organs (cholecystitis and pancreatitis), or (3) aberrant hepatic arterial supply. Regional differences in blood supply related to these factors explain the patterns of enhancement abnormalities as well as altered patterns of diffuse liver disease such as focal fatty deposition and focal fatty sparing in diffuse fatty infiltration.
Transient enhancement differences are seen during either arterial phase imaging or portal venous phase imaging on MDCT and dynamic MR. These abnormalities have been termed “THADs” (transient hepatic attenuation differences) or “THIDs” (transient hepatic intensity differences) (7,8,9). Portal venous flow may be altered by (1) portal blockade by tumor or thrombus; (2) extrinsic compression caused by ribs or diaphragmatic slips, or tumors on the liver capsule; or (3) “third inflow” from systemic veins in the pericholecystic, parabiliary, and epigastric–paraumbilical venous systems (Fig. 26.2). Systemic venous blood drains into hepatic sinusoids altering normal intrahepatic blood flow. This results in focal areas of increased or decreased enhancement during the various phases of parenchymal enhancement. Hepatic arterial flow may also be increased by (1) focal hypervascular lesions, (2) inflammation of adjacent organs (cholecystitis and pancreatitis), or (3) aberrant hepatic arterial supply. Regional differences in blood supply related to these factors explain the patterns of enhancement abnormalities as well as altered patterns of diffuse liver disease such as focal fatty deposition and focal fatty sparing in diffuse fatty infiltration.
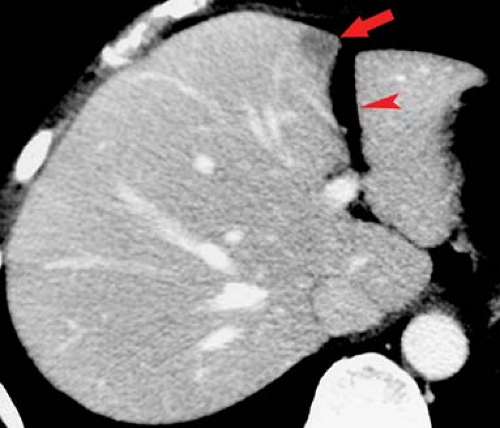 Figure 26.2. Perfusion Defect. A common perfusion defect (arrow) is seen in segment IVb adjacent to the fissure of the ligamentum teres (arrowhead). This perfusion defect is related to “third inflow” from paraumbilical systemic veins. Focal fatty infiltration is commonly seen in this location. Importantly, this normal variant must not be mistaken for a neoplasm. |
On CT, the attenuation of normal liver parenchyma is equal to or greater than the attenuation of normal spleen parenchyma on unenhanced images. Following bolus IV contrast administration, the normal parenchymal enhancement is less than that of the spleen during arterial phase and equal to or greater than that of the spleen during portal venous phase.
On MR T1WI, the normal liver is of slightly higher signal intensity than the spleen, and most focal lesions appear as lower-intensity defects. With T2WI, the normal liver is less than or equal to the spleen in signal strength, and most lesions appear as high-intensity foci.
Diffuse Liver Disease
Hepatomegaly. Enlargement of the liver is usually judged subjectively on imaging studies. Rounding of the inferior border of the liver and extension of the right lobe of the liver inferior to the lower pole of the right kidney are evidence of hepatomegaly. A liver length greater than 15.5 cm, measured in the midclavicular line, is considered enlarged. Reidel lobe is a normal variant of hepatic shape found most often in women. It refers to an elongated inferior tip of the right lobe of the liver. When a Reidel lobe is present, the left lobe of the liver is correspondingly smaller in size. The left lobe of the liver may, as a normal variant, be elongated and surround a portion of the spleen. Causes of hepatomegaly are listed in Table 26.2.
Table 26.2 Causes of Hepatomegaly | |||||||||||||||||||||||||||||
|---|---|---|---|---|---|---|---|---|---|---|---|---|---|---|---|---|---|---|---|---|---|---|---|---|---|---|---|---|---|
|
Fatty liver (hepatic steatosis) is the most common abnormality demonstrated by hepatic imaging (10,11). It is prevalent in 15% of the general population, in 50% of patients with hyperlipidemia or high alcohol consumption, and in up to 75% of patients with severe obesity. Causes are many, but two of the most common are alcoholic liver disease and nonalcoholic fatty liver disease related to the “metabolic syndrome” of insulin resistance, obesity, diabetes, hyperlipidemia, and hypertension. Other causes include viral hepatitis, drugs (especially steroids and chemotherapy agents), nutritional abnormalities, radiation injury, cystic fibrosis, and storage disorders. All conditions injure hepatocytes by altering hepatocellular lipid metabolism, with defects in free fatty acid metabolism resulting in accumulation of triglycerides within hepatocytes. Fatty liver is initially reversible but may progress to steatohepatitis (cell injury, inflammation, and fibrosis) with further progression to cirrhosis.
Nonalcoholic fatty liver disease includes a continuum of liver disease that extends from simple fatty liver through nonalcoholic steatohepatitis (NASH) to cirrhosis (12,13). NASH is diagnosed solely by liver biopsy showing inflammation and fibrosis in addition to hepatic steatosis. Patients at risk for this increasingly common condition include those with Type II diabetes and the “metabolic syndrome” described previously.
On US, the normal liver parenchyma is equal to, or slightly more echogenic, than the renal cortex and spleen parenchyma.
Intrahepatic blood vessels and small portal triads in the liver periphery are well defined. Reliable US findings of fatty liver include liver echogenicity distinctly greater than that of the renal cortex, loss of visualization of normal echogenic portal triads in the periphery of the liver, and poor sound penetration with loss of definition of the diaphragm (see Fig. 35.5B). All three findings must be present to make an unequivocal US diagnosis (14).
Intrahepatic blood vessels and small portal triads in the liver periphery are well defined. Reliable US findings of fatty liver include liver echogenicity distinctly greater than that of the renal cortex, loss of visualization of normal echogenic portal triads in the periphery of the liver, and poor sound penetration with loss of definition of the diaphragm (see Fig. 35.5B). All three findings must be present to make an unequivocal US diagnosis (14).
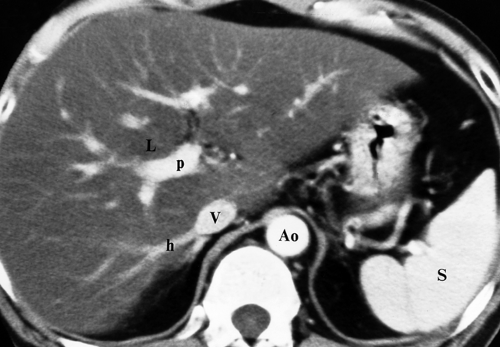 Figure 26.3. Diffuse Fatty Liver—CT. CT reveals the density of the enhanced liver parenchyma (L) to be significantly less than the density of the enhanced splenic parenchyma (S). Portal (p) and hepatic (h) veins run their normal courses without displacement or distortion. V, inferior vena cava; Ao, aorta. |
On CT, fat infiltration lowers the attention of the hepatic parenchyma and makes the liver appear less dense than the spleen (Fig. 26.3). The liver normally has a slightly higher attenuation than the spleen or blood vessels. Differences in density between liver and spleen are most reliably judged on noncontrast images. On postcontrast images, the normal spleen enhances maximally 1 to 2 minutes before maximal liver enhancement and is thus transiently brighter than the normal liver. Fatty livers enhance less than normal livers. On unenhanced CT, fatty liver is diagnosed when the liver attenuation is 10 H less than the spleen attenuation, or when the liver attenuation is less than 40 H (10). When fatty liver is severe, blood vessels may appear brighter than the dark liver on unenhanced CT. Comparison of CT and US findings may yield the diagnostic “flip-flop” sign, with fatty liver being dark on CT and bright on US.
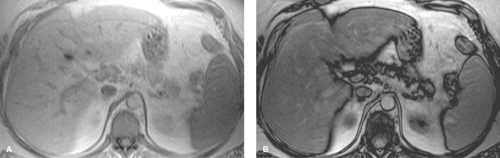 Figure 26.4. Diffuse Fatty Liver—MR. A. In-phase gradient recall MR. B. Out-of-phase gradient recall MR. The out-of-phase image shows distinct loss of signal (darkening) of the entire liver parenchyma compared to the in-phase image. The out-of-phase MR image is easily recognized by the black line surrounding the soft tissue structures at the interface with abdominal fat. |
Conventional MR images show no significant abnormalities with fat infiltration. Gradient echo imaging with fat and water molecules in-phase and out-of-phase is the MR method most sensitive to the diagnosis of fatty liver (10). On in-phase images, the signal from water and fat molecules are additive. On out-of-phase images, the signals from water and fat cancel out each other. A loss of signal intensity between in-phase and out-of-phase images is indicative of fatty liver (Fig. 26.4). This is the same technique used to characterize benign adrenal adenomas (see Chapter 32). This opposed-phase chemical shift GRE technique is more sensitive to the detection of the microscopic intracellular fat characteristic of fatty liver than are fat-saturation MR techniques, which have greater sensitivity for macroscopic fat. Iron deposition in the liver will also cause a loss of signal on out-of-phase MR imaging and is a potential pitfall in MR diagnosis of fatty liver in patients with cirrhosis (15).
Characteristic features of fatty deposition on all modalities include lack of mass effect (no bulging of the liver contour or displacement of intrahepatic blood vessels) and angulated geometric boundaries between involved and uninvolved parenchyma. Areas of fat deposition may be multifocal with interdigitating fingers of normal and abnormal parenchyma. Fatty changes can develop within 3 weeks of hepatocyte insult and may resolve within 6 days of removing the insult. Patterns of fatty infiltration are strongly related to hepatic blood flow.
Diffuse fatty liver involving the entire liver is the most common pattern (Figs. 26.3, 26.4). Most cases show homogeneous fat deposition, although slight heterogeneity is common and adds to the confidence of diagnosis.
Focal fatty liver involves a geographic or fan-shaped portion of the liver with the same imaging features as diffuse fat deposition. Vessels run their normal course through the area of involvement. Focal fat may simulate a liver tumor; however, the area of involvement has a density characteristic of fat. Focal fat is most common adjacent to the falciform ligament, gallbladder fossa, and porta hepatis. These are the areas prone to altered hepatic blood flow with systemic inflow, and focal fat deposition may be related to higher concentrations of insulin in these areas.
Focal sparing in a diffusely fatty infiltrated liver may be the most confusing pattern because spared areas of normal parenchyma may convincingly simulate a liver tumor (Fig. 26.5).
Fat-spared areas are most commonly found in segment IV. The fat-spared area is hypoechoic relative to the rest of the liver on US and is of higher density than the rest of the liver on CT (“flip-flop” sign). The remainder of the liver demonstrates features characteristic of diffuse fatty infiltration.
Fat-spared areas are most commonly found in segment IV. The fat-spared area is hypoechoic relative to the rest of the liver on US and is of higher density than the rest of the liver on CT (“flip-flop” sign). The remainder of the liver demonstrates features characteristic of diffuse fatty infiltration.
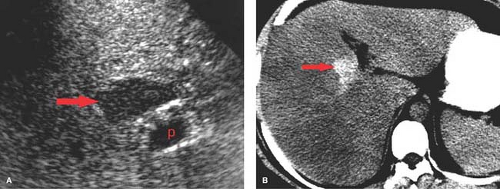 Figure 26.5. Fatty Infiltration With Focal Sparing. A. An US image demonstrates a focal hypoechoic area of normal liver (arrow) near the portal vein (p) in a liver that is heterogeneously but diffusely increased in echogenicity due to fatty deposition. B. A CT image obtained without contrast enhancement demonstrates the spared area of the normal liver (arrow) to be of high density compared to the lower density of the fatty liver. Note the characteristic “flip-flop” appearance of fat density between CT and US. |
Multifocal fatty liver is an uncommon pattern of fat deposition throughout the liver in multiple atypical locations (Fig. 26.6) (10). Fat foci may be round or oval and mimic metastatic disease or other liver nodules. Confluence of the fatty nodules to form larger masses is common. Chemical shift MR is the most reliable method to make the diagnosis and is particularly useful when CT and US are equivocal.
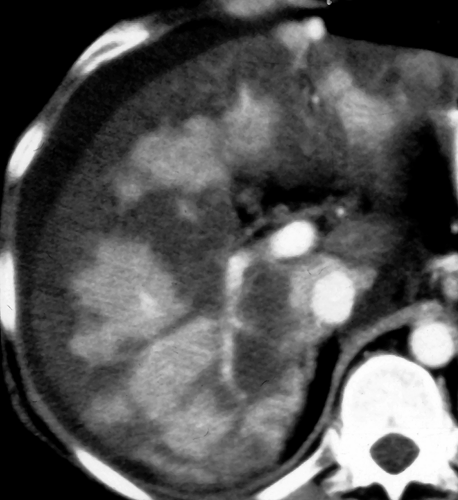 Figure 26.6. Multifocal Fatty Liver. Postcontrast CT demonstrates multiple geographic areas of decreased attenuation extending to liver capsule representing multifocal fat deposition. The patient also has ascites. |
Perivascular fatty liver is seen as halos of fat surrounding the portal veins, hepatic veins, or both (16). The cause of this unusual pattern is unknown, but it may be seen in patients at risk for fatty liver from a variety of causes.
Subcapsular fatty liver is seen only in patients with renal failure on peritoneal dialysis and only when insulin is added to the dialysate. High concentrations of insulin in the subcapsular liver leads to fat deposition (10).
Acute hepatitis most commonly causes no abnormalities on hepatic imaging. In some patients, diffuse edema lowers the parenchyma echogenicity and causes the portal venules to appear unusually bright on US (17). In acute fulminant hepatitis, areas of necrosis show as ill-defined areas of low density on CT.
Chronic hepatitis is characterized pathologically by portal and perilobular inflammation and fibrosis. Causes include chronic viral infection and hepatitis B and C. Imaging studies are insensitive to early pathologic changes. Fatty changes are minimal, and the liver is usually not enlarged. Perihepatic lymph nodes are commonly visualized. US may show a subtle coarse increase in hepatic echogenicity. The primary role of imaging patients with chronic hepatitis is to detect HCC. Core biopsy of the liver parenchyma, often guided by US, is used to stage the disease.
Cirrhosis is characterized pathologically by diffuse parenchymal destruction, fibrosis with alteration of hepatic architecture, and innumerable regenerative nodules that replace normal liver parenchyma. Causes of cirrhosis include hepatic toxins (alcohol, drugs, and aflatoxin from a grain fungus), infection (viral hepatitis, especially types B and C), biliary obstruction, and heredity (Wilson disease). In the United States, 75% of patients with cirrhosis are chronic alcoholics. In Asia and Africa, most cases of cirrhosis are due to chronic active hepatitis. A variety of morphologic alterations are seen on imaging studies. These include (Fig. 26.7) (1) hepatomegaly (early); (2) atrophy or hypertrophy of hepatic segments; (3) coarsening of hepatic parenchymal texture; (4) nodularity of the parenchyma, often most noticeable on the liver surface; (5) hypertrophy of the caudate lobe with shrinkage of the right lobe; (6) regenerating nodules (Fig. 27.8); and (7) enlargement of the hilar periportal space (>10 mm) reflecting parenchymal atrophy. Extrahepatic signs of cirrhosis include the presence of portosystemic collaterals as evidence of
portal hypertension, splenomegaly, and ascites. The pathological changes of cirrhosis are irreversible, but disease progression can be limited or stopped by eliminating the causative agent (stop drinking alcohol). Transjugular intrahepatic portosystemic shunt (TIPS) is an effective treatment for portal hypertension and long-term control of esophageal variceal bleeding. Liver transplantation is now established as an effective treatment for end-stage liver disease.
portal hypertension, splenomegaly, and ascites. The pathological changes of cirrhosis are irreversible, but disease progression can be limited or stopped by eliminating the causative agent (stop drinking alcohol). Transjugular intrahepatic portosystemic shunt (TIPS) is an effective treatment for portal hypertension and long-term control of esophageal variceal bleeding. Liver transplantation is now established as an effective treatment for end-stage liver disease.
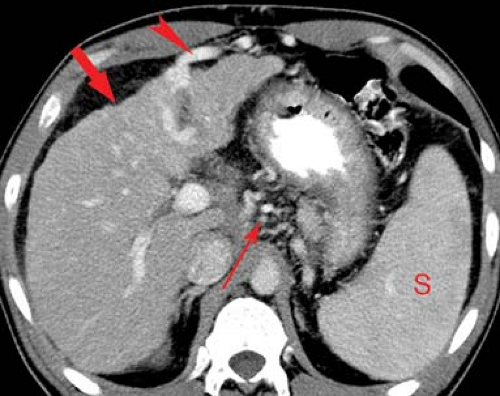 Figure 26.7. Cirrhosis and Portal Hypertension. A CT scan reveals atrophy of the liver with diffuse nodularity of its surface (fat arrow) and splenomegaly (S). Numerous enhancing portosystemic collateral vessels are evident including gastrohepatic (skinny arrow) and gastric varices. A dilated periumbilical vein (arrowhead) is seen coursing out of the fissure of the ligamentum teres into the falciform ligament. |
US demonstrates heterogeneous parenchyma with coarsening of the echotexture and decreased visualization of small portal triad structures. High-frequency detailed scanning of the liver surface reveals fine nodules. Echogenicity of the liver parenchyma is not significantly increased unless fatty deposition is also present.
CT may be normal in the early stages or may reveal parenchymal inhomogeneity with patchy areas of increased and decreased attenuation (18). Fine or coarse nodularity of the liver surface is characteristic.
MR shows heterogeneous parenchymal signal on T1WI and T2WI. High-signal fibrosis on T2WI is the predominant cause of the heterogeneous appearance.
Mimics of cirrhosis are conditions that cause diffuse hepatic nodularity or portal hypertension including pseudocirrhosis of treated breast cancer metastases, miliary metastases, sarcoidosis, schistosomiasis, Budd–Chiari syndrome, nodular regenerative hyperplasia, and idiopathic portal hypertension (19).
Nodules in Cirrhosis. Nodules are a constant feature of cirrhosis (Table 26.3), and the challenge is to differentiate the ubiquitous benign nodule from HCC (20,21). HCC may arise de novo or as a stepwise process from a regenerative nodule to low-grade dysplastic nodule to high-grade dysplastic nodule to small HCC to large HCC (21,22).
Regenerative nodules (Fig. 26.8) are the most common nodule and are a regular pathologic feature of cirrhosis due to attempted repair of hepatocyte injury. Regenerative nodules are composed primarily of hepatocytes that are surrounded by coarse fibrous septations. Small regenerative nodules (<3 mm) produce the micronodular pattern of cirrhosis. Larger regenerative nodules (>3 mm) produce the macronodular pattern of cirrhosis. Very large regenerative nodules (up to 5 cm) can mimic a mass (20). Regenerative nodules are supplied by the portal vein and thus show no enhancement on arterial phase postcontrast imaging. Regenerative nodules, because they consist of proliferating hepatocytes, are typically indistinct on US, CT, and MR imaging. MR typically shows heterogeneity without distinct nodules on T1WI and T2WI. Uncommonly, regenerative nodules are hyperintense to liver on T2WI, reflecting the accumulation of fat, protein, or copper. Regenerative nodules that accumulate iron (siderotic nodules) are low-signal intensity on T1WI and T2WI (22). Infarction of regenerative nodules results in a high signal on T2WI. Regenerative nodules show no enhancement on arterial phase postcontrast CT and MR imaging.
Table 26.3 Causes of Nodules in A Cirrhotic Liver | |||||||
|---|---|---|---|---|---|---|---|
|
Dysplastic nodules show foci of low-grade or high-grade dysplasia. Low-grade dysplastic nodules show minimal atypia, have no mitosis, and are not premalignant. Low-grade dysplastic nodules are supplied by the portal vein and show no arterial phase enhancement postcontrast. Low-grade dysplasia typically progresses to high-grade dysplasia. High-grade dysplastic nodules show moderate atypia, have occasional mitosis, may secrete alpha fetoprotein (AFP), but are not frankly malignant. They are, however, considered premalignant. High-grade dysplastic nodules receive increasing blood supply by the hepatic artery and show arterial phase enhancement, overlapping the appearance of small HCC. Most dysplastic nodules have similar imaging characteristics as regenerative nodules. They are indistinct and isointense to liver on US, CT, and T1- and T2-weighted MR. Dysplastic nodules are almost never hyperintense on T2WI, differentiating them from HCC (23).
Rare infarction of dysplastic nodules results in high signal on T2WI. Siderotic dysplastic nodules with iron accumulation are low signal on T1WI and T2WI.
Rare infarction of dysplastic nodules results in high signal on T2WI. Siderotic dysplastic nodules with iron accumulation are low signal on T1WI and T2WI.
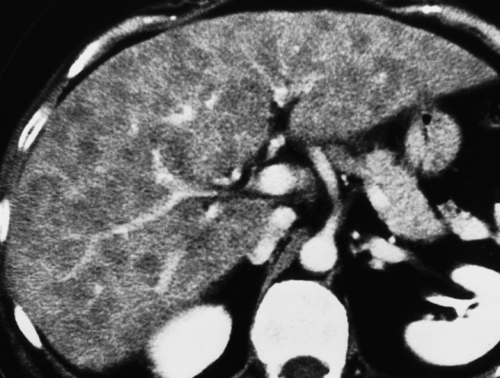 Figure 26.8. Regenerative Nodules in Cirrhosis. CT image filmed at a narrow window shows innumerable low-density small nodules evident throughout the liver in this patient with cirrhosis. Needle biopsy confirmed benign regenerative nodules. |
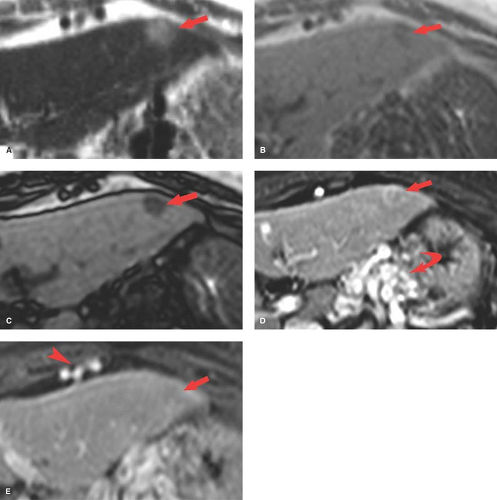 Figure 26.9. Small Hepatocellular Carcinoma. MR images show findings characteristic of a small HCC (arrows). A. Axial T2WI shows a hyperintense, poorly marginated, 1.8 cm nodule in the left hepatic lobe. Hyperintensity on T2WI is rare for dysplastic or regenerative nodules but is highly characteristic of HCC. B. T1-weighted in-phase image shows the low-signal ill-defined nodule. C. T1-weighted out-of-phase image shows distinct loss of signal indicating the presence of intracellular fat, a finding seen in HCC and hepatic adenomas. D. Postcontrast arterial phase image shows a ring-like peripheral enhancement of the lesion. Arterial phase enhancement is a key finding in the imaging diagnosis of HCC. Prominent early enhancement of a tangle of portosystemic collateral vessels (curved arrow) is also present in this patient with advanced cirrhosis and in hepatic arterioportal shunting. E. Portal venous phase postcontrast image shows early washout of contrast from the nodule, which has become slightly hypointense to the enhanced hepatic parenchyma. This is another key finding of HCC on postcontrast images. Also noted is the enhancement of paraumbilical collateral vessels (arrowhead), a specific sign of advanced portal hypertension. Using the American Association for the Study of Liver Diseases standard HCC was diagnosed on the basis of its imaging characteristics, and the nodule was successfully treated with transcatheter arterial chemoembolization. |
Siderotic nodule is a radiologic term used to describe nodules that are high in iron content and appear as low-signal nodules on both T1WI and T2WI. The nodules may be regenerative or dysplastic but are virtually never malignant (20). Dysplastic nodules may disappear on imaging follow-up (22).
Small HCC, defined as less than 2 cm diameter, overlap the appearance of high-grade dysplastic nodules. Detection leading to treatment of small HCC is a major goal of hepatic imaging in cirrhosis (Fig. 26.9). On T1-weighted MR, small HCCs
appear as hypointense nodule with internal foci isointense to liver parenchyma. Fat content within the nodules raises the risk of HCC. Fat content within hepatic nodules is best demonstrated by chemical shift MR in-phase and out-of-phase imaging. On T2WI, the nodules are of low intensity with foci of high-signal intensity. High-signal intensity on T2WI differentiates small HCC from dysplastic nodules. Small HCCs show the hallmark finding of intense enhancement on arterial phase dynamic MR. The American Association for the Study of Liver Diseases (AASLD) no longer requires biopsy to diagnose HCC. Small nodules that are hypervascular on arterial phase postcontrast CT or MR and show washout of contrast on portal venous phase are considered to be HCC. HCC developing within a dysplastic nodule may produce a characteristic “nodule within a nodule” appearance seen as a high-signal focus within a low-intensity nodule. The high-signal focus enhances avidly on arterial phase (21).
appear as hypointense nodule with internal foci isointense to liver parenchyma. Fat content within the nodules raises the risk of HCC. Fat content within hepatic nodules is best demonstrated by chemical shift MR in-phase and out-of-phase imaging. On T2WI, the nodules are of low intensity with foci of high-signal intensity. High-signal intensity on T2WI differentiates small HCC from dysplastic nodules. Small HCCs show the hallmark finding of intense enhancement on arterial phase dynamic MR. The American Association for the Study of Liver Diseases (AASLD) no longer requires biopsy to diagnose HCC. Small nodules that are hypervascular on arterial phase postcontrast CT or MR and show washout of contrast on portal venous phase are considered to be HCC. HCC developing within a dysplastic nodule may produce a characteristic “nodule within a nodule” appearance seen as a high-signal focus within a low-intensity nodule. The high-signal focus enhances avidly on arterial phase (21).
On US, small HCCs appear as a well-circumscribed hypoechoic mass in the cirrhotic liver (24). This appearance is not specific but should lead to CT or MR for characterization. US is commonly used as an inexpensive and a widely available method to survey the liver of patients with cirrhosis and chronic viral hepatitis for evidence of HCC. Subtle masses deserve further imaging.
Mimics of HCC include the vaguely termed “nonspecific arterially enhancing lesions,” pseudolesions, and THADs (22). These lesions are features of cirrhosis related to arterioportal shunts and fibrotic obstruction of the portal vein. The involved area is usually isointense to cirrhotic parenchyma on T1WI and T2WI. HCC commonly becomes hypointense to the surrounding liver on delayed imaging, whereas these nonspecific lesions are usually isointense on delayed imaging.
Confluent fibrosis describes mass-like areas of fibrosis found in livers with advanced cirrhosis (25). Extensive fibrosis produces a wedge-shaped mass radiating from the porta hepatis associated with parenchymal atrophy and flattening or retraction of the liver capsule. Volume loss of the affected portion of the liver is a key feature. The central portion of the right hepatic lobe is most often involved. The lesion is low attenuation on noncontrast CT. On arterial phase postcontrast CT, most lesions (60%) show little to no enhancement, whereas the remainder isoenhance with liver parenchyma. On portal venous phase, most lesions are hypodense or isodense to liver parenchyma, whereas 17% showed hyperenhancement (Fig. 26.10). On MR, the areas of fibrosis are hypointense to liver parenchyma on T1WI. On T2WI, signal intensity depends on the chronicity of the fibrosis. Acute fibrosis has high fluid content and appears bright on T2WI. Chronic fibrosis is low in fluid content and appears dark on T2WI. Postcontrast MR shows negligible enhancement on arterial phase and late enhancement on delayed venous phase.
Portal hypertension is a pathological increase in portal venous pressure that results in the formation of portosystemic collateral vessels that divert blood flow away from the liver and into the systemic circulation. Causes of portal hypertension include progressive vascular fibrosis associated with chronic liver disease, portal vein thrombosis or compression, and parasitic infections (schistosomiasis). Portal hypertension carries the risk of hemorrhage from varices and hepatic encephalopathy. The signs of portal hypertension include (Figs. 26.7, 26.9): (1) visualization of portosystemic collaterals (coronary, gastroesophageal, splenorenal, paraumbilical, hemorrhoidal, and retroperitoneal) (26); (2) increased portal vein diameter (>13 mm); (3) increased superior mesenteric and splenic vein diameters (>10 mm); (4) portal vein thrombosis; (5) calcifications in the portal and mesenteric veins; (6) edema in the mesentery, omentum, and retroperitoneum; (7) splenomegaly due to vascular congestion; (8) ascites; and (9) reversal of flow in any portion of the portal venous system (hepatofugal flow) (27).
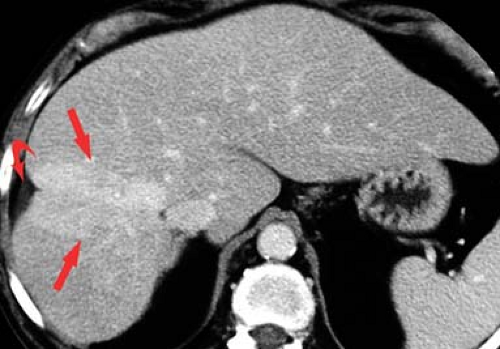 Figure 26.10. Confluent Fibrosis. Portal venous phase postcontrast CT image shows a mass-like enhancing lesion (straight arrows) extending from the portal hepatis to a prominent area of parenchymal atrophy with overlying retraction (curved arrow) of the liver capsule. This is an example of the minority of cases of confluent fibrosis that show contrast enhancement. Most cases (80%) of confluent fibrosis are hypoattenuating on noncontrast images and show no enhancement. |
Portal vein thrombosis may occur as a complication of cirrhosis, or may be caused by portal vein invasion or compression by tumor (Fig. 26.11), hypercoagulable states, or inflammation (pancreatitis). The cause is unknown in 8% to 15% of patients. On CT and US, the thrombus is seen as a hypodense plug within the portal vein. Malignant thrombus in the portal vein is contiguous with and extends from
the primary tumor. The portal vein is expanded, filled with tumor thrombus of the same imaging characteristics, including enhancement, as the primary tumor. Bland thrombus fills a portal vein of near normal size. On MR bland thrombus is of low signal because of its hemosiderin content. Bland thrombus does not enhance. On MR, the thrombus is hyperintense on T1WI when acute and isointense when chronic. Signal in the thrombus is increased on T2WI. Portal hypertension is exacerbated, or may be caused, by portal vein thrombosis. Cavernous transformation of the portal vein develops when small collateral veins adjacent to the portal vein expand and replace the obliterated portal vein. These collateral veins appear as a tangle of small vessels surrounding the thrombosed portal vein (27).
the primary tumor. The portal vein is expanded, filled with tumor thrombus of the same imaging characteristics, including enhancement, as the primary tumor. Bland thrombus fills a portal vein of near normal size. On MR bland thrombus is of low signal because of its hemosiderin content. Bland thrombus does not enhance. On MR, the thrombus is hyperintense on T1WI when acute and isointense when chronic. Signal in the thrombus is increased on T2WI. Portal hypertension is exacerbated, or may be caused, by portal vein thrombosis. Cavernous transformation of the portal vein develops when small collateral veins adjacent to the portal vein expand and replace the obliterated portal vein. These collateral veins appear as a tangle of small vessels surrounding the thrombosed portal vein (27).
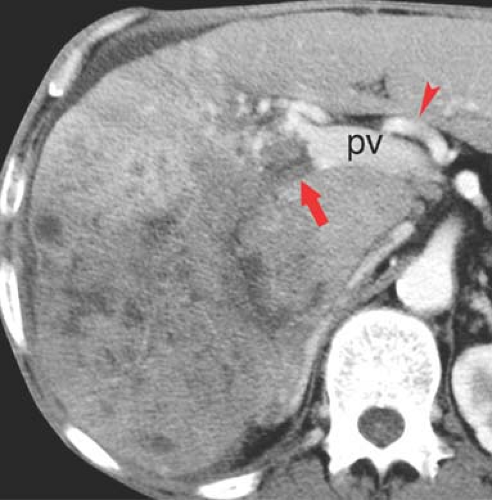 Figure 26.11. Portal Vein Thrombosis—Hepatocellular Carcinoma—Multinodular Appearance. Contrast-enhanced CT demonstrates multiple hypodense nodules representing hepatocellular carcinoma that is replacing the right hepatic lobe. The portal vein (pv) is invaded by tumor (arrow), seen as a filling defect with the vein. The hepatic artery (arrowhead) is enlarged because of cirrhosis and portal hypertension. |
Budd–Chiari syndrome refers to a group of disorders characterized by obstruction to hepatic venous outflow involving one or more hepatic veins (28). Hepatic venous obstruction causes increased pressure in the hepatic sinusoids, resulting in liver congestion, portal hypertension, and decreased hepatic perfusion. Diagnosis is urgent because of rapid progression to liver dysfunction, hepatocyte necrosis, and cirrhosis. Causes include coagulation disorders (the most common cause in Western countries), membranous webs obstructing the hepatic veins or IVC (most common in Asian countries), and malignant tumor invasion of the hepatic veins. In the acute stage, the liver is enlarged and edematous. Blood flow to the right and left hepatic lobes is severely impaired resulting in a characteristic “flip-flop” pattern on contrast-enhanced CT. On early images, the central liver enhances prominently, whereas the peripheral liver enhances weakly (Fig. 26.12). On delayed images, the periphery of the liver is enhanced, while contrast has washed out of the central liver. The caudate lobe is spared because of its separate venous drainage to the IVC. The caudate lobe is characteristically enlarged and enhances normally. Thrombus may be seen in the hepatic veins, or they may be reduced in caliber and difficult to visualize. Comma-shaped intrahepatic collateral vessels may be seen on CT or MR (the “comma sign”). Multiple benign hepatic nodules up to 3 cm size commonly develop. Most of them are detected by prominent contrast enhancement during the arterial phase or mild contrast enhancement during the portal venous phase.
In the acute stage of Budd–Chiari syndrome, MR shows in the periphery of the liver a moderately low signal on T1WI, a moderately high signal on T2WI, and a decrease in enhancement on both early and late postcontrast images. In subacute and chronic stages, MR shows increasing heterogeneity of the liver periphery on both T1WI and T2WI with the comma-shaped venous collaterals.
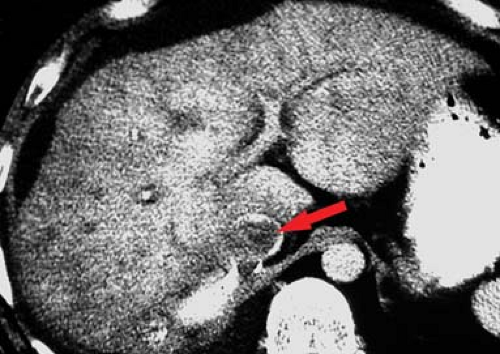 Figure 26.12. Budd–Chiari Syndrome. Early-phase CT images show the markedly heterogeneous liver with prominent central and weak peripheral enhancement that is characteristic of Budd–Chiari syndrome. Tumor invasion from a right adrenal carcinoma is seen as tumor thrombus (arrow) within the inferior vena cava. |
Passive hepatic congestion is a common complication of congestive heart failure and constrictive pericarditis. Hepatic venous drainage is impaired and the liver becomes engorged and swollen (29). Findings include distention of the hepatic veins and IVC, reflux of IV contrast into the hepatic veins and IVC, increased pulsatility of the portal vein, and inhomogeneous contrast enhancement of the liver. Secondary findings commonly present include hepatomegaly, cardiomegaly, pleural effusions, and ascites.
Hemochromatosis may be primary resulting from a hereditary disorder that increases dietary iron absorption or secondary due to excessive iron intake usually from multiple blood transfusions or chronic diseases including cirrhosis, myelodysplastic syndrome, and certain anemias (30). MR is the imaging method of choice for this condition because of its high sensitivity and specificity. The susceptibility effect of iron, best appreciated on T2* images, causes loss of signal in tissues with excessive iron accumulation.
The parenchymal pattern of iron deposition is seen with increased iron absorption of primary hemochromatosis and with secondary hemochromatosis caused by chronic anemias (thalassemia, congenital dyserythropoietic anemias, and sideroblastic anemia). This pattern shows a decreased MR signal in the liver, pancreas, and heart. The spleen and bone marrow are spared.
The reticuloendothelial pattern of iron deposition is seen in secondary hemochromatosis, with iron overload caused by blood transfusions. The excess iron accumulation occurs in reticuloendothelial cells in the liver, spleen, and bone marrow. MR shows diffuse decreased signal in all three areas (Fig. 26.13).
The renal pattern of iron deposition is rare but dramatic, occurring only in patients with intravascular hemolysis caused by mechanical heart valves. Excess iron deposition occurs in the proximal convoluted tubules of the renal cortex, causing a loss of cortical signal on T1WI and T2WI, and thus reversing the normal corticomedullary differentiation pattern.
CT is sensitive to only severe cases of hemochromatosis. Excess iron increases hepatic parenchymal attenuation above 72 H on noncontrast images. Wilson disease (copper deposition) and treatment with amiodarone (iodine deposition)
or colloidal gold also increase hepatic parenchymal attenuation on CT. Coexisting fatty infiltration will lower hepatic parenchymal attenuation and the sensitivity of CT for hemochromatosis.
or colloidal gold also increase hepatic parenchymal attenuation on CT. Coexisting fatty infiltration will lower hepatic parenchymal attenuation and the sensitivity of CT for hemochromatosis.
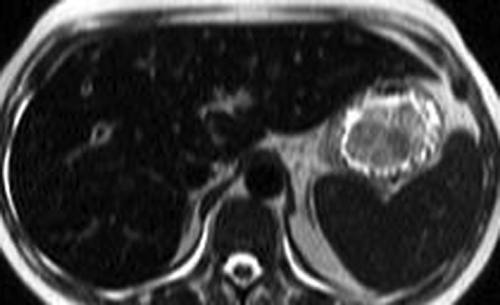 Figure 26.13. Hemochromatosis—Reticuloendothelial Pattern. T2-weighted MR images demonstrate markedly low-signal intensity in the liver, spleen, and bone marrow of the vertebral body. The low signal is caused by iron deposition in the reticuloendothelial system in this case of secondary hemochromatosis caused by multiple blood transfusions. |
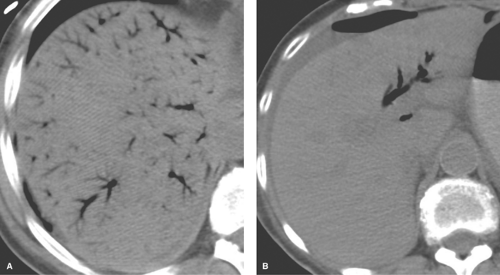 Figure 26.14. Portal Venous Gas Versus Pneumobilia. A. Noncontrast CT image reveals gas in the portal vein as air-density tubular structures extending to the periphery of the liver. In this case, portal venous gas was associated with the infarction of the small bowel. B. Gas in the biliary tree is central and does not extend into the peripheral 2 cm of the liver. Because gas rises to the highest accessible location, pneumobilia is usually seen on CT only in the anterior portions of the liver. |
Long-standing hemochromatosis places the patient at risk for cirrhosis, HCC, and colorectal carcinoma.
Gas in the portal venous system may be an ominous imaging sign associated with bowel ischemia in adults (Fig. 26.14) and necrotizing enterocolitis in infants (31). Additional, less ominous, causes include recent colonoscopy, enema administration, gastrostomy tube placement, abdominal trauma, inflammatory bowel disease, perforated gastric ulcer, necrotizing pancreatitis, diverticulitis, and abdominal abscess (27). CT reveals air in branching tubular structures extending to the liver capsule. Air is commonly evident within the mesenteric and central portal veins. Conventional radiographs show streaks of low density in the periphery of the liver. In distinction, air in the biliary tree is more central, not extending to within 2 cm of the liver capsule.
Liver Masses
A major challenge of liver imaging is to differentiate common and benign liver masses, such as cavernous hemangioma and simple hepatic cysts, from malignant masses such as metastases and hepatoma. US can definitively characterize hepatic cysts; however, benign and malignant solid masses overlap in sonographic appearance. CT can characterize most cysts and cavernous hemangiomas but only with optimal technique and multiphase contrast administration. On MR, simple cysts and hemangiomas are hypointense on T1WI and extremely hyperintense on T2WI. These benign masses are typically homogeneous and have sharp outer margins. Malignant lesions on MR tend to be inhomogeneous with unsharp outer margins, peritumoral edema, and central necrosis. Most focal lesions are hypointense on T1WI and hyperintense on T2WI. Hyperintensity of focal lesions on T1WI may be due to the presence of fat, blood, proteinaceous material, or melanin in melanoma metastases (Table 26.4). Diffuse hypointensity of liver, due to diffuse edema or iron overload, may make any lesion appear relatively hyperintense. Hypointensity on T2WI is commonly due to acute fibrosis (Table 26.5). Dynamic postcontrast CT and MR are utilized to provide the most definitive characterization of hepatic masses by assessing tumor blood flow during arterial, portal venous, delayed, and equilibrium phases of contrast enhancement (23,32).
Related posts:
Stay updated, free articles. Join our Telegram channel

Full access? Get Clinical Tree


