Bowel Ultrasound
Normal Anatomy
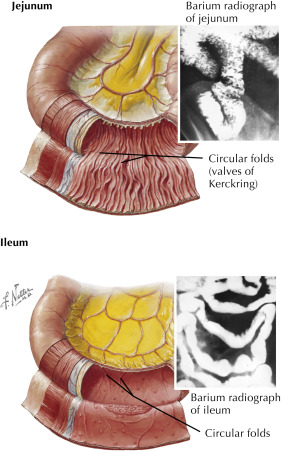
The small bowel consists of the bowel distal to the stomach and proximal to the colon. It is approximately 5 meters long and includes the duodenum, jejunum, and ileum. The small bowel contains prominent mucosal folds known as plicae circulares or valvular connvinetes . The jejunum has the most developed and highest concentration of these folds, which remain present even in distended bowel ( Fig. 21.1 ). The plicae circulares decrease in density as you move distally to a nearly smooth distal ileum. The mucosal layer of small bowel contains finger-like projections into the lumen called villi .
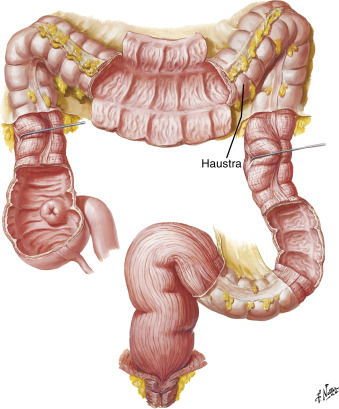
The large bowel begins with the cecum and includes the entire colon and rectum ( Fig. 21.2 ). At the point where the ileum joins the cecum, a sphincter is present (ileocecal valve) that prevents the backflow of contents into the small bowel. The cecum is a pouchlike structure that usually contains gas. The large bowel does not contain villi, and there are no major mucosal folds (excluding the rectum). The wall of the colon is creased by its muscular layer, including its serosa, into small sacs called haustra . This gives the colon a segmented appearance.
Ultrasound Techniques and Normal Findings
Imaging of the bowels is performed using a low-frequency transducer, such as a curvilinear probe (typically 3- to 6-MHz frequency), which allows for good penetration and a large field of view. The higher-frequency linear array can be used to evaluate thin or pediatric patients and to examine bowel adjacent to the abdominal wall in greater detail.
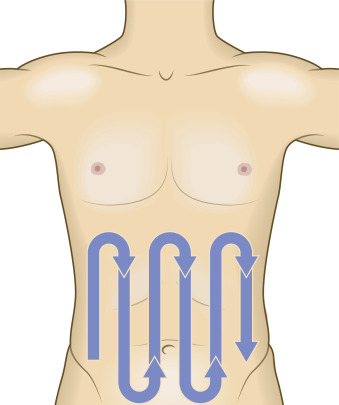
The bowel should be evaluated in a systematic fashion with the patient supine. One technique is described as the “lawn mower” pattern ( Fig. 21.3 ). In this method, begin in the right lower quadrant with the probe held in a transverse orientation (indicator directed to the patient’s right) and scan superiorly toward the right upper quadrant. The probe is then moved slightly medially and now scanned inferiorly, parallel to the original path. This pattern is repeated until the whole abdominal surface has been covered.
As the sonographer moves the probe across the abdomen, he or she will hold steady, consistent, posteriorly directed pressure into the abdomen at 1- to 2-cm intervals. This technique, known as graded compression, is performed in an attempt to disperse bowel gas and to bring the probe closer to the abdominal contents by compressing abdominal wall soft tissue toward muscular structures of the back.
The bowel is often filled with gas. This gas creates a shadow artifact that prevents visualization of any structures posterior to this artifact. This shadow is typically of mixed echogenicities (“dirty shadow”), as opposed to the typically anechoic shadows (“clean shadow”) of bone or calcium stones. However, bowel can be visualized when it is filled with liquid, semisolid, or solid material.
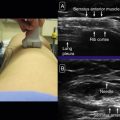
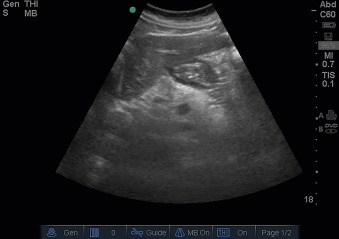
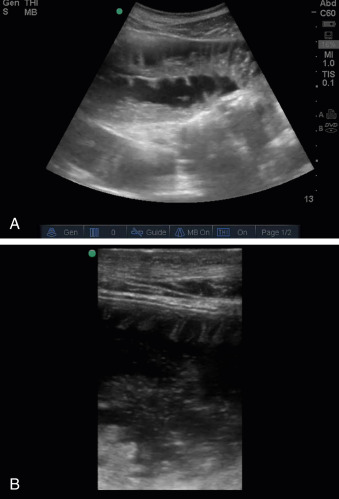
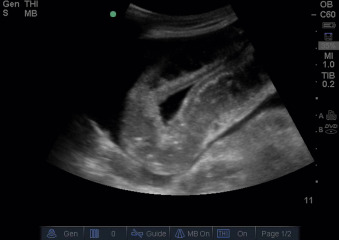
The duodenum is difficult to see on ultrasound, but a transverse segment can be seen on the caudal edge of the liver ( Fig. 21.4 ). The jejunum contains plicae circulares seen 3 to 5 mm apart. This can create a “feather-like” or “herring-bone” appearance ( Fig. 21.5 ). The ileum has fewer of these mucosal folds and may have a smooth appearance. At the terminal ileum, a hypoechoic “halo” may be seen representing the muscular lips of the ileocecal valve. These sonographic findings should be combined with the anatomic location of the bowel to determine the bowel loop under examination. The appendix will be discussed in the next section.
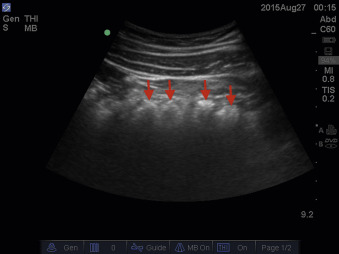
The large bowel has a similar appearance to the small bowel but is distinguished by periodic indentations every 3 to 5 cm apart corresponding to haustral sacculations ( Fig. 21.6 ). The large bowel does not contain plicae circulares. The colon can usually be evaluated from the cecal pole to the rectum. The transverse and descending colon may be difficult to examine, given the variable location and abundant echogenic fat surrounding the lumen, respectively. Valves of the rectosigmoid colon and rectum may be visible when the lumen is filled with fluid. Again, correlate the sonographic findings with the anatomic location (paracolic regions) to determine the loop under examination.
Small Bowel Obstruction
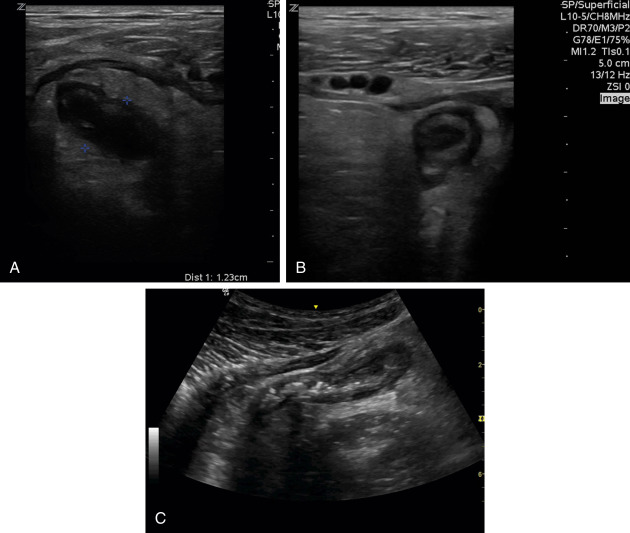
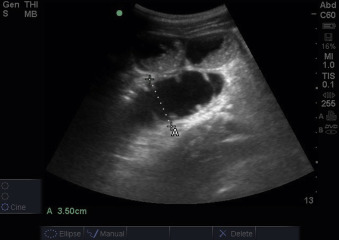
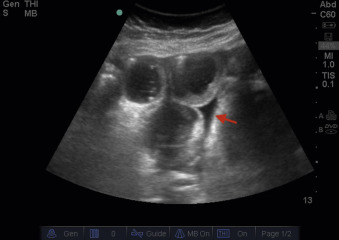
The hallmark finding of small bowel obstruction (SBO) is fluid-filled, dilated loops of bowel. The small bowel is considered dilated when greater than 25 mm in diameter ( Fig. 21.7 ). Some studies use a lower threshold for the ileum (15 mm). Some studies include a required length of dilated bowel. Other findings include collapsed bowel distal to the areas of dilation or absent/decreased peristalsis distal to the obstruction and the presence of peristalsis in the dilated loops. In a recent meta-analysis by Gottlieb et al., the pooled sensitivities and specificities of ultrasound for the diagnosis of SBO were 92% and 97%, respectively. Another finding is the “to-and-fro” sign, where intraluminal contents are seen in real time first moving distally, and seconds later the same echoes are visualized moving proximally in the direction from which they originated.
Ileus
Criteria differentiating ileus from SBO have not been well established. One group suggests that the presence of dilated small bowel loops with abundant gas and the absence of peristalsis with a colon filled with gas, fluid, or stool is suggestive of ileus. There have been case reports of ultrasound demonstrating gallstone ileus.
Large Bowel Obstruction
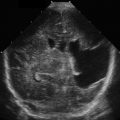
Large bowel obstruction is also defined by dilated bowel with a cutoff of greater than or equal to 50 mm located proximal to normal or collapsed large bowel. The bowel is filled with dense spot echoes and located on the periphery of the abdomen ( Fig. 21.8 ).
Strangulation of Bowel
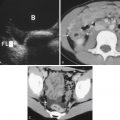
Strangulated bowel loops will be dilated and lack peristalsis. According to Schmutz and colleagues, as opposed to ileus, the distal bowel loops will be collapsed, and the colon will lack intraluminal contents. The bowel wall may become thickened (>3 mm) and lose its mucosal folds ( Fig. 21.9 ). There may be intraperitoneal fluid around the dilated loops of bowel. This free fluid may form a triangular wedge, termed the tanga sign after a similarly shaped bikini (see Fig. 21.9 ).
Etiologies of Bowel Obstruction
Although adhesions are one of the most common etiologies of bowel obstruction, this cannot be visualized using ultrasound. However, other etiologies may be seen, including intussusception, external incarcerated hernias, tumors of the bowel, and gallstone ileus.
Appendix
Clinical Correlation
Patients may present with acute or chronic right lower quadrant abdominal pain. Etiologies of this pain can be from several different organ systems, including intestinal, urologic, and genitourinary conditions ( Box 21.1 ). One entity that should be considered is appendicitis. Ultrasound may be used as the initial or even definitive modality of imaging to confirm this diagnosis. However, ultrasound findings can sometimes be indeterminate, or visualization of the appendix may not be possible. In these cases, computed tomography (CT) or magnetic resonance imaging (MRI) may be required and can lead to alternative diagnoses.
- •
Appendicitis
- •
Ureterolithiasis or renal obstruction (see Chapter 19 )
- •
Inguinal or abdominal wall hernia
- •
Referred pain from testicular pathology: testicular torsion, epididymitis-orchitis, etc. (see Chapter 22 )
- •
Ovarian or adnexal pathology (see Chapter 23 )
- •
Ectopic pregnancy or other pregnancy-related condition (see Chapter 24 )
Normal Anatomy
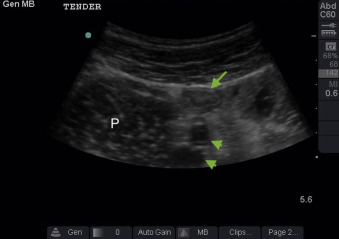
The normal appendix is 6 to 9 cm in length. It is an oval-shaped structure with defined layers (serosa, muscularis, submucosa, mucosa) and is typically less than 6 mm in diameter. The appendix is a blind-looped, vestigial organ that arises off the cecum. It is classically described as being located at McBurney’s point, which is one-third the distance from the anterior-superior iliac spine (ASIS) and the umbilicus on surface anatomy. Autopsy and imaging studies have demonstrated that the appendix is found at this location in only 30% to 40% of patients and is more likely to be oriented in a retrocecal location (up to 65%). The appendix will often lie superficial to the psoas muscle or iliac vessels ( Fig. 21.10 ). The normal appendix lacks peristalsis and will collapse with compression.
Ultrasound Techniques and Normal Findings
Imaging of the appendix is typically performed using a high-frequency linear array transducer (typically 9–12 MHz). However, in patients with more abdominal wall soft tissue, the curvilinear probe (typically 3–6 MHz) may be required for further penetration but comes at the expense of lower resolution.
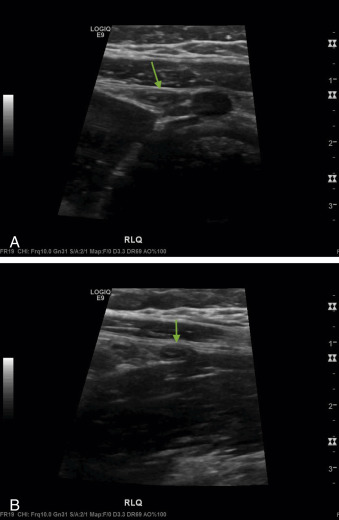
The patient is most commonly in the supine position during examination. However, a recent study shows promise that dynamic patient positioning can increase visualization of the appendix. One approach to finding the appendix is to begin the examination by placing the probe where the patient reports maximal pain. This region is then evaluated using graded compression, which involves slow, steady pressure into the abdomen using the transducer. This technique will decrease the distance between the appendix and the probe, as well as dissipate bowel gas and its problematic shadow artifact. The examination is continued in a systematic fashion in the right lower quadrant of the abdomen until the appendix is visualized. Once a loop of bowel is identified as probable appendix, it is critical to trace this segment to confirm that it is blind-ending ( Fig. 21.11 ). Otherwise, a loop of small bowel can be mistaken for the appendix. The appendix is often found overlying the right psoas muscle or the iliac vessels. Once the appendix is identified, it should be visualized in both its long and short axes ( Fig. 21.12 ). The diameter of the appendix should be measured from outer wall to outer wall at its maximal thickness. An attempt should be made to compress the appendix. Color Doppler may be used as an adjunct as is described later.
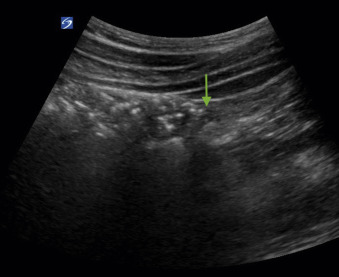
If the appendix cannot be found in the prior manner, an alternative technique can be used. Begin in the right upper quadrant with the probe indicator in a cranial orientation and identify bowel gas and haustra from the ascending colon. Again, bowel gas has a hyperechoic stripe superficially with a “dirty shadow” (mixed echogenicity shadow) posteriorly. The probe is then slid caudally toward the right lower quadrant, following the previously identified bowel gas. At the inferior end of the ascending colon, a transition point is encountered where bowel gas ends and abdominal contents are now able to be visualized ( Fig. 21.13 ). This represents the border of the cecum. Now that the cecum is identified, the probe is then moved in a medial and superior fashion to identify the appendix as it arises from the cecal pouch.
Visualization of the appendix is not only a technically challenging study for the operator but is also very dependent on patient factors such as body habitus and ability to comply with the examination. Obesity will add layers of soft tissue between the abdominal wall and the appendix, decreasing resolution and the ability to perform adequate graded compression. Appropriate analgesics before scanning is important so that the patient can tolerate the additional abdominal wall pressure during the graded compressions. If the appendix is not visualized using ultrasound, CT or MRI (pediatric, pregnant) may be necessary.
Pathology
Appendicitis
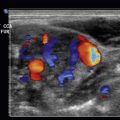
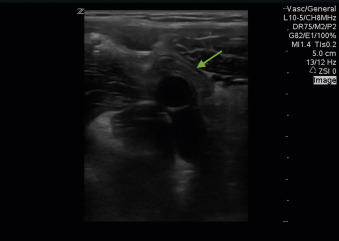
The hallmark imaging features of an inflamed appendix are (1) a dilated appendix that is greater than 6 mm in diameter and (2) is noncompressible ( Fig. 21.14 ). Again, it is of critical importance that the appendix is confirmed as having a closed end, as small bowel can easily be mistaken for the appendix on ultrasound imaging. The appendix should be visualized to its distal end, as appendicitis localized to the distal tip has been described. Other potential findings include periappendical fluid ( Fig. 21.15 ), which is an anechoic stripe or wedge adjacent to the appendix, or periappendical fat stranding ( Fig. 21.16 ). Fat stranding has a similar appearance to early edematous soft tissue (see Chapter 27 ). Fat stranding will be homogenous, hyperechoic haziness with loss of its naturally distinctive layers. Color Doppler may be used as an adjunct. When visualized in its short axis, the inflamed appendix will demonstrate increased flow circumferentially along its wall and give it a “ring of fire” appearance ( Fig. 21.17 ).