Introduction
The lumbosacral spine consists on average of 5 lumbar vertebrae, the sacrum, and coccyx. An MRI scan of this area is used to accurately depict soft tissue in and around the lumbosacral spine. Measurements mainly focus on a change in signal intensities and less on absolute distances or angles. Various pathologies affect the configuration of the soft tissue, which can lead to clinical symptoms such as neural compression syndromes, most commonly due to degeneration, congenital disorders, and benign or malignant neoplasms. Structures visible on MRI include neural structures, meninges, cerebrospinal fluid, blood vessels, fat, ligaments, bone and joints, discs, muscles, and organs. Knowledge of normal anatomy and the systematic assessment of these structures will help to generate the most accurate and clinically relevant scan interpretation. In addition, it is important to have a clinical question in mind before requesting and assessing a lumbosacral MRI, since, for example, degenerative abnormalities are common and asymptomatic in the majority of people. More importantly, among patients without clinical signs pointing toward a specific condition, imaging does not improve patient outcomes and may lead to worse outcomes, unnecessary harm, and increased costs.
The focus of this chapter will be on normal anatomical configuration and signal intensities on MRI, but will also expand on the disruption of normal anatomy with various pathologies and their clinical correlations.
General Anatomical Structures of the Lumbar Spine on MRI
Various lumbar spine MRI scanning protocols exist, each with its own advantages and disadvantages. In this chapter, the main focus will be on sagittal and axial T2-weighted images and T1-weighted images with and without gadolinium and fat-suppressed T1- and T2-weighted images. Axial images should be scanned parallel to the endplates, while keeping in mind that the scanning direction must change as little as possible in order to facilitate the assessment of the course of the nerve roots.
The choice for specific sequences depends on the structures and pathology that need to be assessed. Table 1 shows normal T1, T2, and T1 with gadolinium enhancement (T1-G) intensities on MRI. On T1-weighted images, tissues with short T1 times like fat and bone marrow appear bright, while tissues with long T1 times, such as fluid and cortical bone appear dark. On T2-weighted images, tissues with short T2 times appear dark, as, for example, tendons, ligaments, nerves, and bone. Tissues with long T2 times are bright, as, for example, fluid in the thecal sac and joint effusions. Fat appears bright on both T1- and T2-weighted images and, therefore, fat suppression techniques are often utilized to improve visualization of structures otherwise masked by fat. Furthermore, areas with hyperpermeable blood vessels as tumors, areas of inflammation and infection can show enhancement after gadolinium administration. As it has the highest number of unpaired electrons of all elements, gadolinium can be given as a contrast fluid to evaluate the accumulation of contrast. Often, these postcontrast T1 sequences are fat-suppressed to make this enhancement more distinguishable.
| A | Alignment | Lumbar lordosis, number of lumbar vertebrae, listhesis |
| B | Bone | Vertebral body, arch, spinous processes, endplates, fractures, lesions, and ligaments (including ligamentum flavum) |
| C | Canal | Cord, conus, cauda equina, cerebrospinal fluid, epidural fat |
| D | Discs | Discs, neuroforamina, facet joints |
| E | Enhancement and extraspinal structures | Organs, muscles, fat, skin, contrast enhancement |
MR images provide a wealth of visible structures. To be complete without losing oneself in a lengthy and unnecessary maze of findings, a structured way of assessing an MRI study is useful. For this purpose, we use a modification of the ABCDE-method ( Table 1 ).
Later, the normal anatomy of these structures will be discussed first, according to the ABCDE-structure. Following the normal anatomy, various pathologies and their appearances on MRI will be explained.
Alignment
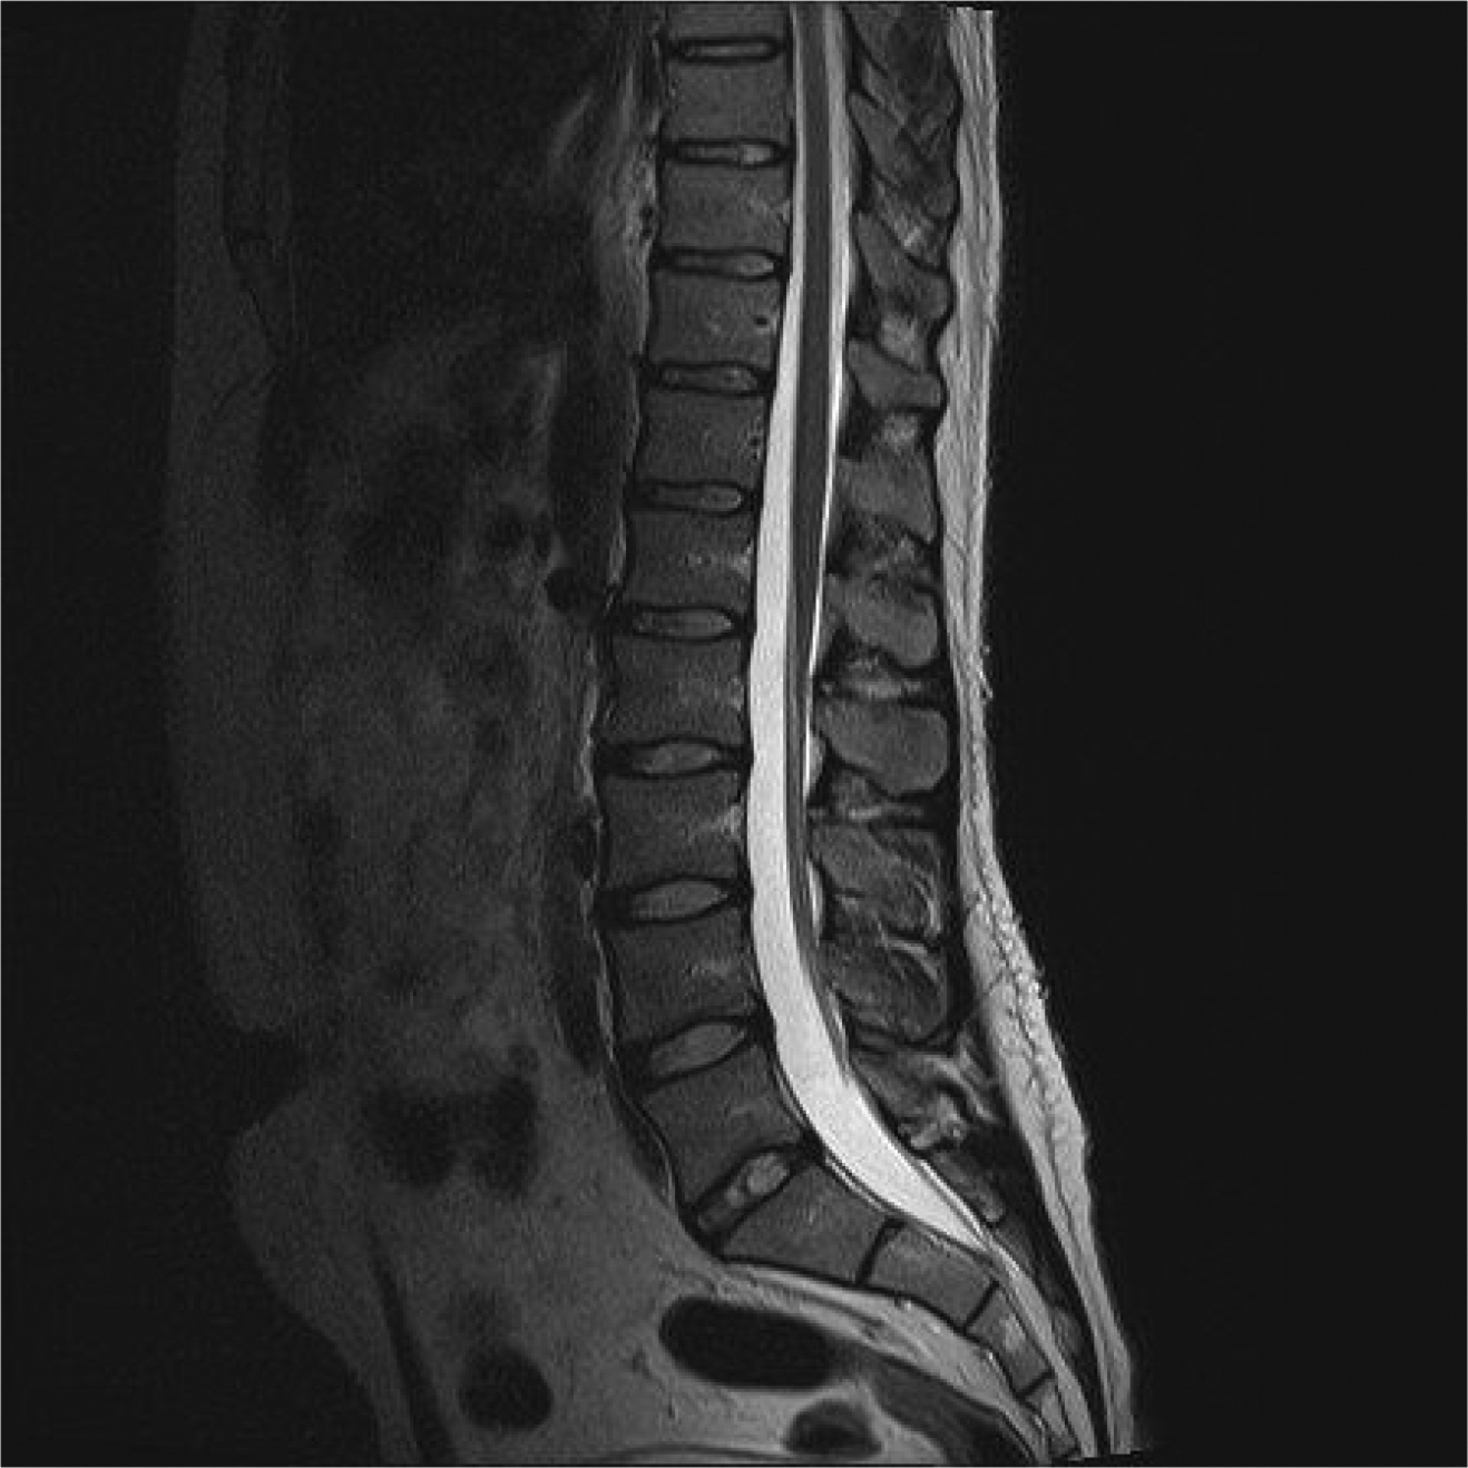
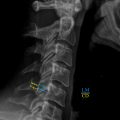
Assessment of alignment should include the presence of normal lumbar lordosis and proper positioning of each vertebra on top of the other. MRI of the lumbar spine is normally obtained with the patient in supine position. Previous studies have shown that MR images taken with the patient in supine position and legs straight out were comparable with standing MRI; however, a supine position with bent hips was found to significantly reduce lumbar lordosis by approximately 6.3° (14%). Spinal alignment should be judged on sagittal T1- or T2-weighted images ( Fig. 1 ). It should be emphasized that instability cannot be assessed on a supine MRI. Deviation of vertebrae from the midsagittal plane may indicate scoliosis; however, as previously stated, MRI is not the imaging modality of choice to categorize the scoliosis, to measure angles and to make a treatment plan.
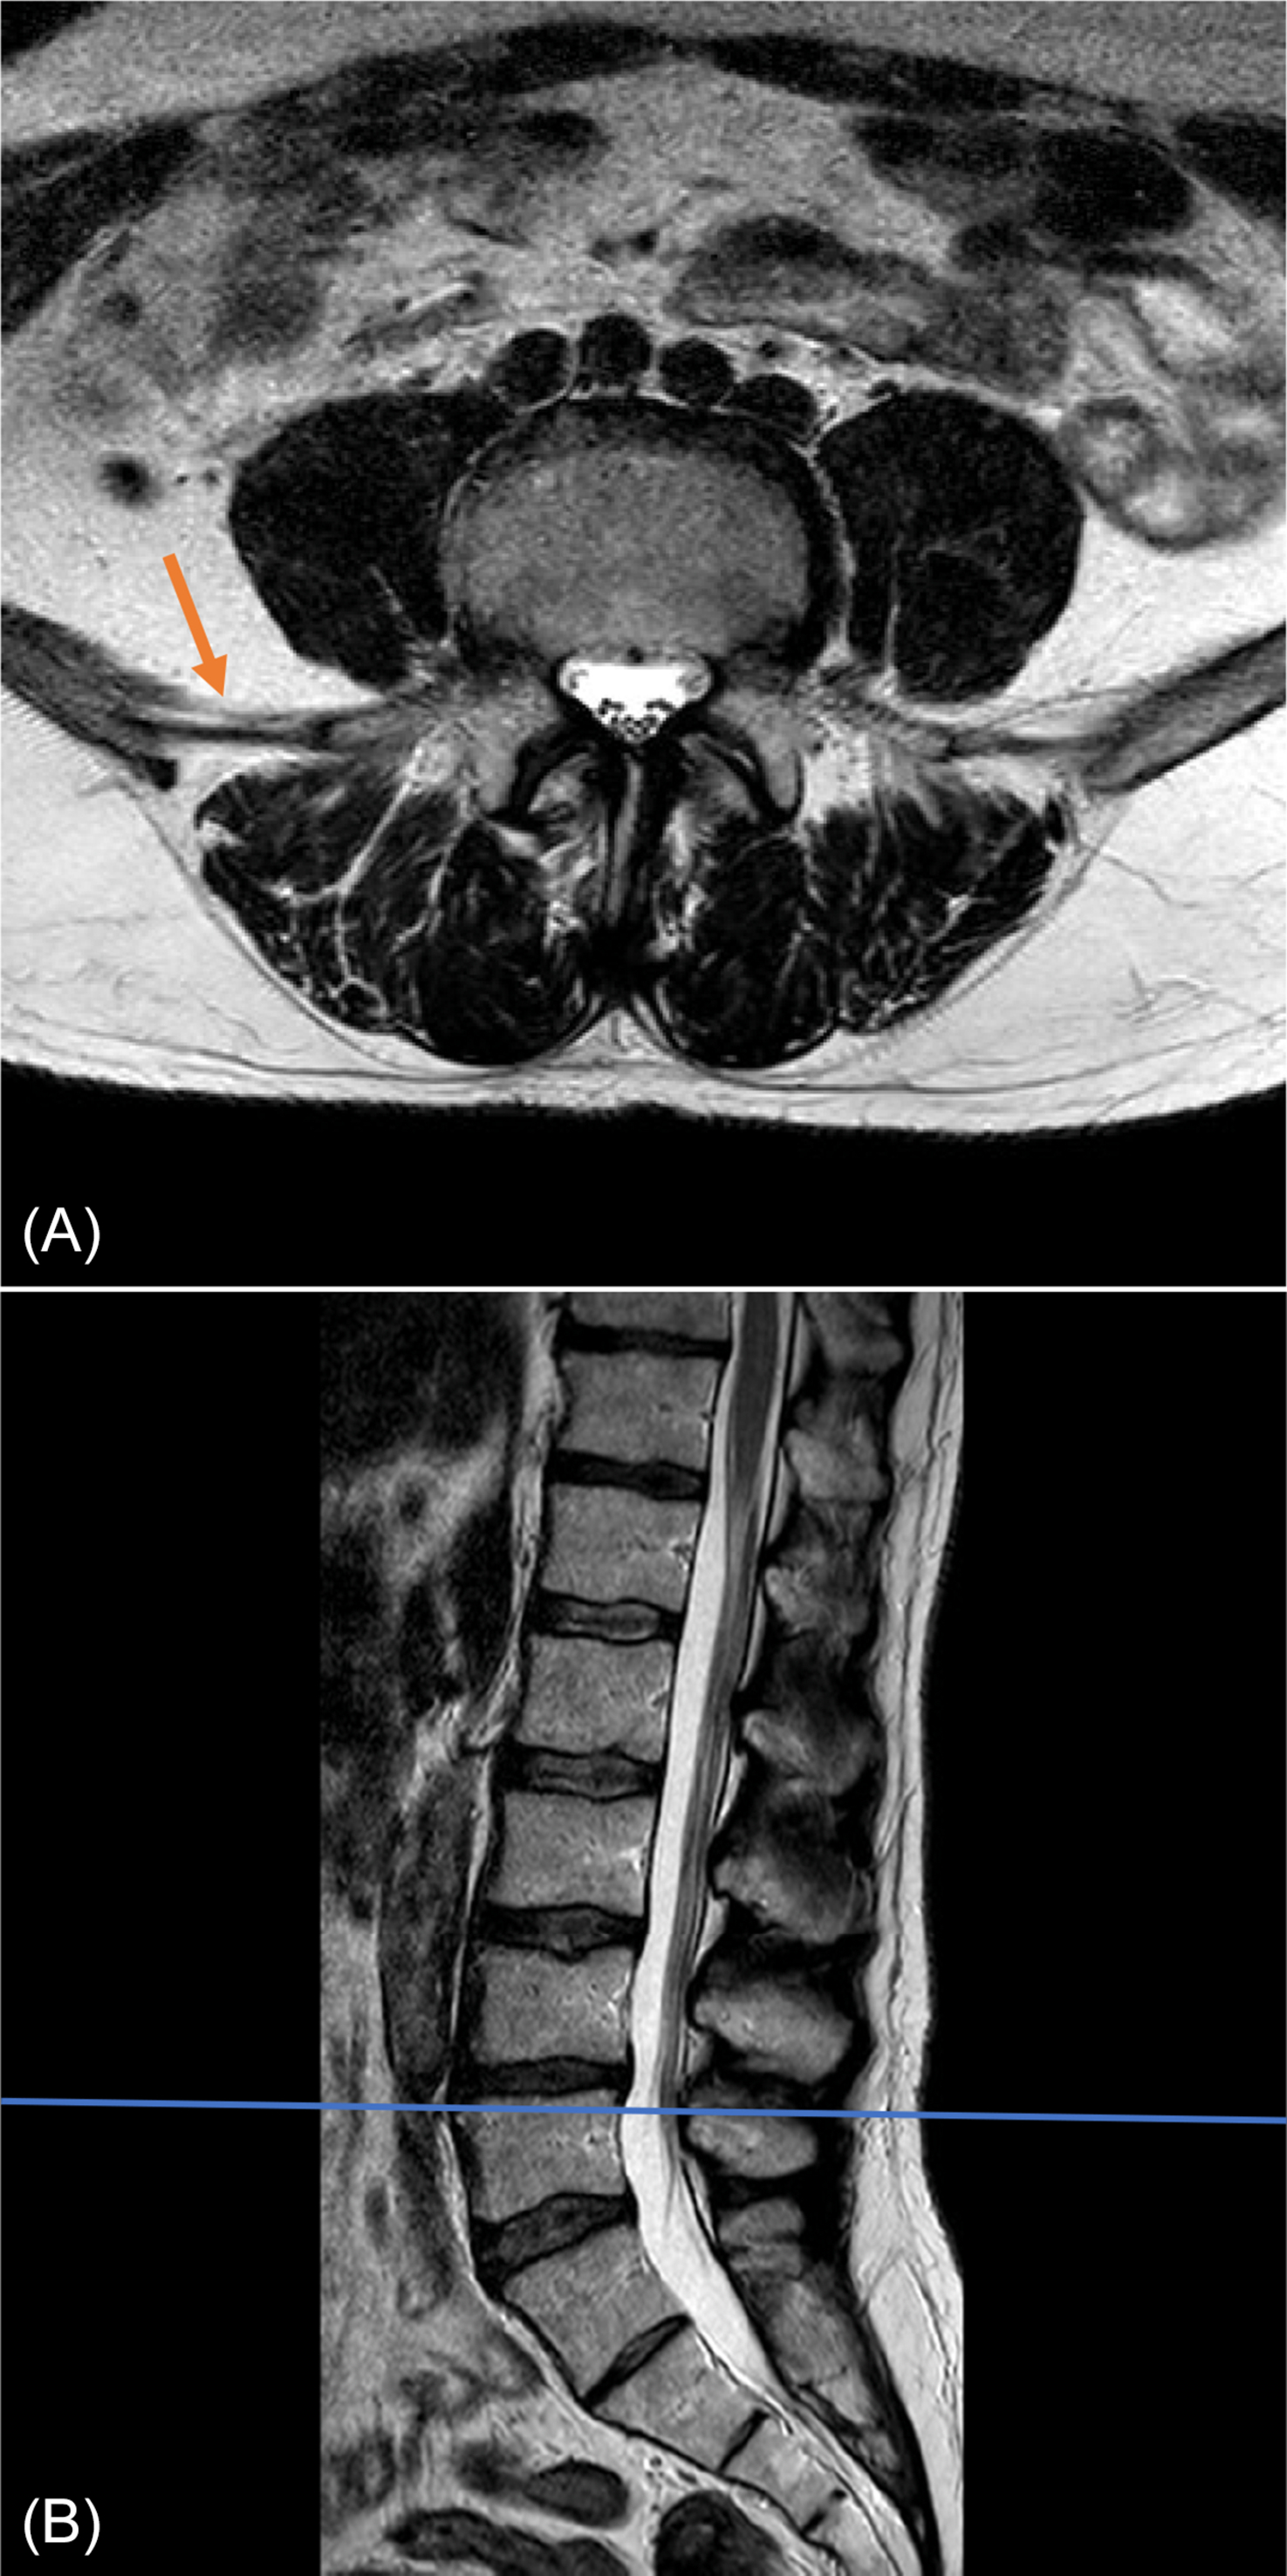
The most common number of lumbar vertebrae is five. In up to 20% of the general population lumbosacral transitional vertebrae (LSTV) are seen, of which the sacralization of L5 is the most common (~ 17%) and the lumbarization of S1 is rarer (~ 2%). Recognition of these anomalies is important as it can influence clinical decision making and help to avoid wrong-level surgery. The Castellvi classification ( Table 2 ) can be used to classify LSTV, but does not replace an accurate description of the anomaly. LSTV may be best visualized in a coronal view, because of the depiction of possible enlarged transverse processes of the lowest lumbar vertebra and the connection with the superior sacrum. However, coronal images are not routinely included in a standard lumbosacral MRI protocol. Ways to recognize LSTV on sagittal images are the recognition of the iliolumbar ligament as this is found to arise from L5 in more than 95% of people ( Fig. 2 ) and a complete S1–2 intervertebral disc. If a LSTV is seen or suspected, aforementioned characteristics should be noted, including where the lowest well-formed intervertebral disc can be found, as this can be recognized at fluoroscopy during invasive treatments.
| Type I: Enlarged and dysplastic transverse process in coronal view (at least 19 mm) |
|
| Type II: Pseudoarticulation of the transverse process and sacrum with incomplete lumbarization/sacralization; enlargement of the transverse process with pseudoarthrosis |
|
| Type III: Transverse process fuses with the sacrum and there is complete lumbarization or sacralization, enlarged transverse process with complete fusion |
|
| Type IV: Type IIa on the one side and Type IIIa on the contralateral side |
Bone
Bony and bone-related structures that need to be assessed are vertebral body, arch, spinous processes, endplates, fractures, lesions, and ligaments. The vertebral body is the largest part of the vertebral column and in its upper part arise two pedicles, which are connected to two laminae. These, together, form the vertebral arch, connected to a spinous process in a normal situation. The vertebral body is oval-shaped in the axial plain and square in the sagittal plane. Its upper boundary is formed by the upper endplate and the lower boundary is formed by the lower endplate, which are normally symmetrically concave-shaped and without disruptions in young people. With age and degenerative processes, endplates can become thinner and even completely absent. Whether the endplate belongs to the disc or the vertebral body is still debated, since it encompasses both an osseous component as well as a hyaline cartilage component. In young patients, mainly under the age of 25, areas of focal fat deposition are common in the posterior elements of the vertebral body, as well as areas of high vascularity, due to conversion and reconversion processes. These areas include the subendplates and subcortical zones and also the area surrounding the basivertebral vein in the middle of the vertebral body ( Fig. 1 ). This is a normal aging process of conversion and reconversion, expressed by the replacement of red marrow by yellow marrow, and should not raise suspicions when encountered. Other frequent and usually not pathological lesions in vertebral bodies are hemangiomas and vertebral enostosis.
The most important ligaments of the lumbar spine are the anterior longitudinal ligament (ALL) running in front of the vertebral bodies and intervertebral discs from the pelvic surface of the sacrum inferiorly to the anterior tubercle of C1 and basilar portion of the occipital bone superiorly, the posterior longitudinal ligament (PLL) running posteriorly over the vertebral bodies and discs from the sacrum to C2. It then extends as the tectorial membrane at the level of the odontoid. The ligamentum flavum connects the inner lamina, interspinous ligaments, and supraspinous ligaments. Ligaments and also cortical bone appear hypointense on both T1 and T2 and exhibit a slim and regular appearance.
Spinal Canal
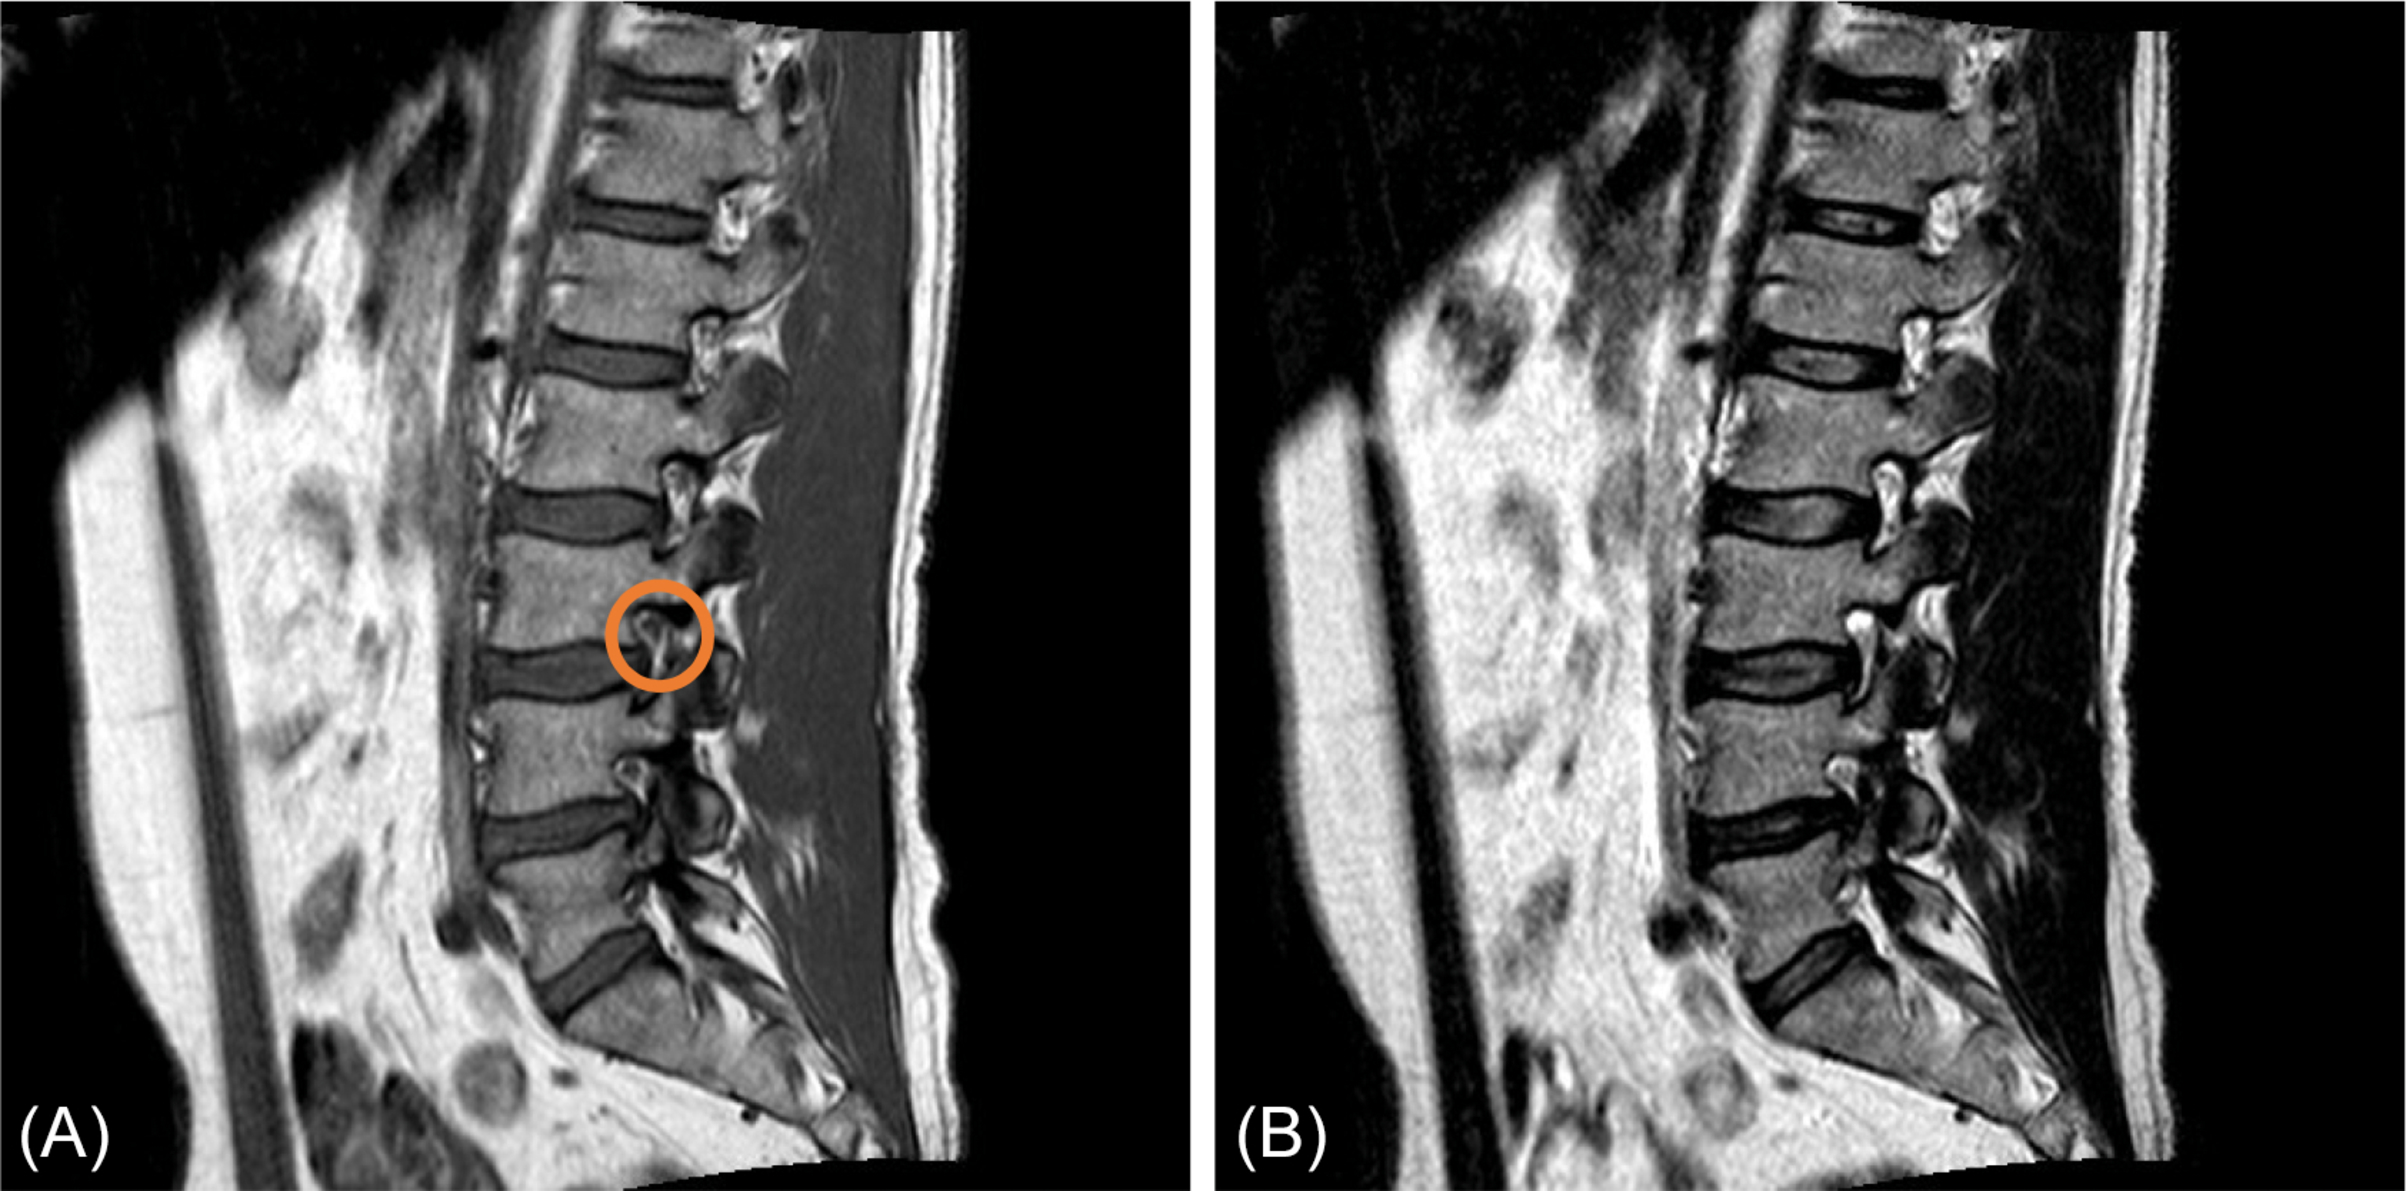
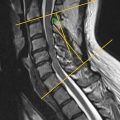
The vertebral arches surround the spinal canal. This canal contains the thecal sac with the spinal cord above the L1-L2 level, cauda equina below this level and the conus at the interface of spinal cord and cauda equina floating in cerebrospinal fluid. Cerebrospinal fluid is hyperintense on T2 and hypointense on T1. However, flow voids can mimic a hypointense signal on T2. The neural structures are normally iso- to hypointense on T1- and T2-weighted images. Nerves of the cauda equina can be followed along their course running from the thecal sac through the lateral recess and foramen intervertebralis to the neural plexus. The nerve is normally running just below the pedicle. This is above the level of the discus in the foramen intervertebralis. The nerve is surrounded by fat, which makes it assume the shape of an oval fried egg on sagittal images. This is best visible on a T1-weighted sequence ( Fig. 3 ), when no compression is present. Normal presence of epidural fat is also seen on the dorsal side of the thecal sac anterior to the ligamentum flavum. Furthermore, a venous plexus is present in the canal and normally shows enhancement on a T1 with gadolinium.
There are various ways to measure spinal canal diameter, without consensus in literature nor uniform appliance in practice. As a result, various quantitative and qualitative measurements exist for the measurement of spinal canal diameter. In an international consensus meeting between radiologists, consensus was reached about the use of five radiological criteria for lumbar spinal stenosis (LSS), which are all qualitative measurements related to LSS and therefore further described later in this chapter. Canal diameter can be quantitatively measured on axial T2, sagittal T1, and sagittal T2 images, as the mid-diameter of the thecal sac at the level of the intervertebral disc and midvertebral level ( Fig. 3 ).
Intervertebral Discs
Intervertebral discs connect the vertebral bodies and together with ligaments buffer and support the spine from the distribution of forces that arise from axial compression and movement. The discs consist of a soft gelatinous core, which is named nucleus pulposus and firm rim, composed of concentric lamellae of fibrocartilage named annulus fibrosus. These can be seen on an MRI T2 as a relatively hyperintense nucleus pulposus and hypointense annulus fibrosus. Degeneration of discs is a common finding in symptomatic and asymptomatic subjects, which leads to dehydration of discs, visible as lower intensities on T2-weighted images. Herniated discs will be discussed further on in this chapter. When looking at discs, one should also judge the ligamentum flavum, neuroforamina, lateral recesses, and facet joints with their synovium. Figs. 1 and 2 show the normal anatomy of these structures, in relation to adjacent nerve roots. Knowledge of this anatomy is compulsory, as it determines the different levels of neural compression and related clinical symptoms. For example, the L4 root exits just below the pedicle of L4 and therefore will be only compressed by a far lateral disc herniation of the L4-L5 disc.
Enhancement and Extraspinal Structures
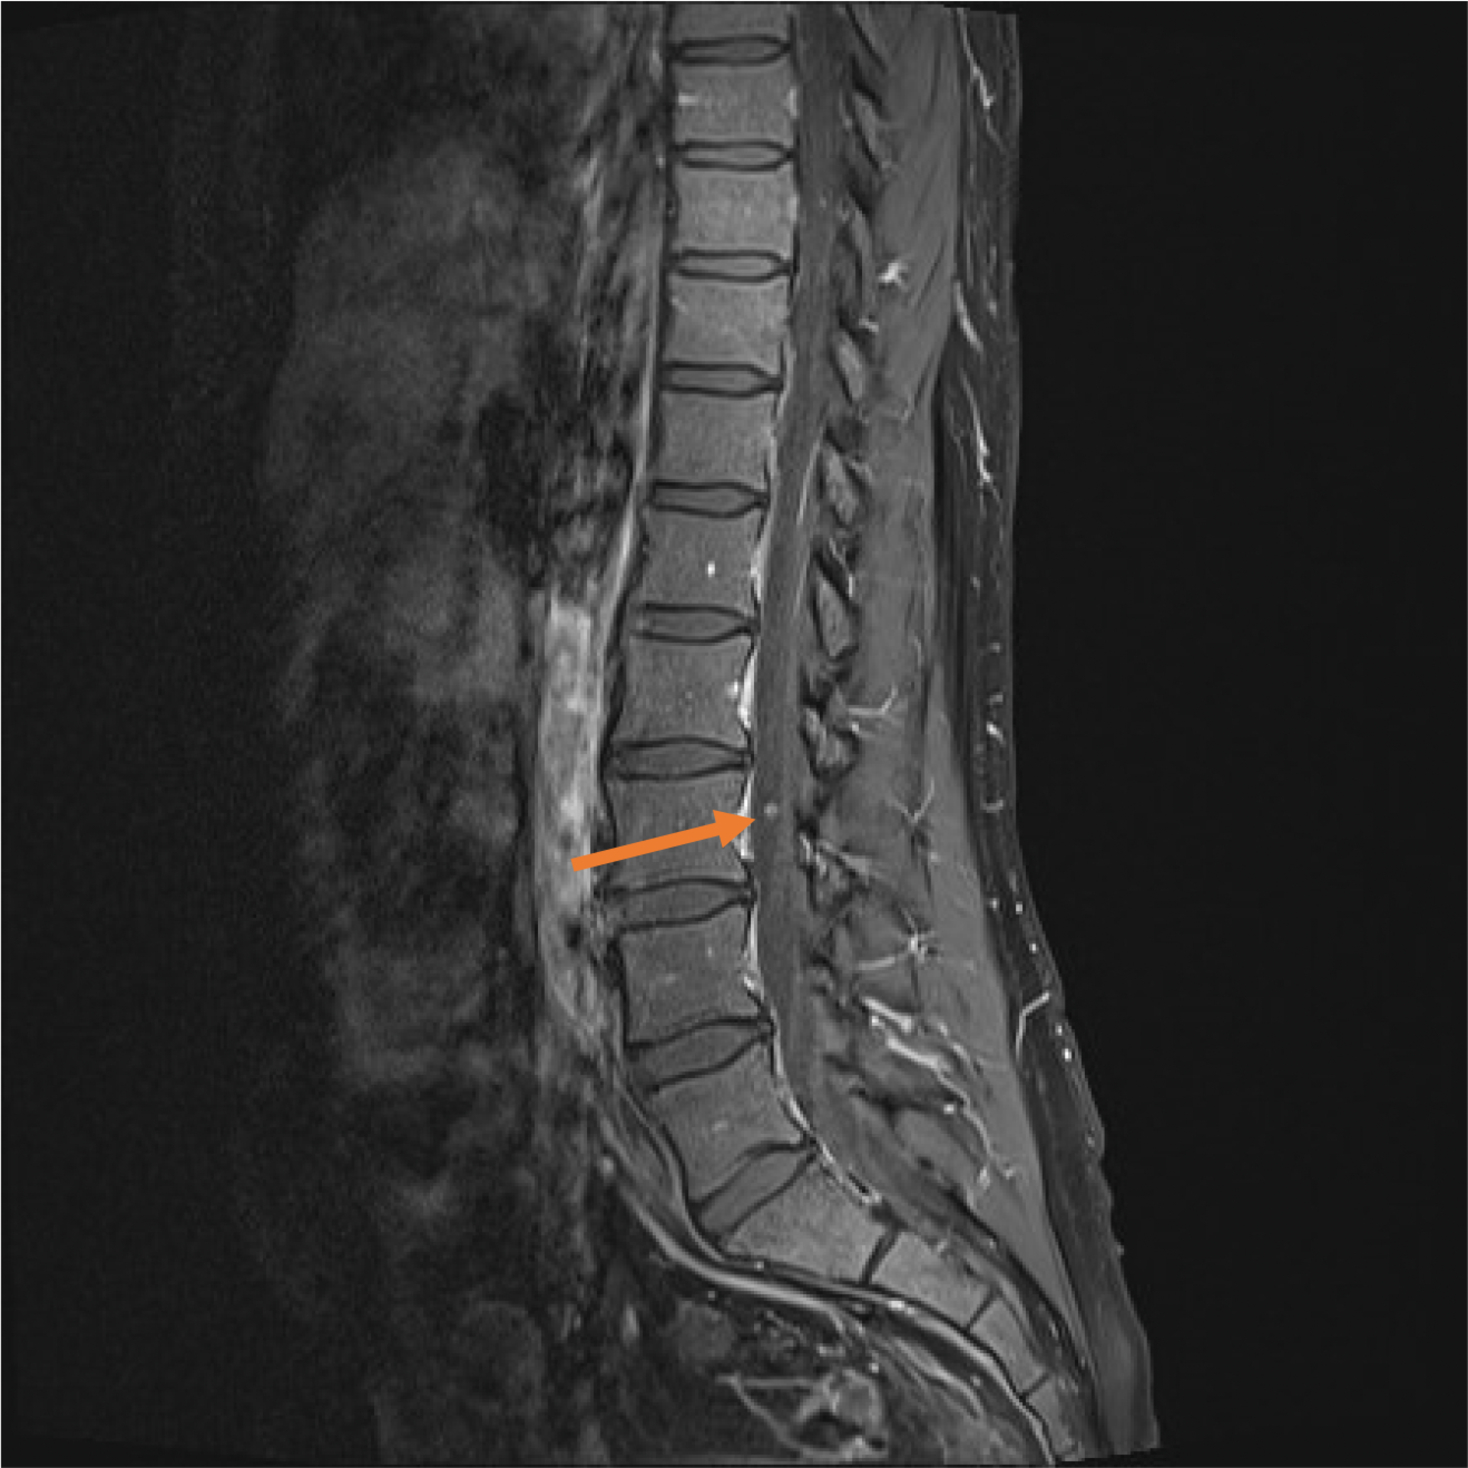
As a lumbar spine MRI also shows the abdominal area, visible extraspinal structures should also be assessed. These include organs as bladder, kidneys, uterus, bowel, aorta, muscles, subcutaneous tissue, and skin. Furthermore, enhancement after gadolinium administration should be assessed. Normal areas of contrast enhancement are epidural venous plexus, basivertebral veins, dorsal nerve root ganglion, and veins over the surface of the conus and cord. This enhancement can be differentiated from pathological enhancement by its expected anatomical location and flat and regular appearance in contrast to, for example, leptomeningeal metastasis, which are more nodular ( Fig. 4 ).
Abnormal Findings of the Lumbar Spine on MRI
Trauma
MRI is not the imaging modality of choice for lumbosacral spinal trauma, as it does not show bone and vertebral fractures as well as CT imaging or plain radiographs. However, its role is reserved for cases with neurological deficits. The differential diagnosis would be, for example, intervertebral traumatic disc rupture into the spinal canal, traumatic hematomas compressing the thecal sac or disco-ligamentous injury. This is different in occipitocervical, cervical, and thoracic trauma. However, these are not the subject of this chapter.
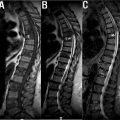
In the evaluation of a posttrauma, lumbosacral MRI scan attention must be paid to T2 signal hyperintensities due to edema or extravasation of blood, while ligaments are usually hypointense on all MRI sequences on T2-weighted images. Furthermore, bone marrow edema caused by a fracture or trabecular contusion and soft tissue edema or ligaments or disc disruption can be visualized on MRI ( Fig. 5 ).
The differentiation between benign and malignant compression fractures can sometimes be difficult, especially in the case of osteoporotic fractures, because acute or subacute benign vertebral compression fractures can also show enhancement, large areas of low signal intensity on T1- and high signal intensity on T2-weighted images and even increased metabolism on nuclear imaging modalities, due to intertrabecular hemorrhage, edema, and healing processes. Differentiating signs are a normal posterior element signal intensity and dislodged bony fragments in benign vertebral column fractures, with no epidural or paravertebral soft tissue mass and no expansion of the posterior vertebral contours. Furthermore, in benign vertebral column fractures, margins are more regular, and no diffusion restriction is visible ( Fig. 6 ).
Degenerative Changes on Lumbosacral MRI
As previously stated, the presence of degeneration in a lumbar spine is a common finding and by no means an indicator of symptoms. The etiology of these common degenerative changes is multifactorial: mechanical, traumatic, nutritional, inflammatory, and genetic factors are involved. In asymptomatic individuals, the prevalence of disc degeneration ranges from 37% at the age of 20 years to 96% at the age of 80 years. Facet degeneration has a prevalence of 4%–9% in asymptomatic individuals between 20 and 30 years of age, but its prevalence rises to 83% at the age of 80. Even spondylolisthesis is present in 50% of asymptomatic individuals of 80 years old, Table 3 .
| 20 Years | 30 Years | 40 Years | 50 Years | 60 Years | 70 Years | 80 Years | |
|---|---|---|---|---|---|---|---|
| Disc height loss | 24% | 34% | 45% | 45% | 67% | 76% | 84% |
| Disc protrusion | 29% | 31% | 33% | 36% | 38% | 40% | 43% |
| Facet degeneration | 3% | 9% | 18% | 32% | 50% | 69% | 83% |
| Spondylolisthesis | 3% | 5% | 8% | 14% | 23% | 35% | 50% |
Symptomatology can result from degenerative changes leading to the compression of neural structures and inflammatory changes. However, it is understandable that the findings of MRI should be interpreted based on the clinical presentation of the patient and not vice versa. It is of paramount importance that the clinical reason leading to the request of the MRI is stated on the application form in order to ensure proper judgment of a lumbar spinal MRI.
Radicular syndromes, neurogenic claudication, and lateral recess syndrome are frequently encountered. The compression of a nerve root by a herniated intervertebral disc is the most common cause of a radicular syndrome. Other possibilities are a tumor or inflammation causing compression. Neurogenic claudication or Verbiest’s syndrome is due to narrowing of the lumbosacral spinal canal by an absolute stenosis and/or a listhesis, which may be due to degeneration of the spine, or more seldom a space-occupying mass, for example, a tumor or epidural lipomatosis. A neurogenic claudication occurring in just one leg, called lateral recess syndrome, can be caused by lateral recess stenosis or a foraminal stenosis.
Intervertebral disc degeneration
Degenerative discs can be described according to the Pfirrmann classification and the accompanying endplate changes according to the Modic classifications. However, a study by Zehra et al. showed great variation exists when it comes to endplate nomenclature and etiology when assessed on MRI and another study conducted by this group showed that a more multidimensional perspective in the assessment of endplate changes is needed in the assessment of endplate changes in MRI, this includes the measurement of depth and width of each endplate defect on MRI. The added values of these endplate defects in a cumulative endplate defect score are correlated with Oswestry Disability Index scores in literature. However, correlation of clinical symptoms with these findings is difficult, even with hopeful research efforts, and controversies remain in literature and clinical practice about the role of endplate changes and disc degeneration when it comes to back pain.
The posterior herniation of intervertebral discs must be described by location: central/median, paramedian, foraminal, or extraforaminal ( Fig. 7 ), and kind of herniation can be described by the terms protrusion; extrusion; sequestration, migration, and bulging ( Fig. 8 ). The size of the herniated disc can be mentioned, but most importantly, compression of nerves by the herniated disc must be explicitly named. Signal intensity of the herniated disc must be noted. Herniated discs with high signal intensity and free fragmentated disc material have a high change of resolution with conservative therapy. Obviously, conservative management is contraindicated in the case of a cauda equina syndrome.


Degenerative spinal stenosis
Degenerative spinal stenosis includes the narrowing of the central spinal canal, lateral spinal canal, or neuroforamina due to degenerative changes of the vertebral body, facet joints, intervertebral discs, and/or ligaments. Furthermore, epidural lipomatosis can be a contributing factor or an isolated cause in degenerative spinal stenosis. When performing measurements of the spinal canal diameters, one should realize that spinal canal diameter will vary between individuals and quantitative measurements are not sufficient and can even be mystifying when describing the amount of stenosis. As a substitute, qualitative measures should be used to indicate the severity of the stenosis, in other words: the radiographic consequences of the stenosis. Furthermore, we recommend describing the cause of the stenosis, as this influences and supports surgical strategy. Moreover, a variation in normal spinal canal diameter exists in the general population. As described by Singh et al., congenital stenotic patients are the patients with a shorter pedicular length and with that a smaller cross-sectional spinal canal area with mean critical values of 6.5 mm and 213 mm, respectively. This predisposes these patients to symptomatic neurogenic claudication and potential need for multilevel treatment.
Qualitative measures at the level of the stenosis include compromise of the central zone, visibility of cerebrospinal fluid, possibility to distinguish rootlets, amount of epidural fat, broadening of the ligamentum flavum, hypertrophy of facet joints, presence of synovial cysts, presence of disc pathology, and above the level of the stenosis the presence of redundant roots. The lateral canal and neuroforamina also need to be assessed for nerve root compression in the lateral recess, size, and shape of the foramen. This should include nerve root compression in the neuroforamen and the presence of intraforaminal perineural fat.
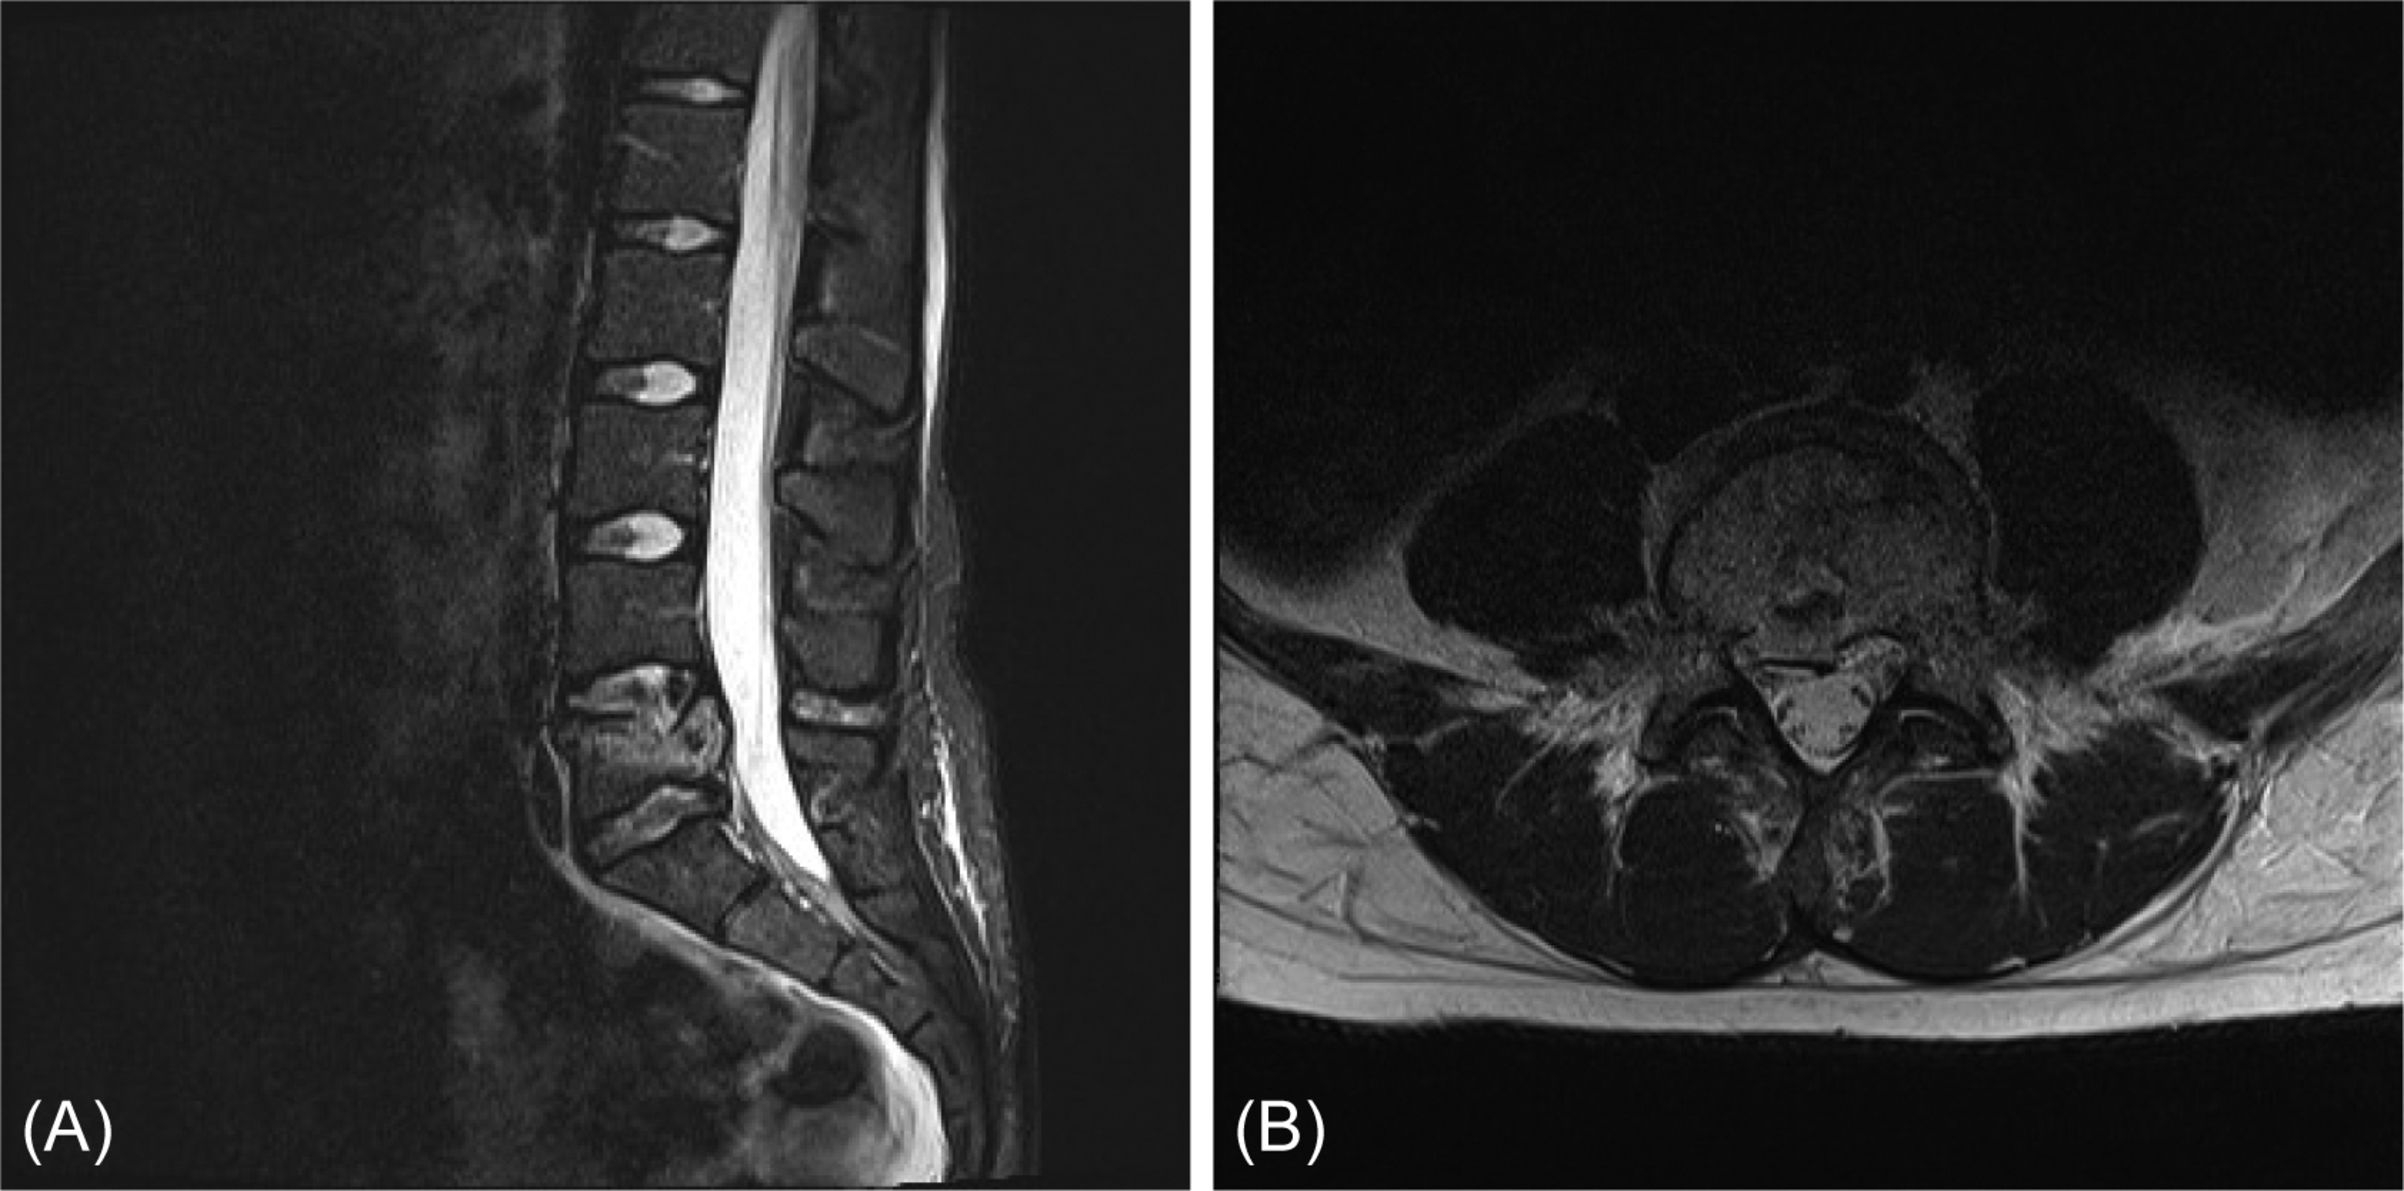
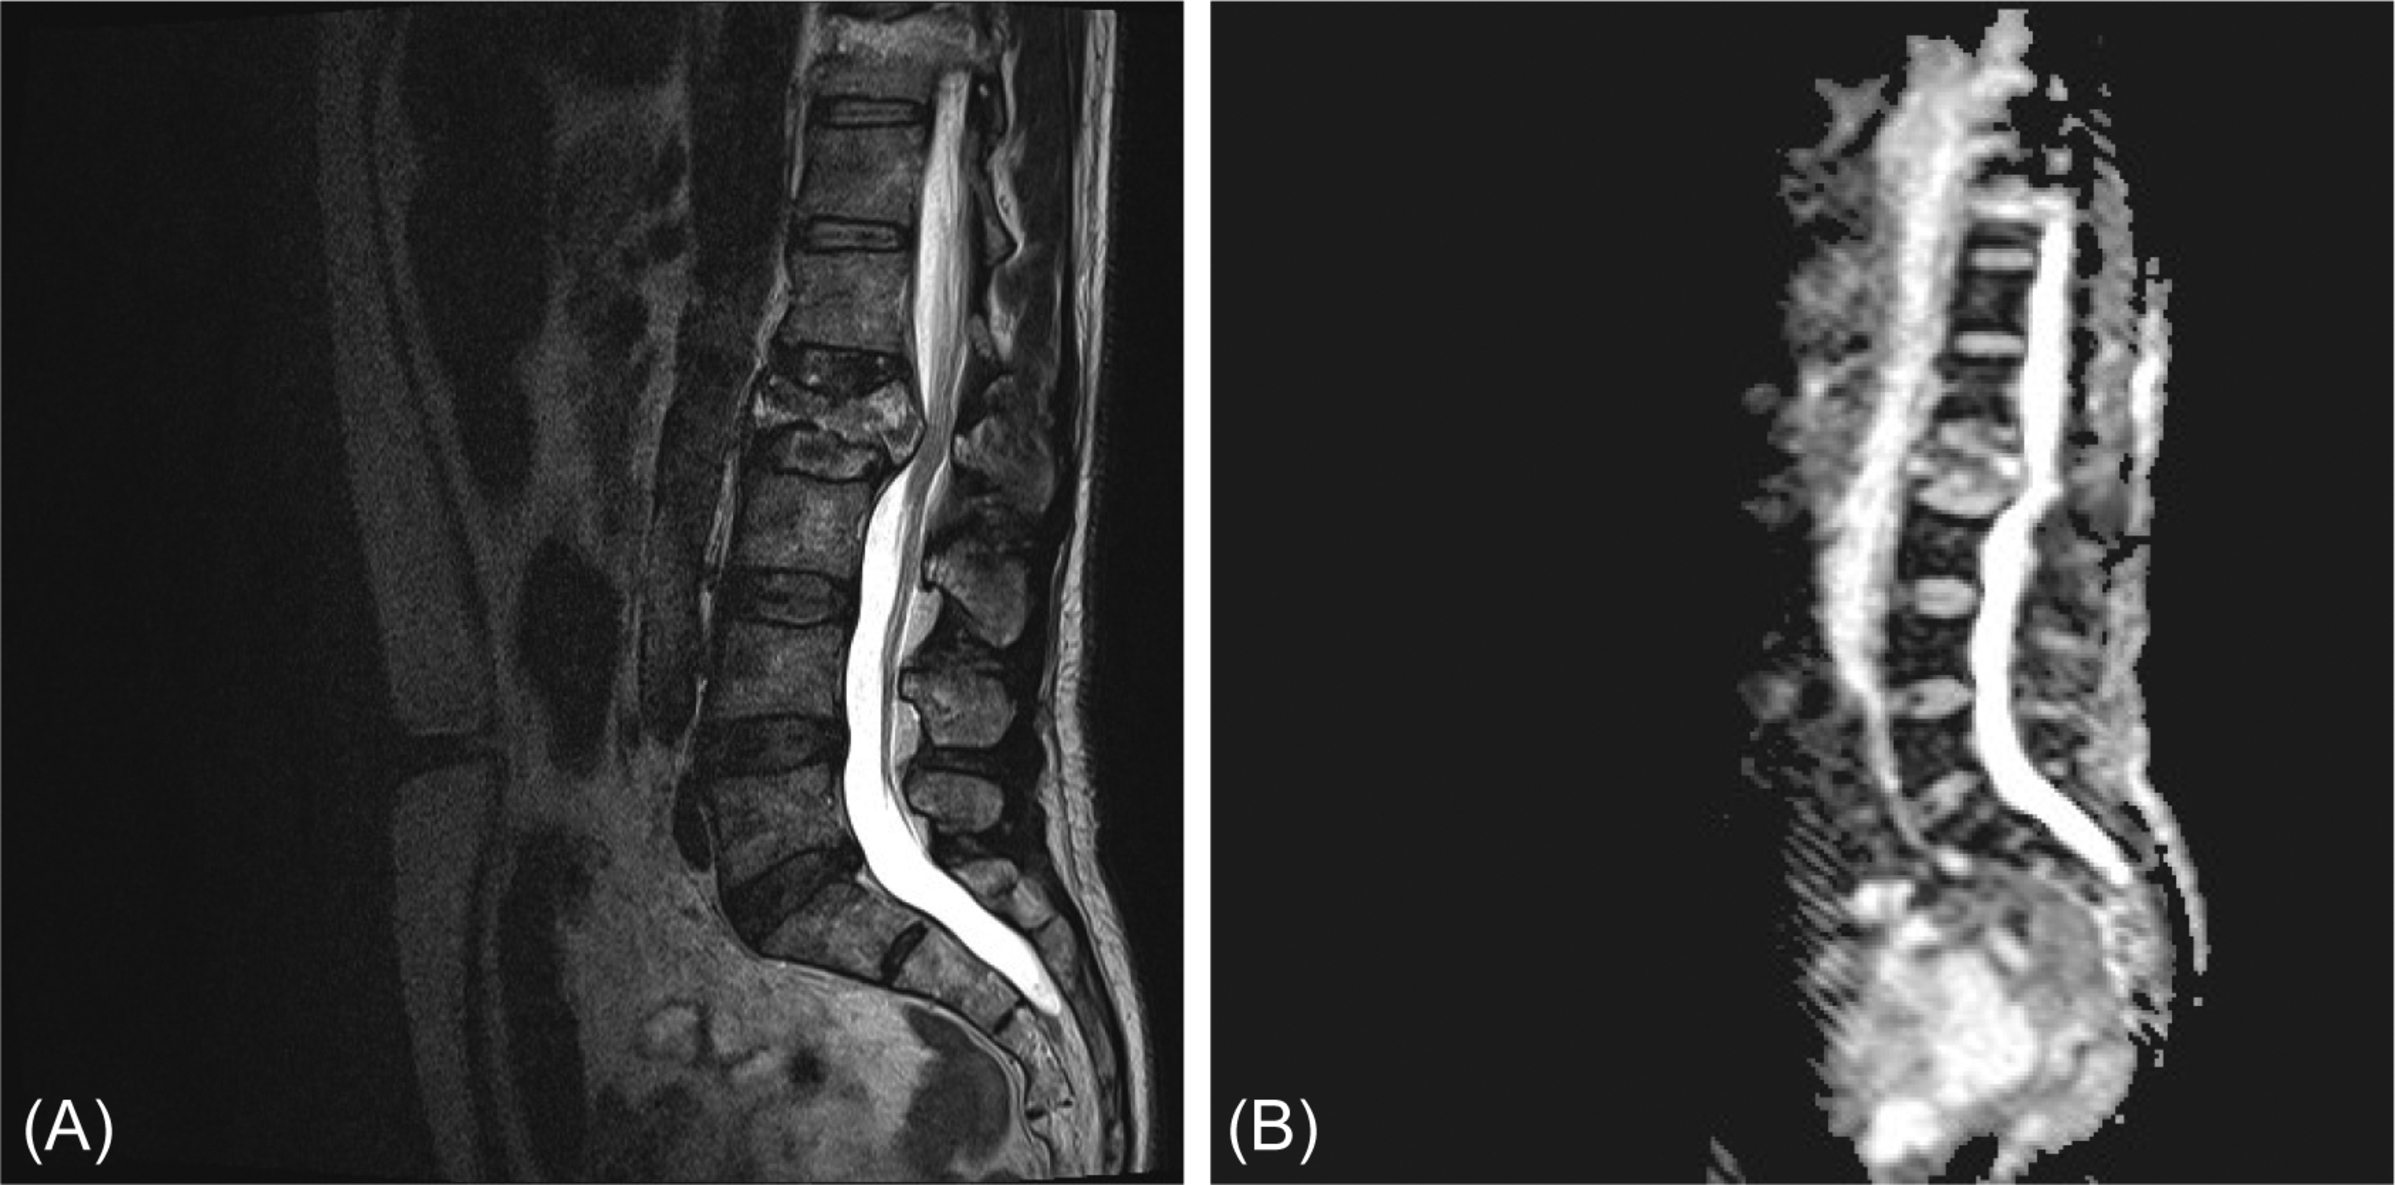
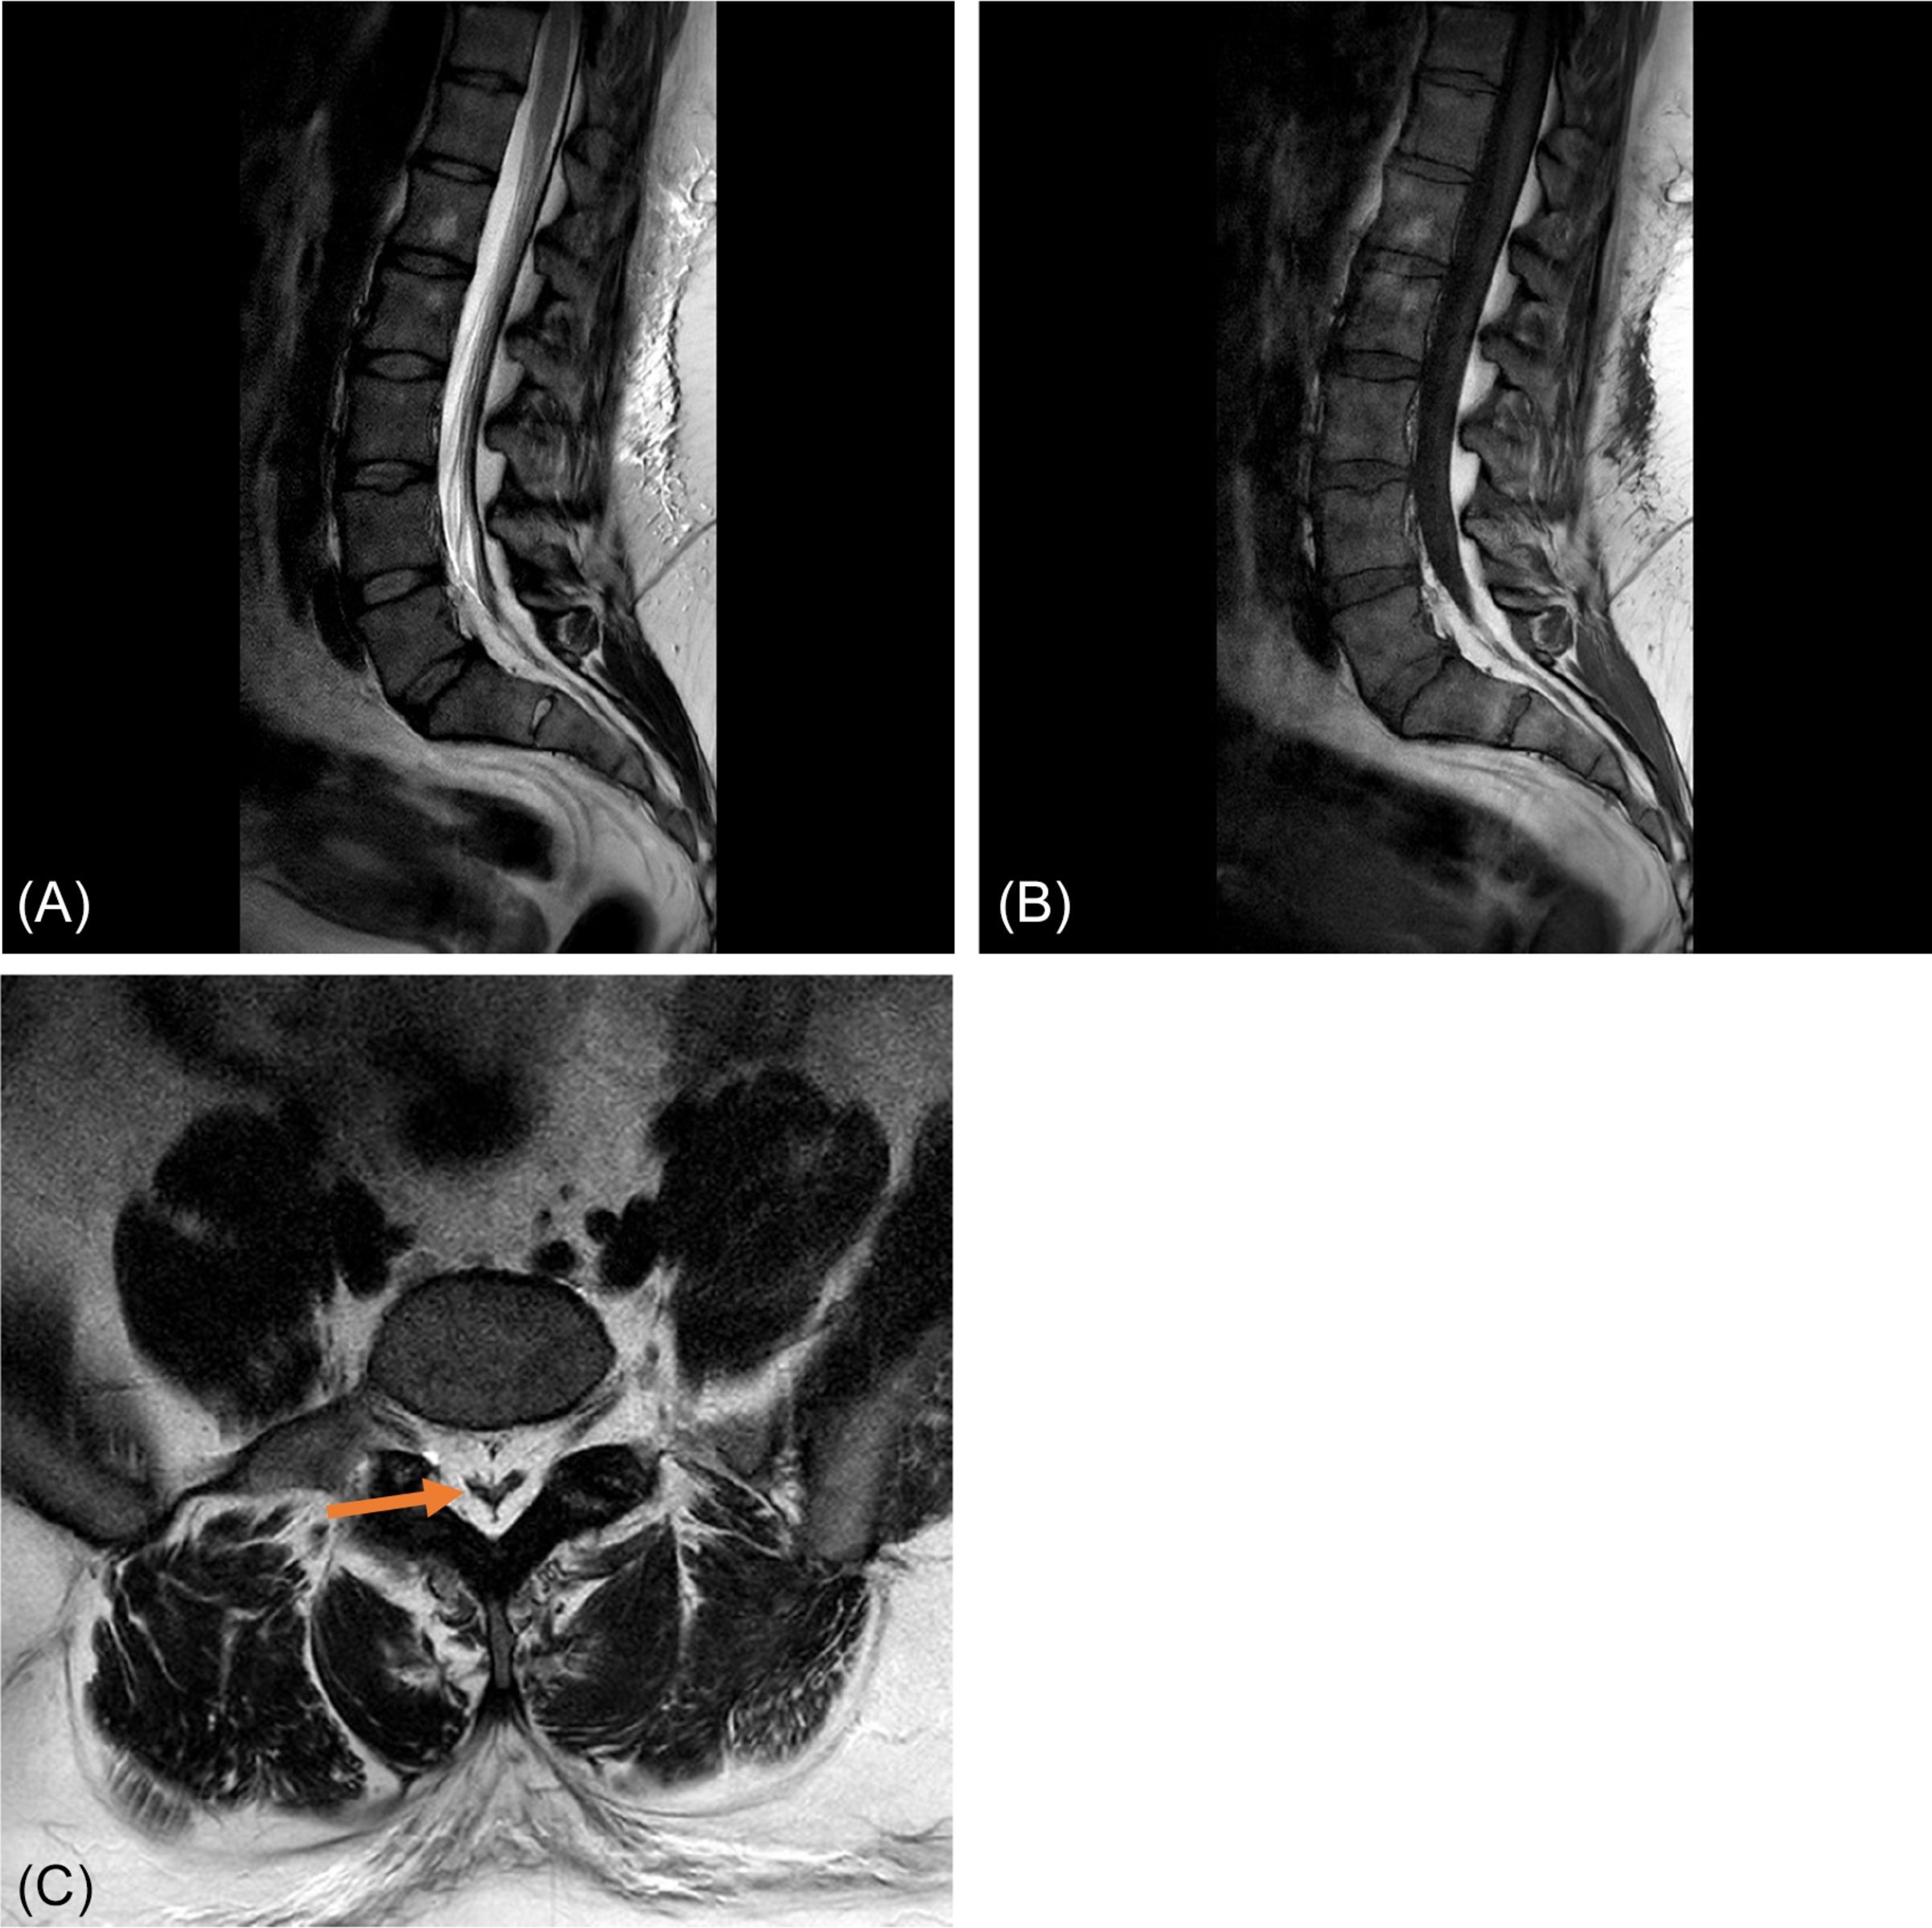
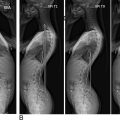
Fig. 9 shows a degenerative spinal stenosis. Note the enlargements of both facet joints in the axial plane, as well as the broadening of the ligamentum flavum and the bulging of the intervertebral disc. On the sagittal plane, the impingement of the central canal is clearly visible, the hyperintense signal of the cerebrospinal fluid is diminished, and redundant roots are visible above the level of stenosis. Furthermore, a decreased height of the intervertebral disc space is visible, which leads to infolding of the flaval ligament, sometimes incorrectly called hypertrophy. Furthermore, a noninvasive MR myelography can be helpful to assess the spinal stenosis ( Fig. 9 c). This is done by making a heavy T2-weighted image and using a fast spine echo long-TR/long-TE sequence. With this sequence, CSF signal will be very bright and bone and ligaments are no longer visible.

As stated earlier, epidural lipomatosis can be a contributing factor of spinal stenosis or the solitary cause of the stenosis. It can be due to metabolic diseases as obesity, diabetes mellitus, or alcohol abuse. It can best be visualized on T1-weighted images in both sagittal and axial planes, as it can be hard to distinguish from cerebrospinal fluid and compression of the canal can be missed. The thecal sac will form a typical Y-sign ( Fig. 10 ).
In up to 40% of the patients suffering from lumbar spinal stenosis, a phenomenon called “redundant roots” is visible on MRI ( Fig. 9 ). It includes a winding course of nerve rootlets above the level of the stenosis, which was, together with the clinical symptomatology of spinal stenosis, first described by Verbiest in 1954. Its etiology remains still unclear; however, patients who show redundant roots on MRI have poorer clinical outcome than their counterparts without redundant roots on MRI. Some findings suggest that a shortening of the lumbar spine due to degeneration is an etiological factor. In addition, a shift of the nerve roots of the cauda equina from the posterior half of the dural sac to either side on T2-weighted images is called “sedimentation sign,” which is an indicator of spinal stenosis .
Low back pain and lumbosacral MRI findings
Low back pain is an unspecific finding, and in about 95% of people with low back pain, no physical cause will be demonstrable. When indicating a patient for lumbar MRI scanning, clinical assessment is of the upmost importance to look for concordance on MRI, for example, one should distinguish inflammatory back pain, myofascial pain, and chronic back pain syndrome, each with a different presentation.
Furthermore, MRI scanning is indicated to rule out malignant causes of low back pain in patients with alarm symptoms as nocturnal back pain, progressive back pain, history of cancer, pain after pressure or percussion at the level of the spine, moderate patient condition or cachexia, severe pain in every position, pain between the shoulder blades or concomitant fever.
Inflammatory and Infectious Diseases of the Lumbar Spine on MRI
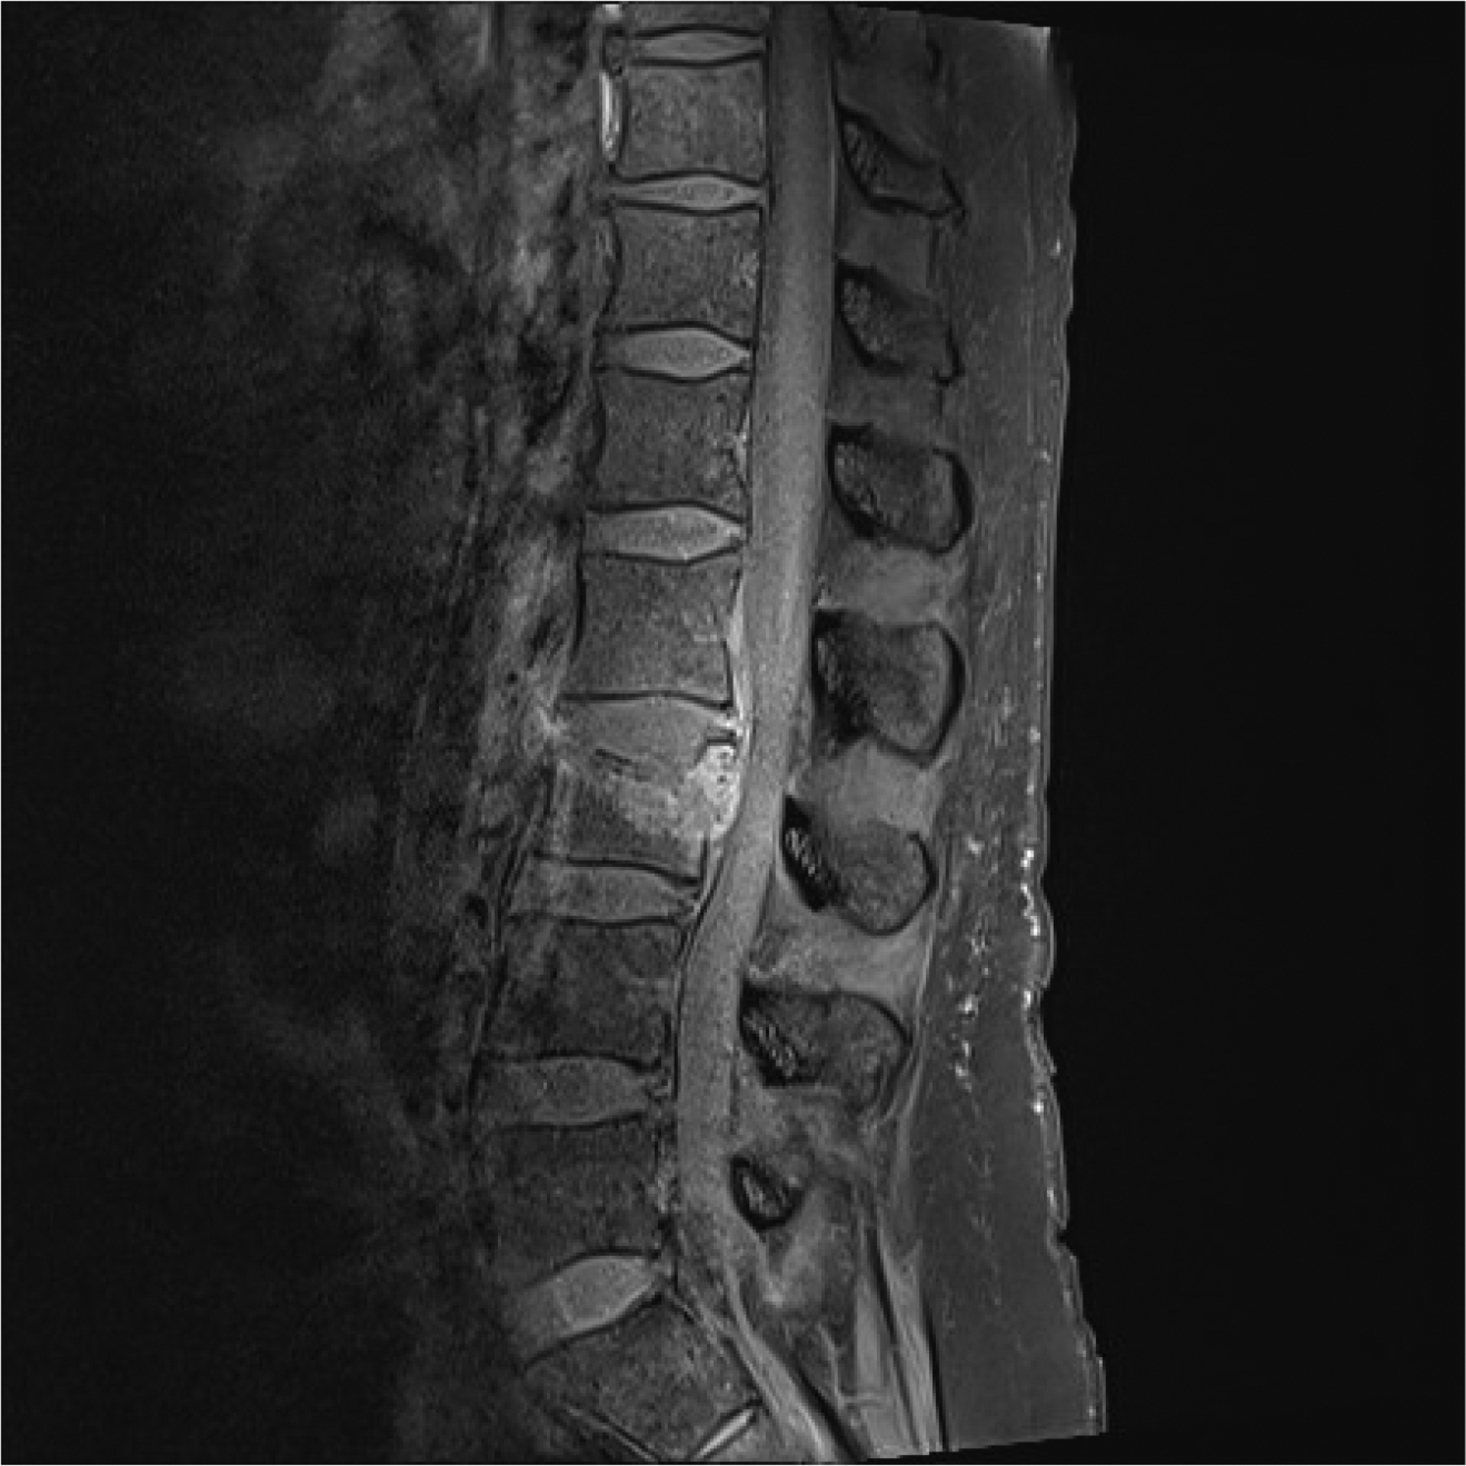
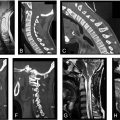
Infections of the lumbar spine may affect various different anatomical structures, including intervertebral discs, vertebral body, paraspinal tissues, epidural spaces, meninges, and intradural structures as nerve roots and the spinal cord itself. Spinal infections involving intervertebral discs and vertebral bone are most common and are therefore named spondylodiscitis. However, this term is used more widely, since, as the infection spreads into the surrounding structures, it will still be referred to as spondylodiscitis. Moreover, the invasion of soft tissue helps in the differentiation from other entities as Modic type I changes of the endplates. Risk factors for spondylodiscitis include a remote infection, prior spinal instrumentation or spinal trauma, intravenous drug use, immunosuppression, steroid use, diabetes mellitus, malnutrition, or cancer. Patients typically present with back pain together with, less frequently, associated fever. Causative bacteria usually originate from hematologic spread and come from sources such as endocarditis or IV drug use. The causative agent is mostly Staphylococcus aureus (60%), but Streptococcus viridans and gram-negative organisms, such as Enterobacter species and E. Coli , are also commonly encountered. The spinal infection with Mycobacterium tuberculosis is called Pott’s disease ( Fig. 11 ). After blood cultures and biochemical markers are obtained, MRI is the imaging modality of choice, because of its high sensitivity and specificity. Furthermore, it is more cost-effective and faster compared to alternatives such as positron emission tomography.
Related posts:
 Full-Length Spine CT and MRI in Daily Practice
 Full-Length Spine—Plain Radiographs
 Upper Cervical Spine: Computed Tomography
 Subaxial Cervical Spine Plain Radiographs
 Clinical Correlations to Specific Phenotypes and Measurements With Classification Systems
 Magnetic Resonance Imaging Techniques for the Evaluation of the Subaxial Cervical Spine
Stay updated, free articles. Join our Telegram channel

Full access? Get Clinical Tree


