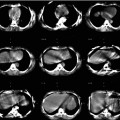
Fig. 11.1
Ventilation (V) and perfusion (Q) SPECT images in a patient with severe chronic obstructive pulmonary disease (COPD) and pulmonary emphysema. A large emphysematic bullae in the right upper lobe (e) seen on CT led to a false-positive diagnosis on V/Q scintigraphy (b and d, mismatch perfusion defects marked by arrows). The patient did not have PE. Technegas can ventilate into emphysematous bullae (a and c). In this case, the CT would have demonstrated the cause of the perfusion reduction evident on SPECT imaging and would have avoided the false-positive V/Q scan. (R right, A anterior, L left) (Reprinted with permission from Reinartz et al. [29])
11.5 Combining Functional and Anatomical Images
11.5.1 Visual and Software Fusion
Recent years have witnessed an increasing emphasis on combining the structural information provided by anatomical techniques, such as CT scanning, with the functional information provided by nuclear medicine imaging [39]. While reporting specialists have been able to visually compare different images placed side by side (the so-called visual fusion) for many years, the accuracy of such an approach is frequently limited [39, 40]. A more robust approach is to fuse SPECT or PET images with CT or MRI using sophisticated data-matching algorithms. This so-called software fusion has been used since the early 1990s with great success in many applications, such as brain imaging [39]. However, the ‘deformable’ and flexible nature of much of the body, as well as differences in the scanning bed shapes, arm positioning and breathing protocols can make accurate registration of a SPECT study and a diagnostic CT scan acquired on a separate scanner problematic [38]. Despite these limitations, our group has demonstrated the feasibility of the software fusion approach with lung scintigraphy. In a pilot study of 30 patients with suspected PE, SPECT perfusion data were fused with CTPA using commercial software which was based on an iterative approach employing an automated mutual information algorithm [38]. We demonstrated that all nine patients with positive CTPA studies performed as the initial investigation for PE had co-localised perfusion defects on the subsequent fused CTPA/SPECT images (Fig. 11.2). Of the 11 V/Q scans initially reported as intermediate probability, 27 % were able to be reinterpreted as low probability due to co-localisation of defects with parenchymal or pleural pathology. While we have demonstrated that the approach of using software fusion is technically feasible and can improve the diagnostic accuracy of the lung SPECT, it may not be practical in all centres, particularly if the required software programs or operator experience is lacking.
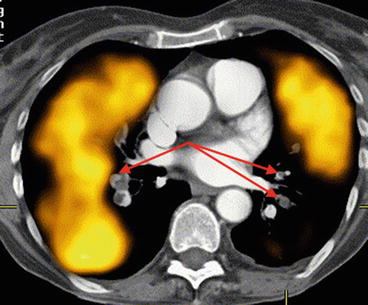
Fig. 11.2
Co-registered CTPA/perfusion SPECT (transverse slice) demonstrating extensive perfusion defects on SPECT corresponding with proximal bilateral PE shown on CTPA (arrowed) (Reprinted with permission from Roach et al. [41])
11.5.2 Hardware Fusion
With the increasing availability of integrated SPECT/CT and PET/CT scanners, ‘hardware fusion’ is now routinely employed in many areas of nuclear medicine practice [39]. As the two datasets are acquired on the same scanning bed in the same imaging session, much greater registration accuracy is seen with hybrid SPECT/CT scanners compared with software fusion techniques [39, 42–44]. At my own hospital campus in Sydney, where we have three SPECT/CT scanners, we routinely perform SPECT/CT scanning in most areas of nuclear medicine, including bone scans, gallium (infection) scans, myocardial perfusion studies as well as scans of the liver, parathyroid and adrenal glands. As well, nearly all lung scans are now done using SPECT/CT scanning. This is in addition to all of our PET scans which are performed on a hybrid PET/CT scanner.
11.6 V/Q Lung SPECT/CT
In the case of lung scanning, the emergence of hybrid SPECT/CT scanners gives reporting specialists two options to combine structural and functional data and potentially to improve overall diagnostic accuracy of the modality.
Firstly, SPECT perfusion can be co-registered with diagnostic CTPA studies. By combining the 3D scintigraphic perfusion data with a CTPA demonstrating the actual clot location, the advantages of each imaging test are realised. This may be of particular benefit if either study is inconclusive. However, as either study will be diagnostic in most patients, the value of this approach may be limited and, given the software and operator skill required, may not be feasible in many imaging centres.
Secondly, a V/Q SPECT can be performed concurrently with a ‘low dose’ CT done concurrently, or more typically sequentially, on the same scanning device. This technique is feasible in any imaging facility equipped with a SPECT/CT scanner. Several studies have shown a significant improvement in the diagnostic accuracy of the lung scan using this approach.
These two approaches are discussed in more detail below.
11.6.1 SPECT and CTPA Fusion
Co-registering the perfusion SPECT data with a diagnostic CTPA study is an approach which may be of particular value in cases of an inconclusive CTPA study. The concept of this approach is that the combined images may help to characterise the perfusion pattern seen scintigraphically in any area distal to a potential clot on the angiographic study [38] (Fig. 11.2). By combining the demonstrated very high sensitivity of perfusion SPECT with the high specificity of CTPA, an overall improved diagnostic accuracy of the combined investigation would be expected compared with either study alone. New generation hybrid devices are equipped with diagnostic multi-slice CT scanners, and hence it is possible to perform both V/Q SPECT and CTPA if required in a single imaging session. While this may not be feasible in all institutions or in all patients, it is an option with current generation scanner technology. An alternative way of fusing perfusion SPECT data with CTPA is to use commercial software programs to co-register the data which may have been acquired on different scanning devices. Such software programs can generate displays of ventilation, perfusion, lung CT, fusion images and CTPA. This approach may be of value in difficult or complex cases where a conclusive result cannot be made based on either study alone. In the case of CTPA, which is being used more frequently in many centres as the initial imaging study to evaluate suspected PE, one of the challenges faced by reporting radiologists is the increasing amount of data to review with each patient study [45]. In a study at my institution, we assessed whether the fusion of SPECT perfusion data could improve the accuracy of CTPA by guiding the attention of the reporting radiologist to the relevant pulmonary artery [46]. Of the 35 patients studied, there was an 8 % increase in the sensitivity of CTPA when fused with SPECT perfusion data. This led to a change in final diagnosis (from PE negative to PE positive) in 6 % of patients (Fig. 11.3). Provided adequate software is available to perform the fusion of perfusion SPECT and CTPA, this approach could be readily utilised in imaging departments and might potentially allow clots to be detected more accurately in difficult or inconclusive CTPA studies, thus improving the overall utility of the test. One approach might be to refer discordant SPECT V/Q and CTPA results for co-registration and consensus review with all data available. While either a CTPA or V/Q SPECT will be able to provide a diagnosis in most patients, there may be some instances where performing both studies on the same patient may be required to more confidently diagnose (or exclude) PE. This approach could be considered in patients where an accurate diagnosis is critical if either study yields an inconclusive result or is technically suboptimal.
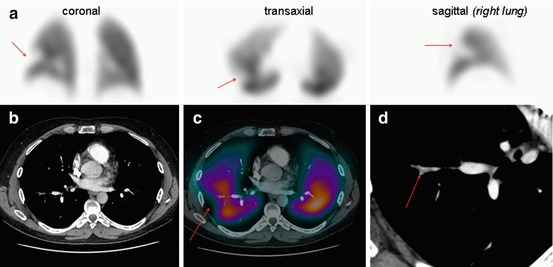
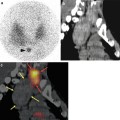
Fig. 11.3
Images of a 43-year-old male with suspected PE. Representative perfusion images of the V/Q SPECT (a) show a (mismatched) perfusion defect in the superior segment of the right lower lobe (arrowed). A CTPA (b) was reported as normal. A fused image of the CTPA and perfusion SPECT (c) was generated, and following a more targeted review by the radiologist of the vascular tree on the CTPA (d), an embolus was evident (arrowed). Fusion of SPECT and CTPA may help guide radiologists to the relevant part of the pulmonary vascular tree to review more carefully, thereby increasing the sensitivity of CTPA
11.6.2 Combined V/Q SPECT with Low-Dose CT
11.6.2.1 Overview
The second option is to perform a ‘low dose’ CT in conjunction with the V/Q SPECT study. In this case, the study is generally done without intravenous contrast and using a much lower beam current than diagnostic CT scanning. Typically, this is in the order of 20–80 mAs. This approach has the advantage of providing anatomical information, such as vascular, parenchymal and pleural abnormalities, which may explain the cause of perfusion defects seen on the V/Q SPECT scan. While V/Q SPECT has been shown to be highly sensitive, this approach may better characterise the case of any perfusion reductions, thus altering the final SPECT interpretation and improving overall specificity [47–49]. With the increasingly availability of hybrid SPECT/CT scanners, this approach can be easily performed in most nuclear medicine departments. The CT scan is typically done on the same scanning device, without the need to move the patient, usually immediately after the SPECT acquisitions have been done.
11.6.2.2 Protocols
In general, patients undergoing V/Q SPECT/CT studies have the ventilation SPECT study acquired first, followed in most cases by the perfusion SPECT and then the low-dose CT. Each of the acquisitions is detailed below.
Ventilation
For imaging ventilation, several alternatives exist. These include inert radioactive gases such as 81mKr and 133Xe, radiolabelled aerosols such as 99mTc-diethylene triamine penta-acetic acid (99mTc-DTPA) and the ultrafine carbon suspension 99mTc-Technegas [50]. Although the gases are considered to most accurately represent regional ventilation, these are typically not used due to the requirement for continuous administration during the acquisition and the high cost of the 81mKr generator [51]. Although 133Xe gas has the advantage of a longer half-life, its use is complicated by errors resulting from its recirculation due to clearance into the pulmonary circulation [52, 53]. Combined with its poor spatial resolution, it is a less than ideal agent to image ventilation [51].
Given these limitations, 99mTc-labelled particulate aerosols such as 99mTc-DTPA or the carbon-labelled nanoparticle 99mTc-Technegas are much more widely used due to their greater availability, low cost and good image quality [51]. Although the choice of agent depends on factors such as local availability and cost, both have been reported to produce SPECT ventilation scans of good diagnostic quality. The most widely available is 99mTc-DTPA, which can be used with doses of just 0.8 mCi (30 MBq) [27]. However, because of the relatively larger mean particle mass, problems may arise from central airway deposition, particularly in patients with chronic obstructive pulmonary disease (COPD) [54]. Technegas, with a smaller particle size, generally has greater alveolar penetration than 99mTc-DTPA. This results in less impaction in the central airways, with Technegas being demonstrated to have a similar distribution to that of an inert gas [55–59]. Together with its lack of lung clearance during image acquisition, Technegas is an ideal agent for ventilation SPECT. Typically, the doses of 99mTc-based imaging agents administered are identical to those used in conventional planar imaging. The EANM procedure guidelines for V/Q SPECT recommend an inhaled dose of 30 MBq Technegas [8]; however, some authors have proposed a slight increase in the administered dose in an attempt to improve image quality [29, 32]. At our institution, 13.5 mCi (500 MBq) of 99mTc is added to a Technegas generator, with the aim of delivering a dose of approximately 1.35 mCi (50 MBq) to the patient. This equates to a posterior count rate of approximately 2.0–2.5 kcps. The ventilation agent is usually administered with the patient lying supine so as to facilitate uniform distribution of activity throughout the lung fields [60]. Acquisition parameters for the ventilation study are described below in the section on “SPECT: gamma camera hardware, image acquisition and processing”.
Perfusion
As with planar imaging, 99mTc-macroaggregated albumin (99mTc-MAA) is generally used to assess perfusion [8]. The distribution of MAA, which is proportional to regional blood flow, will be reduced distal to vascular occlusions in the pulmonary arteries. Thus, it can be considered that perfusion imaging performed in this fashion has an inherent ‘amplification’ as even a small embolus can cause a large section of lung to be hypo-perfused. The dose of 99mTc-MAA used is dependent on the ventilation agent and dose used. If a radioactive gas is used, the dose of perfusion agent is typically lower than if a technetium-based ventilation agent is used. This is because the signal from the radioactive gas can be separated from that of the perfusion agent based on the energy level of the emitted photons. Additionally, in the case of 81mKr, the short half-life results in negligible gas remaining in the lungs during perfusion imaging. If a technetium-based agent is used for both ventilation and perfusion imaging, the typical approach is to ‘drown out’ the underlying ventilation signal by administering a substantially greater dose of perfusion agent. A perfusion-ventilation dose ratio of at least 3:1 is generally required [8, 60]. At my institution, the standard administered activity of 99mTc-MAA is 6 mCi (220 MBq). This results in an effective radiation dose for the combined ventilation and perfusion scan of approximately 2.5 mSv. Other authors have proposed the use of lower administered activities, including the EANM procedure guidelines for V/Q SPECT which recommend an inhaled dose of 30 MBq Technegas and 120 MBq of 99mTc-MAA [8]. It is advised that each site should review the image quality being acquired on their own local scanners and ensure that studies are optimised. The dose used by each department should be based on factors such as the collimator used, gamma camera sensitivity, processing parameters and the local radiation protection guidelines [60]. Some adjustment to acquisition times and/or administered doses may be required depending on the quality of images being generated.
In the case of pregnant patients, a dose reduction is usually implemented. This can be achieved by omitting the ventilation scan or by reducing the administered dose of both the ventilation and perfusion agents, usually by half [60]. This will necessitate a longer acquisition time so as to maintain adequate count density thereby generating images of good quality. The CT scan may also be omitted in pregnant patients to reduce breast radiation exposure.
SPECT: Gamma Camera Hardware, Image Acquisition and Processing
To perform SPECT and SPECT/CT imaging, multiheaded hybrid gamma cameras are required [50]. A typical protocol that uses a modern SPECT/CT camera requires 25–30 min of total acquisition time for a ventilation and perfusion dataset and a CT scan of the thorax. At Royal North Shore Hospital, Sydney, our acquisition protocol uses 3° radial steps over 360° with the ventilation study acquired for 12 s per projection and the perfusion study acquired for 8 s per projection [60]. Other centres have reported adequate SPECT quality in as little as 6 min [32]. Although it is possible to perform SPECT with a single-head camera, the acquisition time becomes prohibitive for standard clinical practice, and if SPECT/CT imaging is to be performed, only multi-detector SPECT/CT scanners are commercially available. When using 99mTc radionuclides, low-energy, high-resolution collimators should ideally be used. These optimise image quality, although at the expense of reduced counts compared with low-energy all-purpose collimator [60]. If a higher-energy radionuclide such as 81mKr is used for ventilation, a medium energy collimator may be required. A matrix size of 128 × 128 (or greater) is appropriate for today’s gamma cameras, although some reports have described using a 64 × 64 matrix with acceptable image quality [29, 50]. With image reconstruction, iterative techniques, such as the ordered-subset expectation-maximisation algorithm (OSEM), are increasingly replacing filtered back projection in many areas of image reconstruction in nuclear medicine [61]. These algorithms permit the inclusion of many physical aspects of the imaging process in the system model, such as attenuation, Compton scattering and resolution degradation. Consequently, they offer better control of signal-to-noise in the event that a study is low in counts [62].
For V/Q SPECT reconstruction, we use an ordered-subset expectation-maximisation algorithm (8 iterations, 4 subsets) smoothed with a post-reconstruction 3D Butterworth filter using a cut-off of 0.8 cycles/cm with an order of 9 [60]. Traditionally, corrections for photon attenuation and scatter are not routinely applied to V/Q SPECT, although they would be required for any quantitative analysis (e.g. individual lobar function, as discussed below).
CT Protocols for Use with SPECT V/Q Scans
Clinical SPECT/CT systems currently available from manufacturers typically have dual-head scintillation cameras positioned in front of the CT scanner and sharing a common imaging table. The CT scanner quality varies, and the commercial vendors have used two different approaches in recent years with their production of clinical SPECT/CT scanners. The original SPECT/CT imaging approach was to use a low-output, slow-acquisition CT scanner. The Infinia Hawkeye (General Electric Healthcare Systems, Milwaulkee, WI) was the first SPECT/CT scanner marketed commercially. Its current iteration comprises a CT scanner consisting of a low-output X-ray tube (2.5 mA) and four linear arrays of detectors which can simultaneously acquire four 5-mm anatomic slices in 13.6 s with a spatial resolution of greater than 3 LP/cm. The slow scan speed (up to 4 min) can be an advantage in regions where there is physiologic motion because the CT image blurring from the motion is comparable to that of the emission scans, resulting in a good match in fused images. This is particularly relevant in lung SPECT/CT where ventilation and perfusion SPECT is acquired during normal tidal breathing [63].
The second approach, which has evolved more recently, has been the development of newer generation hybrid SPECT/CT systems which incorporate diagnostic helical (multi-slice) CT scanners combined with dual-head scintillation cameras. Each of the major commercial equipment vendors now market these devices. Various configurations are available, with the number of slices ranging from 1 to 64, the ability to utilise variable tube currents (20–500 mAs), slice thicknesses (0.6–12 mm) and rotation speeds of 0.5–1.5 s [63]. These systems exhibit high contrast spatial resolution with approximately four to five times the patient radiation dose of that from the Infinia Hawkeye system. However, these systems can be used for diagnostic quality CT as well as for attenuation correction and anatomical localisation using low-dose parameters [64]. Given these advantages, these systems now account for most of the SPECT/CT scanners sold commercially today.
While breath holding is typically employed for diagnostic CT studies, this is not feasible during V/Q SPECT acquisitions, which typically take up to 15 min for each of the ventilation and perfusion scans. Hence, respiratory motion misregistration is a potential problem, and the ideal breathing protocol used for CT in V/Q SPECT/CT should ensure that the position of the diaphragm on the SPECT scans matches as closely as possible that of the CT images. To reduce misregistration between the SPECT and CT data as much as possible, it has been recommended that CT scans should be acquired during breath holding at mid-inspiration volume, or with the patient continuing shallow breathing during the CT acquisition [65].
The CT scan is typically acquired either between, or after, the two SPECT study acquisitions. The same principles of maintaining identical patient positioning throughout the study applies. It is preferable that the CT scan is not acquired prior to ventilation SPECT as the patient may move significantly during the ventilation procedure thus introducing misregistration artefact when co-registering the SPECT and CT data [63]. Acquisition parameters will vary between manufacturers and CT design.
Image Display and Reviewing
After co-registration of the ventilation, perfusion and CT datasets, the data are best viewed simultaneously in transverse, coronal and sagittal planes on a workstation. Each of the commercial vendors marketing SPECT/CT scanners provide software which can display SPECT/CT images across the range of typical clinical studies performed. There are also third-party solutions available, independent of the commercial SPECT/CT manufacturers. The software programs vary with some allowing for one dataset to be manually aligned with the others, whereas others allow for automatic registration of the studies to each other [66]. As noted above, image registration is best facilitated by reducing, or preferably eliminating, any patient motion between the ventilation SPECT, perfusion SPECT and low-dose CT studies. However, if significant patient motion has occurred between any of the three datasets, some image manipulation and adjustment will be required.
Although images can be printed to film, given the amount of data to be considered, SPECT/CT data are generally best reviewed directly on a workstation. This allows the reporter to interactively examine the linked ventilation and perfusion SPECT studies as well as the CT in each of the three orthogonal imaging planes and to adjust the relative image intensities, especially of fused images. The ability to triangulate defects should be an essential component of any software used to review and report V/Q SPECT/CT studies. Review of images on a workstation also facilitates the viewing of CT data in different windows so that the lungs, soft tissue and bones can all be reviewed as appropriate. An example of a typical V/Q SPECT/CT displays in a patient with PE is shown in Fig. 11.4.
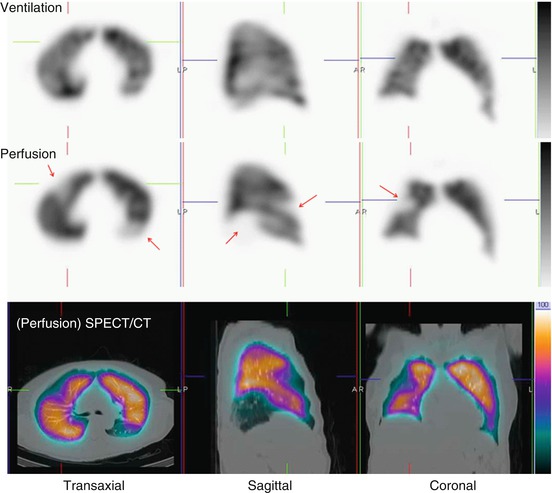
Fig. 11.4
Representative ventilation, perfusion and fused SPECT/CT images in a patient with multiple PE. Several mismatched defects are evident (arrowed). There are no underlying structural abnormalities on the CT to account for the perfusion reductions
In addition to tomographic display of V/Q SPECT images, further data processing can also be performed. In the case in which 99mTc is used for both ventilation and perfusion imaging, perfusion data can be corrected for the background activity of the preceding ventilation scan using image subtraction of co-registered datasets [27, 67]. Although this ventilation subtraction enhances perfusion defect contrast, it is not currently in routine use. The use of SPECT also facilitates novel ways of displaying V:Q quotient data to assist image reporting. Palmer and co-workers have described a technique where these images can be presented as either 3D surface-shaded images or as tomographic sections in each of the orthogonal planes [67]. These so-called quotient images can be helpful in facilitating image reporting and are a useful way of demonstrating the location and extent of mismatched defects. Figure 11.5 shows an example of an abnormal SPECT study and corresponding selected V:Q quotient images in a patient with multiple PE. SPECT imaging facilitates other novel ways of interpreting image data, such as objective analysis by examining the pixel-based V:Q ratio. Our group has described such an approach, and while not routinely available in commercial processing and display programs, such techniques have the potential to decrease the number of non-diagnostic or indeterminate scans [68, 69].
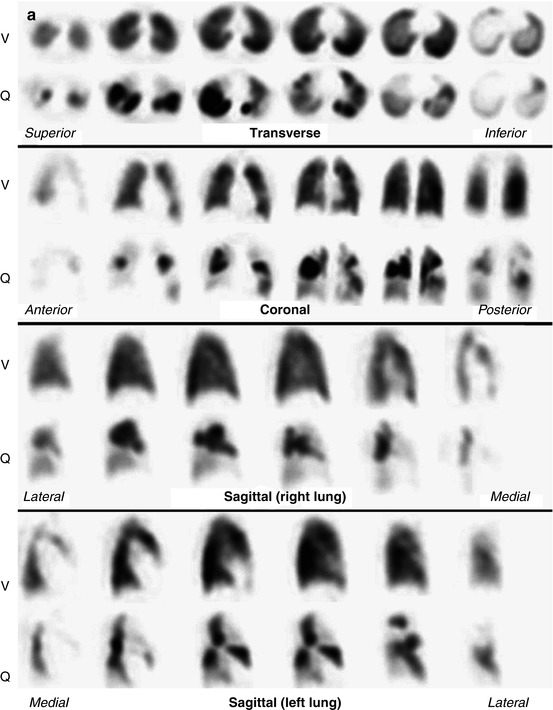
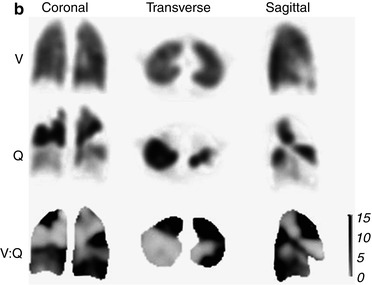
Fig. 11.5
(a) Example of a patient with multiple bilateral PE. Ventilation (V) and perfusion (Q) images are aligned and displayed in transverse, coronal and sagittal planes. Multiple perfusion defects in areas with normal ventilation can be seen. (b) Representative coronal, transverse and sagittal ventilation (V), perfusion (Q) and V:Q quotient images from the patient shown in (a). Areas of pulmonary embolism correspond to dark areas on the V:Q quotient images, indicating a high V:Q ratio value (Reprinted with permission from Roach et al. [50])
While there are several ways that V/Q SPECT studies can be reported, most reporting specialists would use the EANM reporting guidelines for V/Q SPECT. Originally published in 2009, these guidelines recommend that studies are reported as positive for PE if there is V/Q mismatch of at least one segment or two subsegments that conforms to the pulmonary vascular anatomy [8]. These guidelines recommend that the study is considered negative for PE if there is either a normal perfusion pattern conforming to the anatomic boundaries of the lungs; matched or reversed mismatch V/Q defects of any size, shape or number in the absence of mismatch; or mismatch that does not have a lobar, segmental or subsegmental pattern. Studies are considered to be non-diagnostic for PE if there are multiple V/Q abnormalities not typical of specific diseases. While these guidelines do not specifically address V/Q SPECT/CT, the addition of the CT component is likely to help classify the V/Q SPECT pattern more appropriately, particularly given the information that the CT provides on the anatomy of each individual patient, particularly in relation to the borders of the lungs and segments, the location of the fissures and major vessels and the presence of any associated parenchymal disease. At my institution, we pay particular note of the location of the fissures, as a reduction in perfusion (and to a lesser degree ventilation) corresponding with the fissures is often noted on SPECT imaging. This seems most evident in the posterior aspects of the oblique fissures and is more noticeable on perfusion than ventilation SPECT images. We hypothesise that this is due to fact that alveoli predominate at the pleural surface and there is a relative paucity of pulmonary vessels, with the pleura supplied by the bronchial circulation. Therefore, when SPECT imaging is performed, there is good distribution of Technegas (which has good peripheral penetration), whereas relatively little 99mTc MAA accumulates. We consider any linear perfusion reduction seen on SPECT corresponding to the fissures to be artefactual (Fig. 11.6).
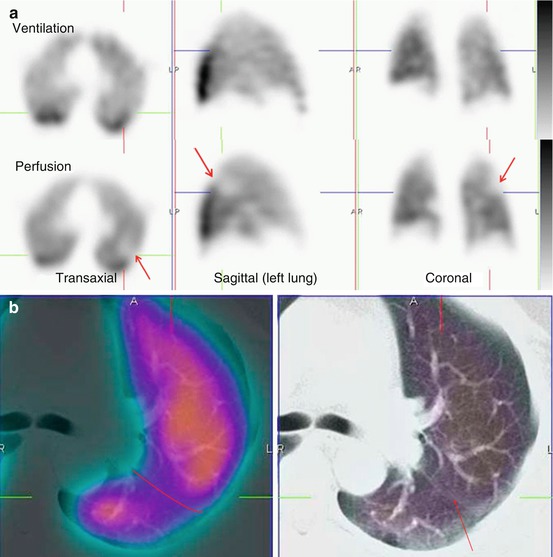
Fig. 11.6
(a) Representative ventilation and perfusion SPECT images in a patient with suspected PE show a linear mismatch in the left upper/mid-zone (arrowed). This is non-segmental in appearance. (b) Fused perfusion SPECT/CT (left) and the (unfused) CT (right) of the left lung show the perfusion reduction to correspond with the oblique fissure (marked and arrowed in red). SPECT/CT helps to characterise the cause of SPECT perfusion defects, thereby increasing the specificity of V/Q scintigraphy. EANM reporting guidelines for V/Q SPECT recommend that studies are reported as positive for PE if there is V/Q mismatch of at least one segment or two subsegments provided that it conforms to the pulmonary vascular anatomy. In this case, the defect does not conform to pulmonary vascular anatomy
While other reporting schema have been proposed for V/Q SPECT, it is certainly recommended that the probabilistic reporting used for many years with planar scintigraphy should not be used for V/Q SPECT/CT [29, 70]. Given the typical binary reporting approach to CTPA reporting, it is important that definitive reports be given for V/Q SPECT (and V/Q SPECT/CT) whenever possible so as to keep the test relevant as a primary screening test for patients with suspected PE.
11.7 Clinical Value of V/Q SPECT/CT
Several studies have shown that combined SPECT/CT lung scanning improves specificity and overall diagnostic accuracy of lung scintigraphy.
In a preliminary study from my own institution, we performed ventilation (using Technegas) and perfusion SPECT studies as well as a low-dose (30–50 mAs) CT scan in 48 patients with suspected PE [71]. In this series, 16 patients were considered to have had PE based on clinical and imaging findings and follow-up, and of these, 15 patients (94 %) had a positive V/Q SPECT scan. Of the remaining 32 patients without PE, 6 (19 %) had false-positive V/Q SPECT scans; however, 3 of these patients (50 %) were correctly reclassified as PE negative when the SPECT/CT scan was viewed. Hence the addition of a low-dose CT to V/Q SPECT improved the diagnostic accuracy of lung scintigraphy by reducing false-positive scan results by 50 % in this pilot study. In particular, it was noted that low-dose CT could characterise physiological features such as pulmonary vessels and fissures, as well as pathological features such as consolidation and emphysema that can result in defects on perfusion scintigraphy.
More recently, the improvement in diagnostic accuracy by combining V/Q SPECT with low-dose CT has been confirmed in a prospective study by a group from Copenhagen, Denmark [31]. In this series of 81 consecutive patients, 81mKr gas was used as the ventilation agent, and the final diagnosis was based on a composite reference standard comprising ECG, lower limb ultrasound, d-dimer result and 6 months of clinical follow-up. They found that the sensitivities of V/Q SPECT alone and V/Q SPECT combined with low-dose CT were identical at 97 %. However, the addition of low-dose CT imaging increased the specificity of SPECT scintigraphy from 88 to 100 %. The addition of anatomical data demonstrated that mismatched perfusion defects could be attributed to structures such as fissures as well as pathological conditions such as emphysema, pneumonia, atelectasis and pleural fluid. The inconclusive rate for V/Q SPECT alone was only 5 % (four patients); however, this fell to zero when SPECT was combined with low-dose CT imaging. These are impressive results, and while yet to be replicated in large prospective multicentre studies, they do indicate that the combination of V/Q SPECT can yield very high sensitivity, specificity and overall accuracy in the diagnosis of PE.
These studies have also shown that concurrent low-dose CT is feasible to do in most Nuclear Medicine departments today, is well tolerated by patients (even those that were critically ill) and adds little overall imaging time to the acquisition (typically less than 1–2 min).
Some case examples from my institution showing the value of hybrid SPECT/CT imaging are shown in Figs. 11.7 and 11.8.
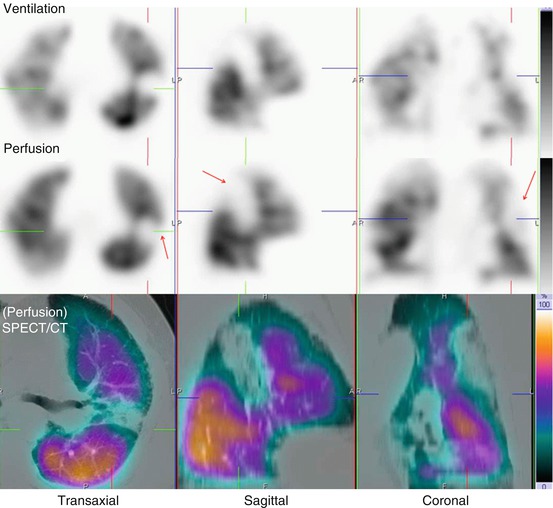
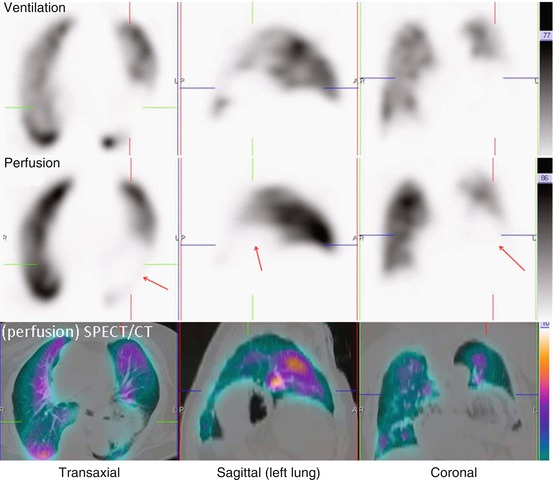
Fig. 11.7
Representative ventilation, perfusion and SPECT/CT images in an 84-year-old male with dyspnea. A large matched defect is evident on SPECT in the left upper and mid-zone (arrowed). This corresponds with extensive consolidation demonstrated on the SPECT/CT images. This is seen to lie anterior to the oblique fissure
Fig. 11.8
Representative ventilation, perfusion and SPECT/CT images in a 63-year-old male with chest pain. A large matched defect is evident on SPECT in the left lower zone (arrowed). This corresponds with a large hiatus hernia on the SPECT/CT images
11.8 Is the Ventilation Scan Necessary?
Given that fused CT and perfusion SPECT can be readily performed, the need for a ventilation study may be questioned as the information from the CT may be adequate on its own to provide information on structural or airways abnormalities (CTPA + Q study). Several studies have assessed whether a CT scan can replace the need for a scintigraphic ventilation scan in patients with suspected PE. In a study of 30 patients from my own department, we found that 87 % of the 96 mismatched perfusion defects seen on V/Q SPECT occurred in areas where there was no underlying parenchymal abnormality detected on CTPA to account for the perfusion reduction [72]. In the remaining 13 % of mismatched V/Q defects, CTPA revealed corresponding parenchymal abnormalities, mostly subsegmental atelectasis, which correlated with the areas of perfusion reduction on the SPECT study. Of note, the extent of the parenchymal abnormality on CT in these mismatched V/Q defects was significantly smaller than the extent of perfusion reduction. Twelve mismatched perfusion defects on CTPA/Q were identified as false positives with matched defects evident on the V/Q images. These defects were seen in two asthmatic patients, presumably related to air trapping which has a similar CT appearance to hypo-attenuation from hypo-perfused lung distal to PE.
In the Danish study described above, results were also reported for the use of perfusion SPECT alone (i.e. ventilation omitted) combined with low-dose CT [31]. In this series, the sensitivity of this approach was high (93 %), but the specificity fell to only 51 % with the accuracy reported at 68 %. In addition to the high false-positive rate, there was also a high non-diagnostic rate using this approach (17 %).
Thus, while the literature remains limited, it does appear that omitting the ventilation component of the SPECT study will compromise accuracy, and, in particular, the specificity of V/Q SPECT scintigraphy, by producing a higher false-positive rate.
11.9 How Does V/Q SPECT/CT Compare with CTPA?
Multi-detector CTPA has evolved to the point where it is frequently used as the primary imaging investigation in patients with potential PE [4, 22]. This is certainly the case in the United States where it has supplanted the V/Q scan as the initial imaging test for the assessment of PE in many centres. It is therefore of concern that recent literature suggests that although it is highly specific, its sensitivity is less than desirable [73]. With the multi-detector CT scanners used in the large PIOPED II study, CTPA had a reported sensitivity of 83 %, indicating that emboli were missed in one of every six patients [73]. Although the accuracy of CTPA appears to be high in cases in which the scan result is in keeping with the pretest clinical suspicion, this is not true of cases in which there is discordance between scan results and clinical likelihood.
CTPA, because of its anatomical nature, has an advantage of potentially diagnosing other pathologies, such as pneumonia or aortic dissection. However, this is at the expense of exposing the patient to increased radiation (something that is particularly concerning in the case of young women) and to the potential risks of contrast administration, such as allergy or nephrotoxicity [74, 75]. V/Q SPECT has been shown to be better able to quantify the extent of perfusion abnormalities (which may be valuable in guiding treatment decisions) and can assess reperfusion after PE, something not easily done with CTPA [70].
Overall, there is relatively little literature directly comparing SPECT V/Q and CTPA. In 2004, Reinartz and co-workers compared the performance of V/Q SPECT (using Technegas) with multi-detector (4-slice) CTPA [29]. In their series of 83 patients, they determined that SPECT was more sensitive (97 % versus 86 %) but less specific (91 % versus 98 %) than CTPA. Both modalities had comparable overall accuracy (94 % versus 93 %). In another series from Australia, Miles and co-workers prospectively compared V/Q SPECT with CTPA performed using a 16-slice scanner in 100 patients with suspected PE [76]. They also concluded that the overall accuracy of both examinations was comparable, suggesting that SPECT V/Q and CTPA could be used interchangeably. They concluded that SPECT V/Q has potential advantages over CTPA in that it was feasible to perform in more patients and had fewer contraindications, a lower patient radiation dose and fewer non-diagnostic findings. This study supports the notion that each of these studies has its advantages over the other. In the case of V/Q SPECT, its advantage is a high sensitivity, whereas CTPA has the advantage of a high specificity. Given that the literature directly comparing V/Q SPECT (and V/Q SPECT/CT) is limited, it would be desirable to perform a prospective multicentre trial to answer the question. However, this would be difficult for several reasons [70]. Firstly, evaluating the clinical effectiveness of rapidly evolving health technologies is problematic. In this case, both CT and V/Q SPECT technology continue to develop, and therefore, any published direct comparison inevitably reports on previous-generation technology. Secondly, a robust ‘gold standard’ is lacking for the diagnosis of PE resulting in the V/Q scan and/or CTPA being pivotal in determining the presence or absence of disease [27, 36]. Thirdly, ethics committees may, quite correctly, question the need to subject individuals to the radiation exposure from both V/Q SPECT and CTPA, especially in individuals without PE. Lastly, the time interval between the two studies being performed could result in embolus fragmentation, movement or lysis, thus affecting the perceived accuracy of each modality.
As stated above, the challenge for the V/Q scan is that ventilation/perfusion mismatch is not specific for PE, and in some cases of PE (e.g. in the case of pulmonary infarction), matched patterns can occur. For this reason, the anatomical information provided by a chest X-ray has been considered essential in the interpretation of V/Q scans. With the advent of SPECT/CT scanners, the integration of anatomical information from the CT with the functional information from SPECT is now feasible and should increase the specificity of V/Q scanning. Other than PE, V/Q mismatch can be seen with conditions such as radiation therapy-induced changes and extrinsic vascular compression from conditions such as neoplasm and mediastinal adenopathy [8, 33]. Each of these can be detected with low-dose CT. Furthermore, matched changes can be seen with non-embolic aetiologies such as pneumonia, abscess, pleural or pericardial effusions, malignancy and pulmonary infarction [5, 6, 36, 37]. Once again, each of these should be evident if a CT, even if done at a ‘low’ diagnostic dose, is performed.
In the Danish study of V/Q SPECT/CT mentioned earlier, the authors directly compared the accuracy of current generation CTPA with V/Q SPECT/CT [31]. They found that SPECT and SPECT/CT both had higher sensitivity for the detection of PE than CTPA (done on the same hybrid machine equipped with a 16 slice CT scanner). Although CTPA had a specificity of 100 %, its sensitivity was only 68 %. The superior sensitivity of V/Q SPECT compared with CTPA has been demonstrated in other studies and raised questions about the use of CTPA as the primary imaging study for the detection of PE in clinical practice. The sensitivity of CTPA in this study is lower than the 83 % noted in the large multicentre PIOPED II study, a figure that led the investigators of that study to conclude that additional information would be required to exclude PE due to the significant false-negative rate of CTPA [73].
Related posts:

Stay updated, free articles. Join our Telegram channel

Full access? Get Clinical Tree


