5
Magnetic Resonance and Computed Tomographic Angiography
The choice of an imaging modality for patients with vascular disease is no longer straightforward. Conventional angiography has benefited greatly from the development of safer contrast agents, sophisticated catheters and guidewires, and digitally enhanced image acquisition. Innovations in cross-sectional imaging technology, however, have resulted in a number of less invasive vascular imaging modalities. It is now conceivable that in a single institution the following menu could exist for vascular imaging: filmscreen angiography, intraarterial digital subtraction angiography (IADSA), intravenous DSA (IVDSA), magnetic resonance angiography (MRA), computed tomographic angiography (CTA), duplex and color-flow ultrasound, contrast enhanced ultrasound, transesophageal/transluminal ultrasound, three-dimensional ultrasound, intravascular ultrasound, and isotope angiography. How does one choose the correct test, or is there such a thing? This chapter focuses on two of these modalities: CTA and MRA and when each should be used.
The ideal vascular imaging modality would be rapid, accurate, painless, risk free, applicable to all patients, easy to interpret, and inexpensive. Because of its proven accuracy and wide acceptance by clinicians, traditional angiography is the standard against which all new modalities must be compared. Traditional angiography provides reliable diagnostic images and is applicable to large numbers of patients, but it is associated with some degree of discomfort and risk.1 MRA and CTA hold promise as noninvasive imaging modalities that can provide accurate angiographic information quickly in large numbers of patients. Both modalities have different strengths and weaknesses, which in many cases are complementary.2 The clinical evaluation and application of MRA and CTA are ongoing, yet there is no doubt that these techniques will have important roles in vascular imaging in the future.
 Basic Techniques
MR imaging/MRA
Principles of MR imaging
One need only understand that MR imaging (MRI) is based on the detection of radiofrequency signals emitted by protons spinning within a powerful magnetic field. In the bore of an MR scanner, protons in tissue preferentially align the axes of their spins with the magnetic field (longitudinal magnetization). By applying a radiofrequency pulse to the protons, the spins can be deflected momentarily, or “tipped,” out of alignment with the magnetic field, in a plane perpendicular to the magnetic field (transverse magnetization). The degree of deflection is determined by characteristics of the radiofrequency pulse and is described as the flip angle. As the protons realign with the magnetic field (relaxation), a signal (echo) is created. Images are created that emphasize the vectors of the longitudinal (T1) or transverse (T2) relaxation of the spins as they realign. In general, short echo times reflect the longitudinal magnetization (T1 weighted), and long echo times the transverse magnetization (T2 weighted). By varying how often and how forcefully the protons are tipped, as well as when the echo is sampled, the same tissue may appear alternatively bright or dark. The complex behavior of protons in magnetic fields provides the basis for the wide variety of pulse sequences and imaging strategies available in MRI.
MRI technology
Most first-generation of MR scanners were constructed using a central tunnel or bore lined with coiled superconducting wires. Generally, the higher the field strength (measured in Tesla [T], and ranging from 0.3 to 1.5 T for most clinical scanners), the larger the actual scanner and the higher the signal-to-noise ratio in the images. Although these scanners remain in active clinical use, newer “open” magnet designs are becoming available. These scanners offer the practical advantages of accommodating larger patients than the older devices as well as presenting a less confined scanning environment to claustrophobic patients. Of great interest to vascular and interventional radiologists is the possibility of performing MR-guided procedures in magnets with open designs that permit access to the patient during scan acquisition. Sophisticated targeting and device tracking technology is required in this environment, and special equipment construction is necessary for working within the strong magnetic field. Nevertheless, this technology offers great promise, particularly in patients in whom pathologic processes can be imaged only by using MRI.3
Principles of MRA
One of the most common non-contrast enhanced applications of MRI in vascular and interventional radiology is MRA. Early in the clinical application of MRI, it was noted that flowing blood sometimes appeared bright on images of the brain and body. The brightness of the blood suggested that angiographic information could be obtained without catheterization and injection of iodinated contrast agents. In a landmark article in Science in 1985, Wedeen and co-workers published the first true angiographic images created using MR techniques.4 The initial clinical applications of MRA were in the intracranial arterial circulation and the extracranial carotid arteries. Now MRA is performed in all areas of the body, with the most common nonneurological applications being lower-extremity arteries and veins, the abdominal aorta, the renal arteries, the portal veins, and the thoracic aorta.5–14
The two most common MRA techniques are time-of-flight (TOF) and phase-contrast (PC) MRA. Both techniques can be used to acquire data on a slice-by-slice basis [two-dimensional (2-D)] or as a volume acquisition [three-dimensional (3-D)]. In general, thinner images can be obtained using 3-D techniques, but signal-to-noise is better in 2-D images. Acquisitions also may be cardiac gated, so that images are obtained at the same level throughout the cardiac cycle or at different levels at the same point in the cardiac cycle. Images obtained at one level throughout the cardiac cycle can be displayed in a movie loop (cine), which is useful in situations such as evaluting cardiac valvular competence. Gating to obtain images at multiple levels at the same point in the cardiac cycle minimizes pulsatility artifact and signal loss in multiphasic flow.
TOF/MRA
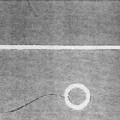
The most widely available MRA technique for body applications is TOF MRA. With this technique, stationary tissues are subjected to multiple and frequent radiofrequency pulses; so the spins do not have time to realign (relax) with the magnetic field, resulting in saturation of the tissues and only a weak signal. Blood that flows into the area being imaged contains spins that have not yet been subjected to the radiofrequency pulses. These fresh, or unsaturated, spins emit a strong signal when they first enter the area being imaged and thus appear bright (Fig. 5-1). If the blood is exposed to the radiofrequency pulses for any length of time, however, it will become saturated and indistinguishable from the surrounding stationary tissues. This problem is particularly troublesome when using 3-D or volume imaging or when vessels are in the plane of a 2-D slice (Fig. 5-2).
Flow from all directions into a slice or volume will be visualized during MRA unless measures are taken to select flow in the direction of interest. With TOF MRA this visualization usually can be accomplished by saturating the spins in unwanted blood with radiofrequency pulses before they enter the area being imaged. These radiofrequency pulses are applied in a broad presaturation slab positioned outside the area of interest (Fig. 5-3). For example, with 2-D TOF MRA of the lower extremity arteries, source images are acquired in the axial plane; to eliminate signal from the veins, a presaturation slab is placed inferior to the slice of interest (i.e., toward the feet), thus saturating spins in the venous blood before they flow into the slice. To obtain a 2-D TOF MR venogram of the lower extremities, the presaturation slab is repositioned superior (i.e., toward the head) to the slice of interest to saturate the spins in the arterial blood before they flow into the slice. Care must be taken when imaging tortuous vessels, however, as they may loop into the presaturation slab and appear occluded on the MRA.
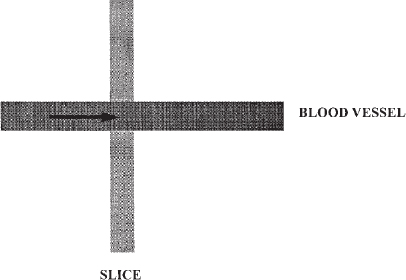
FIGURE 5-1. Schematic diagram of time-of-flight magnetic resonance angiography. Signal from background tissues is suppressed by repetitive radiofrequency pulses. Signal is emitted from the fresh spins in blood as it enters the imaging volume or slice.
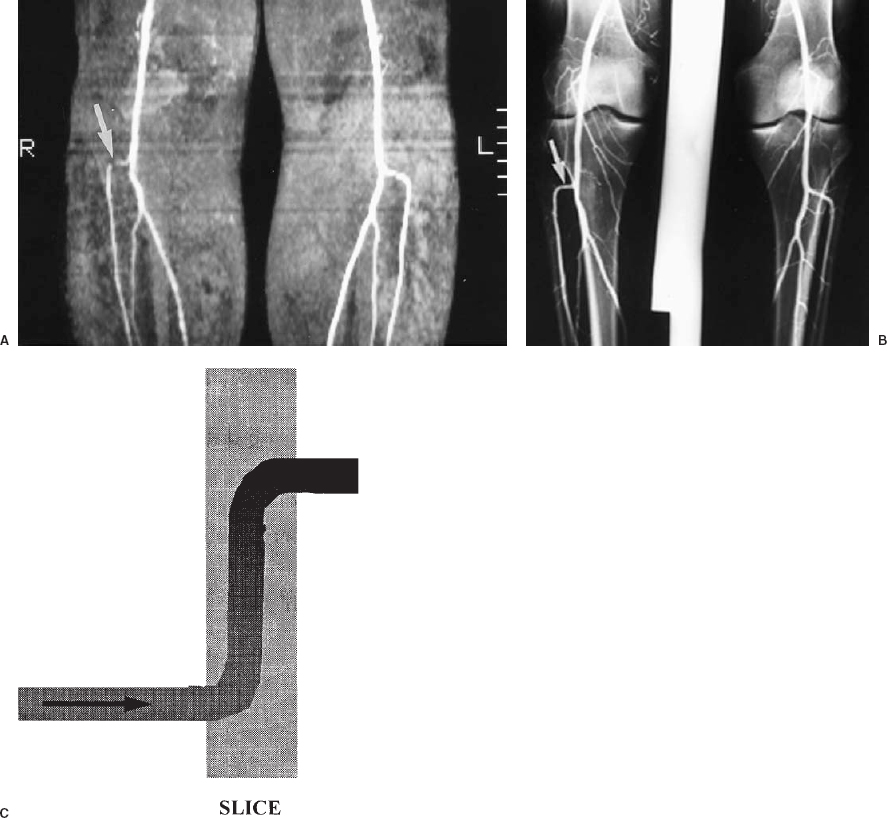
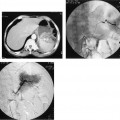
FIGURE 5-2. Saturation of signal from in-plane flow. A: Coronal maximum intensity projection of a two-dimensional time-of-flight magnetic resonance angiogram of the popliteal arteries and proximal tibial arteries. The source images were acquired in the axial plane. There is loss of signal in the horizontal (in-plane) portion of the right anterior tibial artery origin (arro w), which could be due to either a stenosis or artifactual signal loss. B: Conventional angiogram of the same patient shows that this artery is normal (arrow). C: Schematic diagram illustrating saturation of in-plane flow.
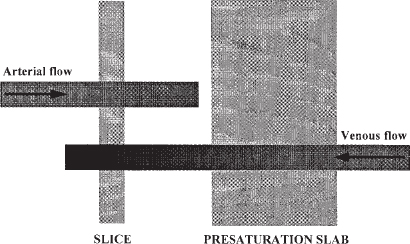
FIGURE 5-3. Saturation slabs are critical in time-of-flight imaging to eliminate unwanted signal from flowing blood. In this schematic, arterial blood entering the slice from the left contains fresh spins that can be imaged. The spins in venous blood are saturated when they pass through a saturation slab outside of the imaging slice, so that no signal is emitted when they enter the slice.
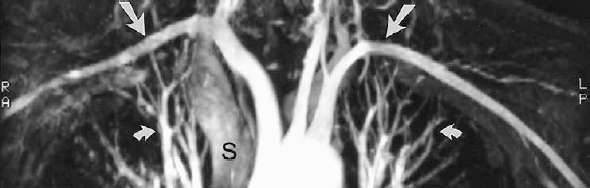
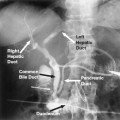
FIGURE 5-4. Gadolinium-enhanced, three-dimensional magnetic resonance angiogram of a normal aortic arch. Note that the subclavian artery flow (arrows), which reverses direction within the imaging volume, does not become saturated, and retains excellent signal because of the gadolinium. The pulmonary arteries and veins (curved arrows) are visible within the chest. The superior vena cava (S) is faintly seen as a result of rapid shunting of gadolinium through the cerebral circulation and enhancement of the jugular veins and subsequently the superior vena cava.
Flowing blood produces the brightest signal when the spins all move at the same velocity, in the same direction, and perpendicular to the plane of image acquisition. Unfortunately, blood flow is complex in vivo as a result of such diverse factors as shear along the vessel wall; changes in velocity and acceleration resulting from cardiac activity, elastic recoil of arterial walls, and stenoses; and turbulence caused by tortuosity of blood vessels, aneurysms, or stenoses. Each of these factors results in some loss of signal from blood with all MRA techniques. Strategies to reduce this signal loss include techniques such as flow compensation and cardiac gating, but all incur a time penalty.
Gadolinium-enhanced MRA
One of the most effective strategies to increase intravascular signal with TOF sequences is the addition of an MR contrast agent, such as gadolinium, as described by Prince.15 This agent has been applied most successfully to 3-D acquisitions, although it can be used with 2-D imaging as well. Gadolinium-based contrast agents act to shorten the T1 of blood and tissues. In conventional MRI, a dose of 0.1 mmol/kg (0.2 mL/kg) is administered intravenously before the patient is placed in the scanner to evaluate the soft tissues. For vascular imaging, a relatively large volume of gadolinium contrast (up to 0.4 mmol/kg,or 0.8 mL/kg) is injected rapidly during the acquisition of a 3-D volume. The arteries are preferentially enhanced, much in the same fashion that arteries are visualized during rapid venous injection of iodinated contrast agents with IVDSA. This technique eliminates loss of signal resulting from slow, turbulent, or in-plane flow.15 Large fields of view can be covered without signal loss in blood that remains within the imaging volume (Fig. 5-4). This technique has become widely used in body MRA.
PC MRA
PC MRA is both more complex and less widely available than TOF sequences because the demands on scanner hardware, particularly gradient coils, are greater with PC than with TOF MRA. The fundamental principles of PC MRA are that gradients vary in strength within the magnetic field, and the phase of a spin will vary in proportion to the strength and duration of an applied magnetic gradient (Fig. 5-5). If equal and opposite gradients are applied, a spin that remains stationary will deflect in an equal and opposite manner. When the vectors of these opposite and equal deflections are subtracted, the net value (or phase shift) is zero. When a moving spin is exposed to the same equal and opposite gradients, the spinning proton moves to a physically different place within the magnet during the time between application of the gradients. The strength of the gradients varies depending on their location within the magnetic field. As a result, the vectors of the deflections caused by the gradients are opposite but not equal. Subtraction of these two opposite but unequal vectors results in a measurable net phase shift, which then can be displayed as signal, whereas stationary background tissues with a net phase shift of “0” have no signal. The larger the phase shift (the greater the distance that the spin moves or the larger the applied gradient), the stronger the signal. PC MRA is by definition a purely subtractive technique in that only moving spins will be visualized, with no need to saturate background tissues as in TOF techniques.
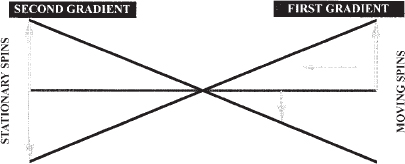
FIGURE 5-5. Schematic drawing of the principle of phase-contrast angiography. When stationary spins are exposed to equal and opposite gradient pulses, the deflections of the spins are equal and opposite; therefore, there is no net signal. When the same gradient pulses are applied to a moving spin, the deflections are opposite but not equal because of variation in gradient strength within the magnet. Therefore, a net signal is created that can be imaged. (After Dumoulin CL, Souza SP, Pelc NJ. Phase sensitive flow imaging. In: Gottschalk A, ed. Magnetic Resonance Angiography: Concepts and Applications.Potchen EJ, Siebert JE, Haacke EM, St Louis: Mosby, 1993).
The direction of flow is an important consideration in PC MRA because phase shifts occur only in the direction of the phase encoding gradient. Blood flow in most areas of the body is complex, rather than unidirectional. Consider the right renal artery, which arises from a slightly anterior location on the abdominal aorta, curves posteriorly behind the inferior vena cava, and then curves inferiorly toward the renal hilum. Imaging only right-to-left flow in this artery would result in incomplete visualization of the proximal and distal portions of the vessel. By acquiring phase shifts in all three directions (right to left, superior to inferior, and anterior to posterior), a complete study of the vessel can be performed (Fig. 5-6). Unfortunately, one pair of gradients is required per direction to create phase shifts. With each set of gradients used, the time required to perform the study increases. Fortunately, flow in three directions can be imaged with four, rather than six, gradients using a technique known as Hadamard multiplexing. Nevertheless, the time required to complete a PC acquisition is long relative to TOF MRA.
One of the most critical elements of PC MRA is the velocity of the blood flow to be imaged. The goal of PC imaging is to maximize the phase shifts in flowing spins (large shifts result in brighter-appearing flow in the final images). Phase shift is directly proportional to several constants (such as the strength of the magnetic field) and to the variables of velocity of the spins and the amplitude of the gradients. Thus, larger gradients are required to image slow flow and smaller gradients to image faster flow. The parameter that describes this relationship is velocity encoding (Venc), usually calibrated in centimeters per second. For example, normal main renal artery flow is approximately 100 cm/sec; so one would select a Venc slightly higher than the expected flow (perhaps 110 cm/sec) to optimize visualization of flow in this portion of the vessel. Flow at other velocities (such as in the peripheral intra-renal arteries) will not image as well. Furthermore, if the flow is slower than expected, perhaps because of severe occlusive disease in the artery or poor cardiac output, imaging at a high Venc will result in poor visualization of the main renal artery flow. Currently, there is no widely available method for quickly determining which Venc will result in the best image for a particular vessel in a particular patient. This limitation of PC MRA is one of the major impediments to more widespread application of this technique.
The information acquired during PC MRA can be processed in several ways. The most common technique is phase difference, in which phase shifts are assigned a pixel value and color based on the value of the subtracted phase angle (Fig. 5-7). The intensity of the pixel reflects the size of the phase shift, with the most intense pixels representing flow closest to the value of the Venc. Directional information can be provided easily by displaying the pixels as either black or white; spins moving in the direction of the velocity gradients appear white, and those moving in the opposite direction appear black. Spins moving in a direction at right angles to the velocity gradients have no signal. A common artifact is the abrupt transition of one pixel color to another that occurs when the velocity of flow exceeds the Venc, termed aliasing, and is easily recognized by the irregular interface between the two colors caused by the pixel edges (Fig. 5-8).
Limitations
All MRA techniques are subject to certain limitations. Patients with pacemakers, intraocular or intraaural metallic foreign bodies, or claustrophobia cannot undergo imaging. Most MR units carefully screen patients with both a questionnaire and a brief interview with the technologist before scanning. Patients who are hemodynamically unstable require careful monitoring during scanning using specialized equipment that is compatible with strong magnetic fields. Turbulent flow (such as immediately distal to a stenosis) is difficult to image with non-gadolinium-enhanced techniques, as the spins are extremely disorganized in orientation and appear as areas of signal loss. Lastly, uncooperative patients or those with dementia may not be able to remain still during image acquisition, introducing motion artifacts that can render a study uninterpretable.
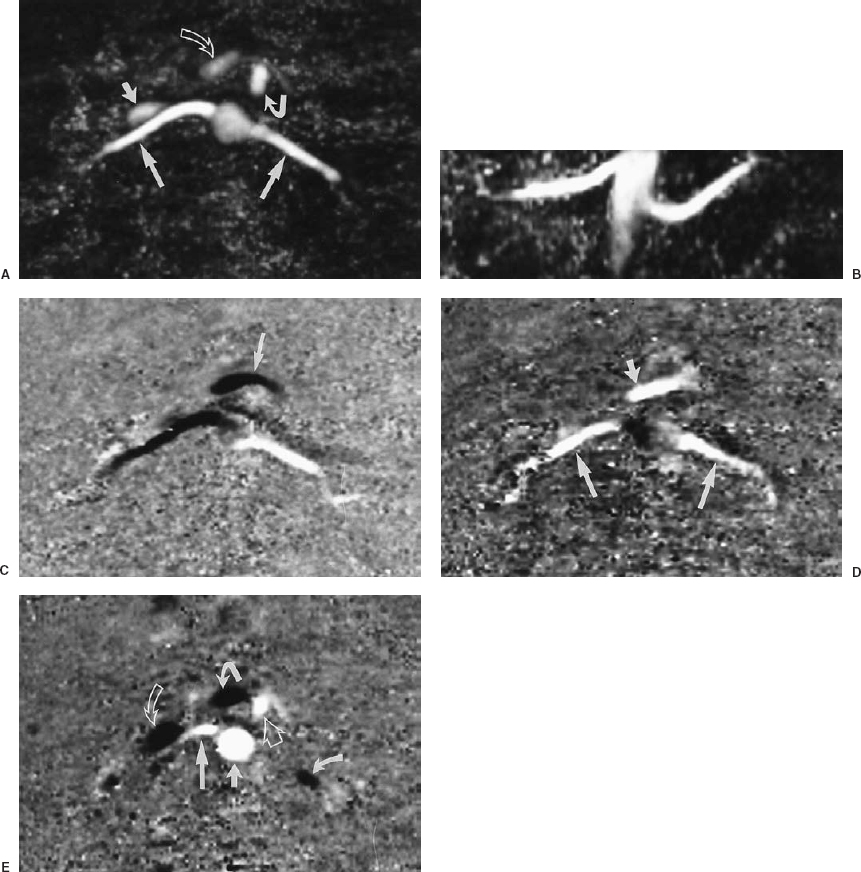
FIGURE 5-6. Three-dimensional phase contrast (3-D PC) magnetic resonance angiogram of the renal arteries of a normal volunteer illustrating the directional information produced by PC imaging. Velocity encoding was 100 cm/sec for this study, and flow in all three directions was imaged. A: Axial maximum intensity projection (MIP) of the speed images (all flow is white). Notice the anterior-to-posterior course of the renal arteries (large straight arrows). The inferior vena cava (IVC) (small straight arrow) is anterior to the right renal artery. The superior mesenteric artery (SMA) (solid curved arrow) and the superior mesenteric vein (SMV) (open curved arrow) are anterior to the aorta. The splenic vein can be seen anterior to the SMA. Note also the absence of any anatomic detail in the background. B: Coronal MIP of the same images. Notice the slightly caudal course of the right renal artery and the cranial course of the left renal artery. The tapered appearance of the distal aorta is due to loss of signal from saturation of spins within the 3-D imaging volume. C: Axial image showing right-to-left flow. The flow in the left renal artery is white (blood flows from the aorta to the left), whereas flow in the right renal artery is black (blood flows from the aorta to the right). Notice how the aorta and SMA are not well visualized. Why is flow in the splenic vein (arrow) black? D: Axial image showing anterior-to-posterior flow. The renal arteries (large arrows) are white because flow is posterior toward the kidneys (refer to A). The SMV (small arrow) is also white because it has a slighly posterior trajectory toward the portal vein. Again, notice how the aorta and SMA are not well seen. E: Axial image showing superior to inferior flow. Using the preceding four images, explain why the aorta (short straight arrow), SMA (open straight arrow), and proximal right renal artery (long straight arrow) are white, whereas the distal left renal artery (curved arrow), SMV (tightly curved arrow), and IVC (open curved arrow) are black.
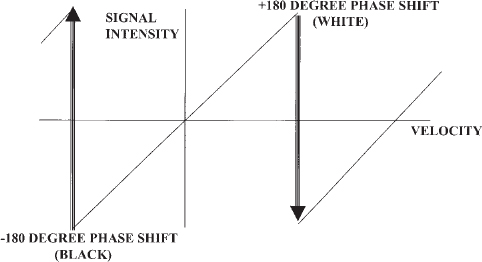
FIGURE 5-7. Schematic diagram of phase difference signal processing in phase contrast magnetic resonance angiography. Phase shifts are assigned a pixel intensity that increases as the velocity increases. When the phase shift exceeds the maximum value of the velocity encoding (Venc), the pixel color abruptly changes; this is termed aliasing. Choosing an appropriate Venc for the vessel of interest will result in improved visualization of flow and avoid aliasing.
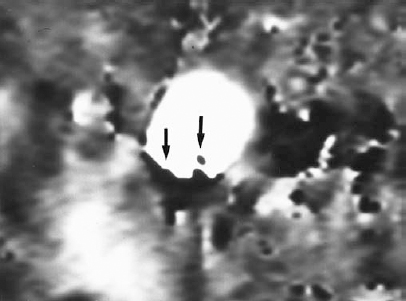
FIGURE 5-8. Aliasing artifact in a gated two-dimensional phase contrast magnetic resonance angiogram of the descending thoracic aorta. Velocity encoding was 40 cm/sec, flow in the superior to inferior direction was imaged, and phase-difference signal processing was used. When flow in the superior to inferior direction exceeded 40 cm/sec, it abruptly changed color from white to black, with a sharp interface (arrows). This interface changed considerably throughout the cardiac cycle, an important clue to the nature of the artifact.
CT/CT angiography
Principles of CT
CT imaging revolutionized diagnostic and interventional radiology because it allowed physicians to view the body in a way that had been previously restricted to the gross anatomy laboratory. Developed by Sir Gregory Hounsfield, the technique is based on computerized reconstruction of data acquired by rotating a narrow radiographic source (mounted in a circular gantry) around a patient in an axial plane. An axial image is created that looks as though the body has been bisected at that point. This technology has had a tremendous impact on diagnostic visceral angiography, as pathology such as solid liver lesions now can be visualized and characterized with greater accuracy and without the need for an invasive procedure.
The core principle of CT imaging is identical to that of flouroscopy: variable absorption of ionizing radiation by different tissues. Using sophisticated data processing, CT is more sensitive to subtle differences in tissue density than most conventional radiographic techniques. Conventional gastrointestinal and vascular contrast agents can be used during scanning to enhance these differences or aid in the identification or evaluation of structures. The radiographic density of a structure can be measured and is described in Hounsfield units (HU). Air, fat, muscle, fresh hematoma, bone, and contrast-enhanced blood all have characteristic densities that permit confident identification.
CT technology
The construction of conventional CT scanners permits acquisition of only one image at a time, because the gantry makes one rotation per slice. Regardless of how quickly this rotation can occur, the gantry must return (unwind) to a start position before the next image can be acquired. Patients are imaged by lying on a table that is fed incrementally through the gantry, with the table moving a predetermined distance between slice acquisitions. Scanners with this type of gantry are well suited for body interventions such as drainage or biopsy, in which individual slices are used for planning approaches and monitoring progress. Unlike ultrasound guided procedures, however, there is limited capability for monitoring the actual manipulation of needles or tubes, because most CT scanners require too much time to acquire and process the necessary data to construct an image.
Regardless of how quickly an image can be acquired, scanning on a slice-by-slice basis unavoidably results in a time penalty related to the gantry and the table feed. Certain dynamic processes, such as blood flow, cannot be studied using this type of equipment. The application of slip-ring technology to CT scan gantry construction allows continuous rotation of the tube, without the need to stop and “unwind” (Fig. 5-9). Usually, each rotation requires 1 sec; therefore, the rate of acquisition is 1 slice/sec. Helical (or spiral) CT scanners image continuously as the patient is moved through the gantry. In addition to the usual parameters of thickness of the x-ray beam (collimation), such as peak kilovolt (KvP) and milliampere second (MaS), the operator must also choose a rate of table feed (pitch, which is the ratio of the distance of table movement to collimation assuming a 1 sec. tube rotation per slice). Data are acquired as a volume rather than as individual slices; so large anatomic areas can be scanned completely in 20 to 30 sec. (a single breath-hold). In practical terms, this means image acquisition time is limited by the heat capacity of the equipment and the patient’s ability to suspend respiration. Because scanning is faster than image reconstruction, image processing can be the longest portion of the study. The volumetrically acquired data can be displayed in any plane, but most manufacturers display the data as axial slices. The greatly reduced scan time of helical scanners allows CT imaging of physiologic processes formerly beyond the capability of this technology, such as tracking of a bolus of vascular contrast. The latter process is CTA. This technique has been applied to a wide range of vascular structures within the body, including the carotid arteries, the aorta and its branches, the lower extremity arteries, the peripheral and central veins, and the pulmonary arteries.16–26
The basic principle of CTA is a carefully timed helical acquisition of data during the rapid peripheral infusion of large amounts of iodinated contrast. The amount of anatomic coverage required and the size of the blood vessel of interest determine the collimation, pitch, and contrast injection. Typically, the collimation varies from 1 to 7 mm in thickness, and from 1 to 2, in pitch. For example, a study of the iliac arteries might be performed with a collimation of 5 mm and a pitch of 2, whereas a study of the circle of Willis might use a collimation of 1 mm and a pitch of 1. In general, the thinner the collimation or greater the pitch, the lower the ratio of signal to noise in the image.
Unlike MRA, CTA is entirely dependent on the imaging of an intravascular contrast agent; suppression of information from background tissues is not possible. Three factors regarding intravascular contrast agents in CTA are important: rate of injection, volume of contrast, and concentration of iodine. Visualization of vessels improves as the concentration of contrast in the blood increases. Therefore, rapid injection of a large amount of contrast is necessary to maintain a density of intravascular contrast that permits indentification of small vascular structures. Most CTA studies require injection rates of 3 to 5 mL/sec for a total volume of 100 to 150 mL. The concentration of iodine is as important as the rate and volume of contrast injection, as dilute contrast will result in inadequate opacification because of further dilution in the bloodstream. For most applications, contrast containing 60% iodine (such as Renografin 60 or Ominpaque 300) provides the best results. Intravenous lines used for CTA should be checked carefully for patency before contrast injection, because large subcutaneous extravasations may result if the catheter is in a small vein or is partially dislodged. Keep in mind that the volume of contrast used for CTA is comparable to, and in some cases may actually exceed, that used in conventional angiography.
Timing of imaging in relation to contrast injection is critical in CTA (Fig. 5-10). A sufficient delay must be used to allow contrast to reach the vascular bed of interest before commencing the scan. Furthermore, the duration of contrast injection must be long enough to ensure adequate vascular opacification for the entire time image acquisition. For example, a delay of 20 to 30 sec. is typical for most abdominal applications, whereasadelay of only10to 15 sec. may be necessary for the carotid arteries. The ideal approach is to perform a test bolus of contrast injected at the planned rate, with acquisition of images at a fixed point at the top of the helical volume every 1 to 2 secs. following a 5- to 10-sec. delay. A time/density curve then can be plotted from aregion of interest placed in the vessel of interest. The peak of the curve then determines the delay for the helical scan. The only disadvantage to this approach is the tube heating, which may delay the helical acquisition. Some scanners can automatically detect the arrival of the bolus of contrast in the vessel of interest.
Suspended respiration is important for many abdominal and thoracic applications of CTA. Motion during the scan will result in blurring and partial volume averaging. The duration of the scan thus may be determined by the patient’s ability to hold his or her breath; patients on respirators or with severe tachypnia may not be suitable candidates for this technique. Certain types of motion cannot be avoided during a scan; in particular, cardiac pulsation can distort the appearance of the adjacent aorta and other structures (Fig. 5-11).
Related posts:
Stay updated, free articles. Join our Telegram channel

Full access? Get Clinical Tree


