Retroperitoneal diseases are frequently a great clinical challenge because of their nonspecific presentation. Diseases may be asymptomatic with indolent biological behavior, and often show a large mass at initial imaging evaluation. Magnetic resonance (MR) imaging is a powerful diagnostic technique for assessment of detailed disease location and for characterization of tissue components and vascularization of lesions, with many advantages compared with computed tomography and ultrasonography. This article presents the MR imaging features of common retroperitoneal pathologic processes.
Key points
- •
Previous knowledge of certain underlying diseases helps to identify the most likely diagnosis and can even preclude biopsy.
- •
Many retroperitoneal lesions may mimic each other in magnetic resonance appearance, and histopathologic confirmation is needed.
- •
Age, mass location, and characterization of tissue components are crucial to narrow the differential diagnosis of a retroperitoneal lesion.
- •
The presence of macroscopic fat indicates a narrow list of fat-containing tumors, among them the liposarcoma, which is the most common retroperitoneal tumor.
Introduction
Evaluation of retroperitoneum is essential in all abdominal imaging studies, such as ultrasonography, computed tomography (CT), and magnetic resonance (MR) imaging, for any given clinical indication. Although retroperitoneal pathologic processes could be asymptomatic with indolent biological behavior, some diseases and lesions can manifest as acute pain syndrome, such as back or abdominal pain, prompting for imaging assessment. These pathologic processes include a wide range of neoplastic, proliferative, and inflammatory/infectious conditions that may present similar clinical features and overlapping imaging findings. The precise location and tissue characterization are the main goals of imaging evaluation, which is needed to define biopsy planning, and to help the surgical approach, whenever possible. To the best of our knowledge, there is no new evidence driven by direct comparison between CT and MR imaging for the assessment of performance in the evaluation of retroperitoneum. Although CT is usually the preferred modality for the retroperitoneum in routine clinical practice, MR imaging has been reported to be the most accurate modality for adrenal and pancreas evaluation, and CT and MR imaging have been reported to have comparable accuracy for kidney disease. MR imaging has superior soft tissue contrast resolution compared with CT because of its multiple techniques, which permit detection of the free water molecules (as in edema and large masses of cytoplasm), macroscopic and microscopic fat, and differences between compact/dense tissues and loose/sparse soft tissue. Moreover, postcontrast MR imaging sequences are more sensitive to depict differential tissue vascularization compared with CT. A disadvantage of MR imaging is the low sensitivity for the detection of calcifications compared with CT. Despite these advantages of MR imaging compared with CT, MR imaging evaluation also usually does not permit a definitive diagnosis in the lesions of retroperitoneum except in a few specific disease entities, but imaging is very important in most cases to narrow the differential diagnosis.
Normal anatomy and imaging technique
Detailed knowledge of the compartmental anatomy of the retroperitoneum is essential to understand the origin and dissemination of retroperitoneal diseases and lesions as well as pathologic process from adjacent spaces that may involve the retroperitoneum. The retroperitoneum is defined anteriorly by the posterior parietal peritoneum and posteriorly by the transversalis fascia, extending from diaphragm to the pelvic inlet level. It has 5 compartments: 2 lateral, 2 symmetric posterior ones containing the psoas major muscle, and 1 central vascular compartment containing the great vessels and neural and lymphatic structures. The lateral compartments are asymmetrical and divided by anterior and posterior renal fascia, which creates 3 spaces: anterior and posterior pararenal and perirenal spaces.
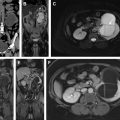
The perirenal space is defined by the anterior and posterior sheets of renal fascia, known as anterior renal fascia (ARF) or Gerota fascia and posterior renal fascia (PRF) or Zuckerkand fascia, respectively ( Fig. 1 A ). It is larger superiorly and delimited by the diaphragm, and thinner inferiorly, where both ARF and PRF adhere to the ureter, assuming an inverted, closed cone shape. Although cadaveric studies have shown the closed feature of perirenal space, interfascial planes exist and may permit fluid collection extension toward other spaces, including the pelvis.
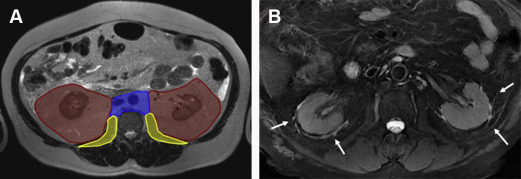
Both perirenal spaces contain the kidneys, renal pelvis and proximal ureters, adrenal glands, and perirenal fat. Moreover, there is a fine bridging septa network comprising 3 different septa types that supports the kidney, which is seen on imaging evaluation only when it accumulates fluid ( Fig. 1 B) or cellular tissue caused by pathologic processes. The focus here is the perirenal space and the most common lesions arising from this compartment. Besides the kidney and hilum components (renal artery, vein, and pelvis), adipose tissue, lymph nodes, and adrenal are the main structures in this space.
Imaging protocols
MR imaging evaluation of retroperitoneum can be reliably assessed using a phased-array receiver coil with the patient placed in supine position in a 1.5-T or 3-T scanner. A combination of breath-hold and breathing-independent T1-weighted and T2-weighted sequences acquired in at least 2 different planes is present in virtually any MR protocol. A complete and comprehensive MR imaging evaluation is achieved with gradient echo variations of precontrast and postcontrast T1-weighted sequences, mainly in-phase and out-of-phase spoiled gradient-echo, and fat-suppressed three-dimensional gradient echo. Also, non–fat-suppressed T2-weighted and different techniques of fat-suppressed T2-weighted sequences are needed. Although postcontrast fat-suppressed T1-weighted sequences are important for delineation of many retroperitoneal disease processes and must be obtained, even with its preclusion, in selected cases because of renal impairment or other concerns, MR imaging findings still can evaluate size, location, and tissue characteristics of most lesions. Diffusion-weighted imaging (DWI) has gained attention, mainly for the MR evaluation of oncologic patients, because some reported evidence has shown the added value of this technique to detect tumor deposits and tumor activity. In current MR systems, addition of DWI sequences ultimately has very little impact on total time for the examination acquisition. Table 1 shows the parameters of a basic generic abdominal/retroperitoneum MR protocol.
| Sequence | Planes | Fat Suppression | IV Contrast | Repetition Time (ms) | Echo Time (ms) | Flip Angle (Degrees) | Section Thickness (mm) | Matrix Size | |
|---|---|---|---|---|---|---|---|---|---|
| T1-weighted 2D SGE | Coronal | − | Pre | 10 | 4.4 | 15 | 6–8 | 250 × 330 | |
| T2-weighted FSE/TSE | Coronal | − | — | 1200–1500 | 80–90 | 90 | 6–8 | 330 × 330 | |
| T2-weighted FSE/TSE | Axial | − | — | 1100–1300 | 160 | 90 | 6–8 | 330 × 330 | |
| T2-weighted STIR/SPAIR | Axial | + | — | 1100 | 80 | 90 | 6–8 | 300 × 300 | |
| T1-weighted 2D SGE | Axial | − | Pre | 110–140 | 2.2 and 4.4 | 80 | 6–8 | 300 × 380 | |
| Diffusion (b = 0, 150, 500, 1000) | Axial | — | Pre | 4500–5000 | 70–80 | 90 | 4–6 | 200 × 200 | |
| T1-weighted 3D SGE | Axial/coronal/sagittal a | + | Pre and post a | 4.3 | 1.7 | 3.5 | 10 | 250 × 250 | |
a Postcontrast images were acquired at hepatic arterial dominant, portal venous, and interstitial phases with the same injection protocol.
Imaging findings/pathology
The correct lesion localization, including its origin and extension, and the correct characterization of specific tissue components and vascularization, are the key features of the imaging evaluation of retroperitoneal masses. However, large masses may pose some difficulty in determining its exact origin. Displacement of adjacent organs and structures and a series of described radiologic signs contribute to the correct evaluation in most cases. The radiologic signs that indicate a specific organ origin are known as the beak sign, the phantom (invisible) organ sign, the embedded organ sign, and the prominent feeding artery sign.
The most common retroperitoneal mass lesions are related to inflammatory/infectious or neoplastic lymph adenopathy, such as tuberculosis and lymphoma. Moreover, retroperitoneal primary neoplasms are rare. Among them, sarcomas are the most common, although only 10% to 20% of sarcomas are located in retroperitoneum, corresponding with only 0.1% to 0.2% of all solid malignancies. Nonetheless, retroperitoneal neoplasms are malignant in 70% to 80% of cases.
Although the classic imaging description of retroperitoneal conditions is based on lesion location, a practical and comprehensive approach for diagnosis of retroperitoneal masses must be based on the evaluation of the tissue component of the lesion, with some added specific findings such as vascularization that permit to narrow the differential diagnosis ( Table 2 ). In this article, lesions are classified according to their main tissue component, which correlates to their histopathologic features: fat, myxoid stroma, necrosis, cystic nature/cystic components, and small round cells. A specific subset of infiltrative perivascular lesions with lymph nodes and retroperitoneal organ involvement is presented comparatively with lymphomas because they may mimic lymphoma presentation ( Table 3 ). Vascularization features for each lesion are presented as well.
| Tissue Component | |
|---|---|
| Fat containing | Lipomatosis |
| Lipoma | |
| Low-grade liposarcoma b | |
| High-grade liposarcoma a | |
| Hibernoma | |
| Teratoma | |
| Myxoid stroma | Schwannoma |
| Neurofibroma | |
| Ganglioneuroma | |
| Pleomorphic sarcoma (myxoid malignant fibrous histiocytoma) a | |
| Leiomyosarcoma a | |
| Small round cells | Lymphoma b |
| Peripheral primitive neuroectodermic tumor c | |
| Cystic or necrotic | Paraganglioma a |
| Liposarcoma | |
| Lymphangioma | |
| Mucinous cystic lesion | |
| Anterior Aortic Displacement | Ureter Involvement | IVC Involvement | Location in Retroperitoneum | |
|---|---|---|---|---|
| Lymphoma | Typically present | Sporadically | Frequent | Anywhere |
| ECD | Absent | Sporadically | Usually spared | Anywhere |
| Idiopathic retroperitoneal fibrosis | Absent | Frequent | Frequent | Typically L4 to S1 |
Diagnostic criteria
Fat-Containing Lesions
A myriad of lesions arising from adipose tissue can be found in perirenal space, varying from benign to frankly malignant ( Table 4 ). Benign lesions include the diffuse form of fat proliferation (lipomatosis) and the rarer focal lesions (lipomas).
| Incidence | Origin Type of Fat Tissue | Signal Intensity Pattern | Visible Fat | Typical Features | |
|---|---|---|---|---|---|
| Lipomatosis | Rare | White | Homogeneous | Always | Diffuse. No mass formation |
| Lipoma | Rare | White | Homogeneous | Always | Round, well-defined small masses |
| Low-grade liposarcoma | Most common sarcoma | White | Homogeneous Mild heterogeneity | Very frequent Low proportion | Round, well-defined, large masses, thick septa |
| High-grade liposarcoma | Most common sarcoma | White | Heterogeneous | Usually scarce or not seen | Large and heterogeneous mass |
| Hibernomas | Very rare | Brown | Heterogeneous | Not seen | Heterogeneous Large-caliber vessels |
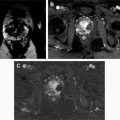
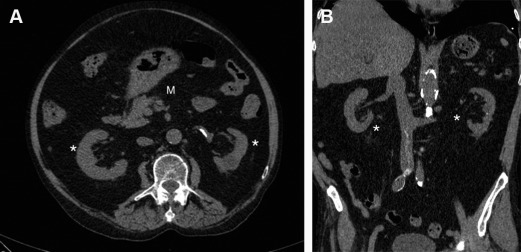
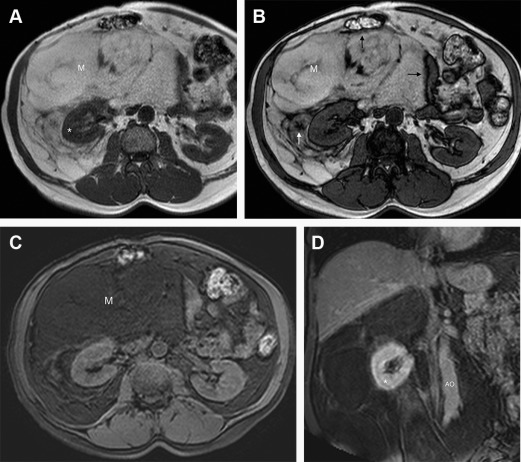
Lipomatosis is a rare condition defined as diffuse, increased proliferation of histologically benign adipose tissue in certain areas of the body. Although pelvis and intraperitoneal space/mesentery are common locations, lipomatosis is rare in the retroperitoneum. Epidemiologically, they are more common in middle age, the fourth and fifth decades, with a clear male predominance in the literature. Clinical presentation varies from absence of symptoms (incidental finding) to urinary symptoms such as dysuria, urgency, and even hematuria. At imaging, typical fat findings such as bright signal on T1-weighted imaging are seen involving and distorting organs without signs of invasion ( Fig. 2 ).
Lipomas represent benign focal proliferation of mature fat tissue and are exceedingly rare in the retroperitoneum. The assumption that a rounded, homogeneous fat mass represents a lipoma should be made with caution, because they cannot be confidently distinguished from well-differentiated liposarcomas based on imaging findings.
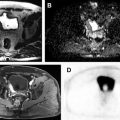
Although liposarcomas are the most common retroperitoneal sarcomas, the perirenal space is the preferred location for this neoplasm. The peak of incidence occurs in sixth and seventh decades of life, with no gender predominance. On histology, this neoplasia is usually divided into 5 subtypes, from well-differentiated to undifferentiated lesions, as follows: well-differentiated, myxoid, dedifferentiated, round cell, and pleomorphic lesions. At diagnosis, they often present as a large, palpable mass, because no particular symptom is usually associated with this neoplasia. Cross-sectional imaging plays a major role for confirming the diagnosis, because fat can easily be confirmed by CT or MR imaging, and for staging ( Fig. 3 ), when tumor extension is assessed, particularly if adjacent organs and/or vessels are involved.
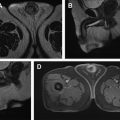
Mass characterization by imaging is important because large and heterogeneous lesions, usually presenting with areas of necrosis, are often associated with high-grade lesions on histology and poorer prognosis. In the more aggressive lesions, adipose tissue may not be defined by imaging, and liposarcomas should be suspected by the location and heterogeneity of the lesion ( Fig. 4 ).
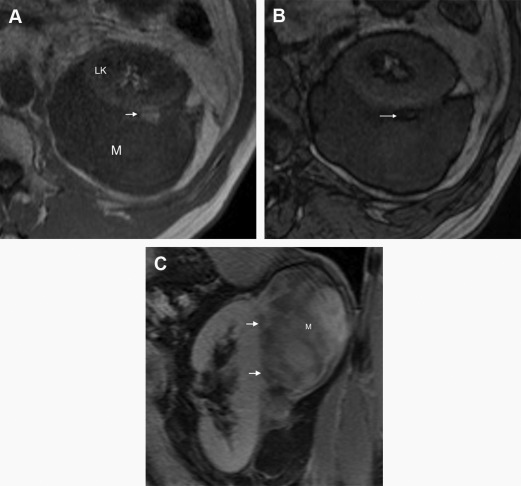
Resectability should be assessed by checking any signs of invasion of adjacent organs and/or signs of major vessel encasement.
An even rarer lesion derived from fat tissue that may occur in the retroperitoneum is hibernoma. These lesions are histologically benign and arise from brown adipose tissue but can show white fat, myxoid tissue, and spindled cells. The most common locations are mediastinum, axilla, and neck, with the abdomen and retroperitoneum accounting for only 10% of cases. At MR imaging, hibernomas rarely show macroscopic fat. They tend to show intermediate signal between muscle and fat on T1 but typically show large intralesional vessels.
Myxoid Stroma Lesions
Pathologically, myxoid stroma is characterized by mucoid matrix rich in mucopolysaccharide acid with variable vascularization. Most commonly, myxoid stroma has low signal on T1-weighted sequences and variable high signal on T2-weighted sequences. Usually, myxoid benign lesions present delayed to mild postgadolinium enhancement, and malignant lesions have accentuated enhancement on early phase.
Neurogenic tumors
Neurogenic tumors account for 10% to 20% of retroperitoneal neoplasm and are classified as ganglion cell origin (ganglioneuromas), paraganglionic system origin (paragangliomas), or nerve sheath origin (neurilemmomas/schwannomas, neurofibromas, and malignant nerve sheath tumors). Ganglioneuromas, neurofibromas, and schwannomas are mainly myxoid stroma tumors because paragangliomas are classified as cystic/necrotic tumors.
Overall, neurogenic tumors tend to show a fusiform shape, increased T2-weighted signal intensity, and highly intense contrast enhancement. There is no single imaging feature that can make the differentiation between benign and malignant neurogenic tumors, but the presence of distant metastasis and accelerated interval growth rate contribute to this differentiation when present. Classic findings of osseous remodeling are associated with benign slow-growing tumors, but, even so, some benign tumors may present malignant transformation. Detailed MR imaging findings, actuarial data, other diagnostic features and biological behavior of the main neurogenic tumors are presented in Table 5 .
| Neurogenic Tumors | MR Imaging Findings | Actuarial Data | Other Diagnosis Features | Biological Behavior |
|---|---|---|---|---|
| Ganglioneuroma ( Fig. 5 ) | Homogeneous paravertebral mass (5–15 cm) with low signal on T1-weighted and marked high signal on T2-weighted images. Delayed heterogeneous enhancement may be seen. Extension along normal structures. Punctate calcifications may be seen. Necrosis is uncommon | 20–40-y age group, with no sex predilection. Represent 0.7%–1.6% of all primary retroperitoneal tumors | Slow-growing tumor | Benign; rarely recur after surgical excision, rare description of malignant transformation |
| Ganglioneuroblastoma ( Fig. 6 ) | Vary ranging from a predominantly solid mass to a predominantly cystic mass. Encapsulated. May contain granular calcification. MR features similar to neuroblastoma more than ganglioneuroma | 2–4-y age group, with no sex predilection | The most common tumor site is the abdomen, followed by the mediastinum, neck, and lower extremities | Malignant |
| Neuroblastoma ( Fig. 7 ) | Heterogeneous irregular and lobulated mass with low signal intensity on T1-weighted images and high signal intensity on T2-weighted images. Variable contrast enhancement. Hemorrhagic areas may manifest as areas of high signal intensity on T1-weighted images, and cystic change may appear bright on T2-weighted images. 85% of cases present with calcifications (coarse, amorphous, mottled). It may invade adjacent organs and encase vessels with luminal compression | Boys, first decade of life | Two-thirds located in the adrenal gland, and the remaining occur along the paravertebral sympathetic chain | Malignant; metastasis to bone, liver, lymph nodes, and skin (70% of cases at onset) |
| Paraganglioma ( Fig. 8 ) | Paravertebral mass, hypointense or isointense to liver parenchyma on T1-weighted and markedly hyperintense on T2-weighted images; best appreciated with fat suppression. Intense early enhancement, which persists in the subsequent phases. Necrotic changes in up to 70%. 15% punctate calcification. Fluid-fluid level. Typically arise at the renal hila and near the inferior mesenteric artery origin (organ of Zuckerkandl) | 40–60 y, with no sex predilection | Functional tumors are often associated with hypertension, tachycardia, headache, and diaphoresis because of high catecholamine levels. May be associated with von Hippel-Lindau syndrome, MEN type II, and NF-1 | More aggressive than their adrenal counterpart. Malignant in up to 40% of cases on selected series |
| Schwannoma ( Fig. 9 ) | Oval mass with low to intermediate T1 and high T2 signal intensity with slow but persistent postcontrast enhancement of solid components. Central enhancement in a targetlike fashion may be seen. Necrotic changes in only about 30% of cases. Frequently shows prominent cystic degeneration and calcification. Encapsulated. Compression of nerve to one side | Female predilection (2:1). 20–50 y. Accounts to 4%–5% of all retroperitoneal tumors | — | Benign; very low risk of malignant transformation |
| Neurofibroma | Well-circumscribed, round mass with low T1 and high T2 signal intensity; a central area of lower signal intensity may also be seen on T2-weighted images. Central enhancement in a targetlike fashion may be seen as homogeneous contrast enhancement. Occasionally, myxoid degeneration. Usually unencapsulated. Diffuse expansion of the entire nerve | Male predilection. 20–40 y (younger in NF-1). Accounts for 1% of retroperitoneal tumors | — | Degeneration to malignant peripheral nerve sheath tumor may be seen, more commonly in the setting of neurofibromatosis |
| Plexiform neurofibroma ( Fig. 10 ) | Usually bilateral, mainly symmetric, elongated parapsoas masses with homogeneous low attenuation | — | Characteristic of NF-1 | Up to 5% lifetime risk of malignant transformation |
| MNST | Aggressive sarcoma arising from a peripheral nerve (eg, sciatic nerve, brachial plexus, sacral plexus) or preexisting benign nerve sheath tumor (eg, neurofibroma). Include malignant schwannoma, neurogenic sarcoma, and neurofibrosarcoma. 50% of these tumors originate de novo, and the rest of them are derived from neurofibroma or ganglioneuroma or occur after exposure to radiation. Distant metastasis in 65% of cases. More common in the 20-year-old to 50-year-old group, with no sex predilection. In 25% to 50% of cases, these tumors are associated with NF-1 | |||
Stay updated, free articles. Join our Telegram channel

Full access? Get Clinical Tree


