Magnetic Resonance Imaging Patterns
General Indications for Magnetic Resonance Imaging Examination
Magnetic resonance imaging (MRI) is the most tissue-sensitive, noninvasive imaging modality for evaluating an extraordinarily wide range of diseases affecting the neuromusculoskeletal system. It is the modality of choice for evaluation of osteonecrosis, occult fractures, and soft-tissue neoplasms and in assessing many soft-tissue structures of the musculoskeletal system. In many instances, MRI has replaced more invasive imaging techniques such as x-ray and computed tomography (CT) arthrography, myelography, and discography.
However, conventional radiography remains an important initial imaging tool. Plain film radiography provides valuable information in evaluating common bone and joint pathologies. Conventional x-ray techniques can be more specific than MRI in diagnosing many bone lesions, especially tumors, which often produce radiographically predictable bone changes and periosteal reactions. Plain film radiographic examinations consequently complement the MRI examination and often precede it.
Magnetic resonance imaging has major advantages over conventional radiographic studies and even CT. These advantages include the ability to yield high tissue contrast, imaging in multiple planes, and presenting a large field of view, all without radiation exposure. Consequently, MRI is helpful in the evaluation of a wide range of conditions of the neuromusculoskeletal system, including traumatic muscle and tendon injuries; hematomas; infections; masses; and internal injuries to joints, including meniscal and cruciate ligament tears and brain and spinal cord pathology.
The cost of MRI is relatively high; however, an MRI examination usually yields an accurate diagnosis of the patient’s condition. Furthermore, it may preclude the need for redundant multiple examinations that may be less sensitive and specific and possibly more invasive than the MRI examination. For instance, MRI should be the primary imaging procedure in evaluating the spine, particularly in the presence of neurologic symptoms. MRI represents an important diagnostic tool for chiropractors, given that disorders of the spine represents a daily diagnostic challenge.
The following tables illustrate some of the more common pathologies encountered in imaging the spine and extremities for musculoskeletal complaints.
MR1 Spine
| Disease | Comments |
| Marrow | |
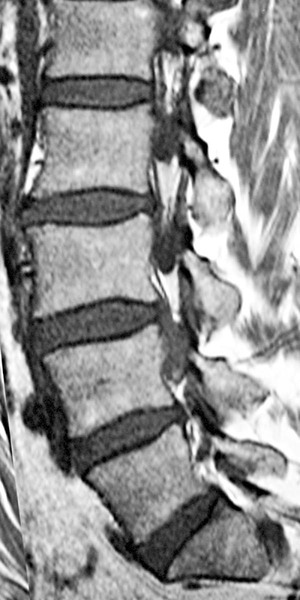
| Yellow bone marrow (Fig. 20-1) | Adult bone marrow is normally signal hyperintense on T1-weighted and, to lesser extent, on T2-weighted sequences because of fat content; radiation therapy can also result in increased hyperintensity of the bone marrow, especially on T1-weighted sequences because of increased fat content |
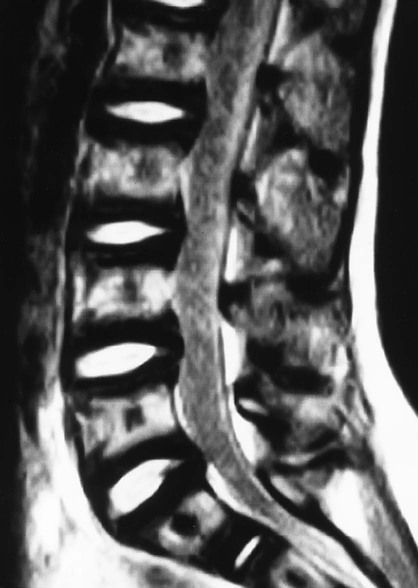
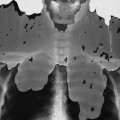
| Bone marrow replacement disorders (Fig. 20-2) | Marrow appears black (low signal) focally with a bone island and metastasis, and diffusely with mastocytosis, hemosiderosis, myelofibrosis, and osteopetrosis because these conditions replace the marrow constituents |
| Spine | |
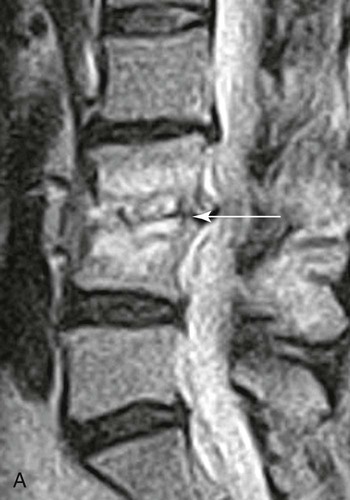
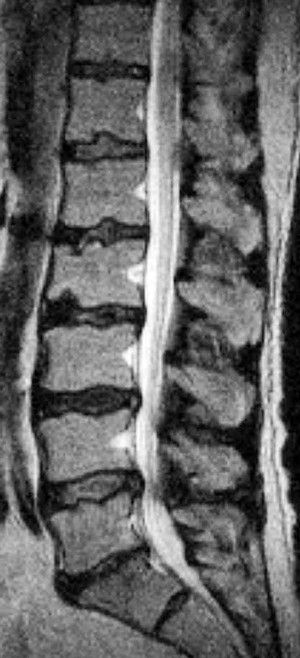
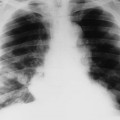
| Infection (Fig. 20-3) (p. 789) | Very sensitive diagnosis of infection is provided by MRI when it is used in conjunction with the clinical presentation and radiographic findings; MRI examinations reveal joint effusions on the T2-weighted images with juxtaarticular bone marrow edema and abnormal signal within the adjacent soft tissues, along with bone destruction |
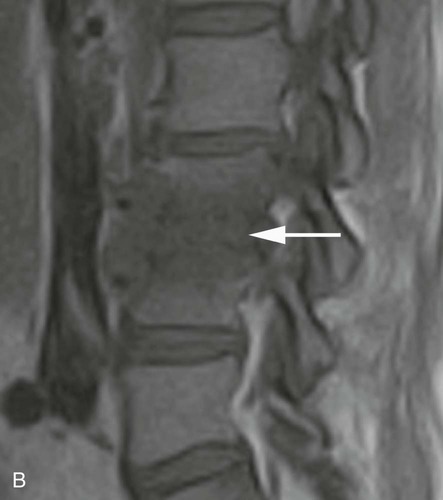
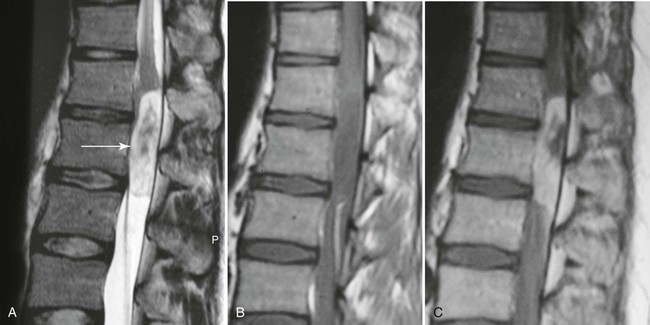
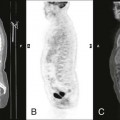
| Metastasis, multiple myeloma (Fig. 20-4) | Bone tumors tend to primarily involve bone marrow; MRI is very sensitive to metastatic and primary bone tumor involvement of the marrow compartment; the typical MRI feature of spinal vertebral body metastasis is deformity (vertebral collapse) with low signal intensity on the T1-weighted sequences and high signal intensity on the T2-weighted sequences, often involving multiple segments; the MRI examination also can evaluate extension into the adjacent paraspinal tissues inclusive of the spinal canal; other bone marrow–replacing disorders inclusive of multiple myeloma and lymphoma look similar |
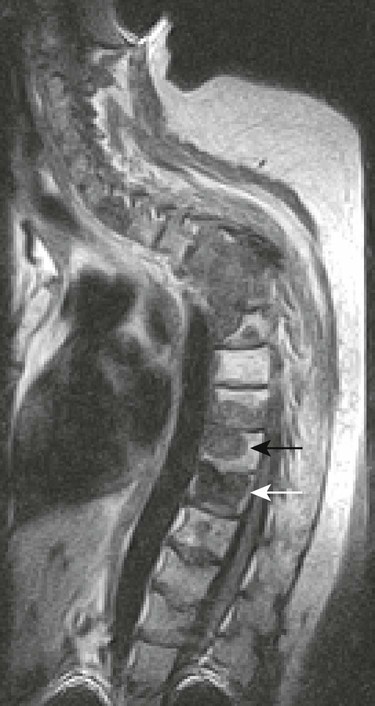
| Vertebral body compression fractures (Fig. 20-5) | Fresh benign fractures often create a linear increase in T2 signal that parallels the endplate but on occasion creates a nonhomogeneous bone marrow change, reflective of hemorrhage; by contrast, tumor replacement of marrow tends to create homogeneous often mass-like signal changes within the vertebral bodies; multiple levels of vertebral body marrow abnormalities with fracture are typical for metastatic disease. MRI findings of collapse secondary to malignancy usually include destruction of the anterolateral or posterior cortical bone of the vertebral body with destruction of the vertebral body, destruction of a pedicle, and focal soft-tissue or epidural mass |
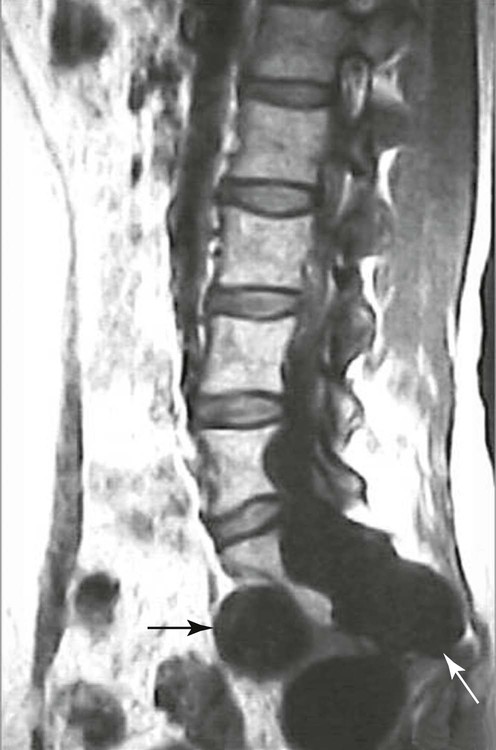
| Hemangioma (Fig. 20-6) (p. 886) | Typically hyperintense on both T1-weighted (contributions from fat and vascular components) and T2-weighted (contributions from fluid or blood sequences); the signal hyperintensity on T1-weighted sequences allows discrimination from more aggressive bone marrow–replacing pathologies inclusive of metastasis and myeloma; the absence of cortical destruction also assists in differentiation. MRI may also show the typical features of accentuated vertical trabeculation which can be correlated with the conventional radiographs or CT |
| Primary tumors (Fig. 20-7) | For normal or equivocal initial radiographs, MRI is useful for further evaluation of the presence of a serious underlying pathology such as tumor or infection; MRI is sensitive in detecting bone marrow abnormalities; criteria to distinguish tumor or metastasis from infection are the same as in conventional radiography, but this pattern can be recognized at a far earlier stage on an MR image; in the spine, when only a single body is involved, it is difficult to distinguish infection from tumor if the differentiation is based purely on the MR images; the plain film criteria of endplate destruction and disc involvement are typical of infection rather than metastasis; extension of destruction into the posterior elements of a vertebra is more typical of metastatic disease; signal changes of infection frequently are equal to cerebrospinal fluid, whereas metastatic bone disease appears more hypointense; soft-tissue involvement of infection tends to be ill defined as opposed to the soft-tissue involvement of tumor, which often is more sharply defined; in general, the signal changes within the vertebral bodies are nonspecific, and sometimes differentiation of benign from malignant lesions is difficult; however, certain masses have typical MRI characteristics allowing for confident diagnosis; in general, “white lesions are ‘right’ on T1-weighted images” and “white lesions are ‘wrong’ on T2-weighted images”; for example, a vertebral fat deposit that is of limited clinical significance appears as high signal intensity on T1-weighted scans and lower signal intensity on T2-weighted scans and is typical for hemangiomas; by contrast, metastatic bone disease, which is highly clinically significant, likely demonstrates high signal intensity on T2-weighted images |
| Intervertebral Disc | |
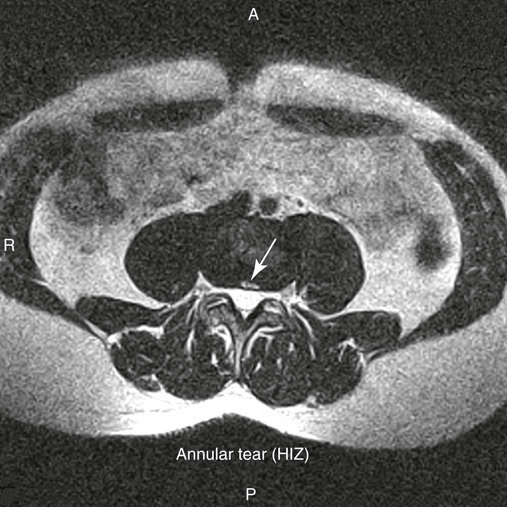
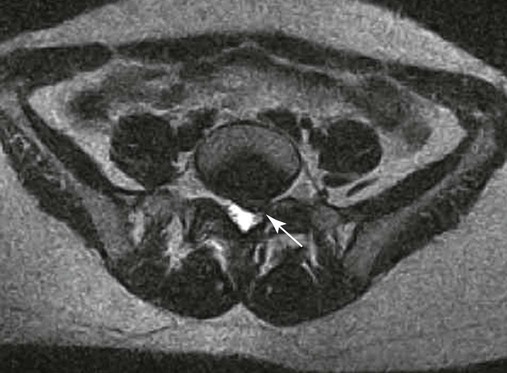
| Annular rents (Fig. 20-8) | Hyperintense focal lesions involving the posterior annular fibers (high intensity zone) on T2-weighted or gradient echo–weighted images |
| Disc bulge | Diffuse contour alteration of disc; presence of disc extending “circumferentially” (50%–100%) beyond the edges of the endplate |
| Disc herniation | Herniation is defined as a localized displacement of disc material beyond the limits of the intervertebral disc space |
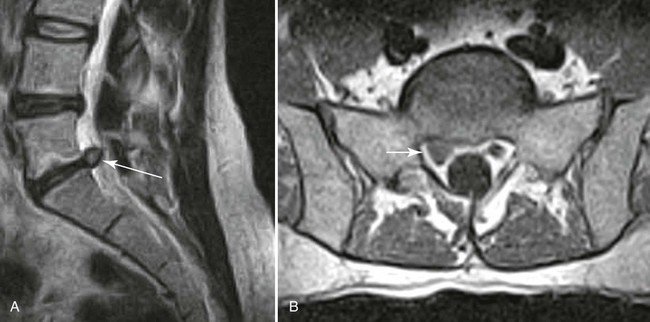
| Disc protrusion (Fig. 20-9) | A broad-based disc herniation |
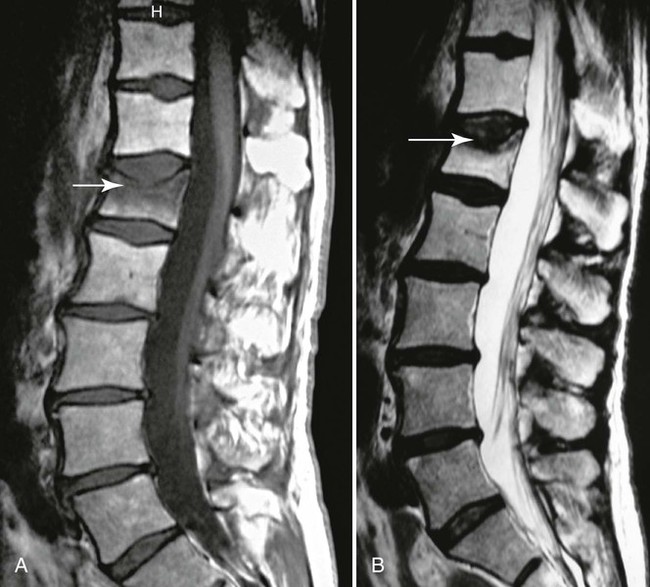
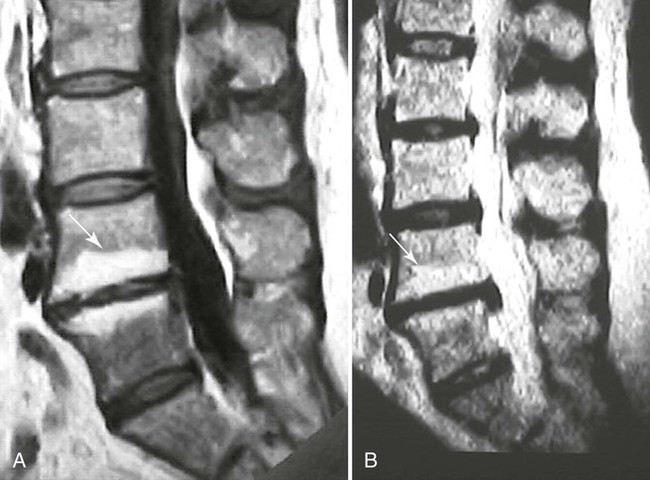
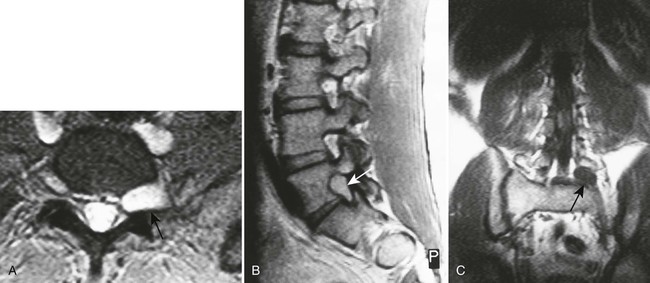
| Disc extrusion (Fig. 20-10) | Transligamentous extrusion of the disc material through the annulus with narrow communication by an isthmus with the parent disc |
| Disc sequestration | Transligamentous disc herniation without communication with the parent disc with migration of the fragment |
| Vertebral (Modic) Endplate Changes | |
| Type I (Fig. 20-12) | Represents edema or granulation tissue; appears hypointense on T1-weighted images and hyperintense on T2-weighted images |
| Type II (Fig. 20-11) | Represents fat tissue; appears hyperintense on T1-weighted images and mildly hyperintense on T2-weighted images |
| Type III | Represents bone sclerosis and appears hypointense on T1- and T2-weighted images |
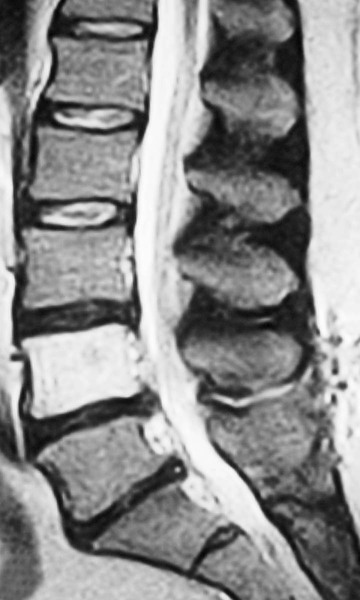
| Juvenile discogenic disease (Scheuermann disease) (Fig. 20-12) | MRI reveals multiple levels of thoracolumbar spine endplate irregularity with Schmorl nodes along with moderate decrease in adjacent disc signal intensity |
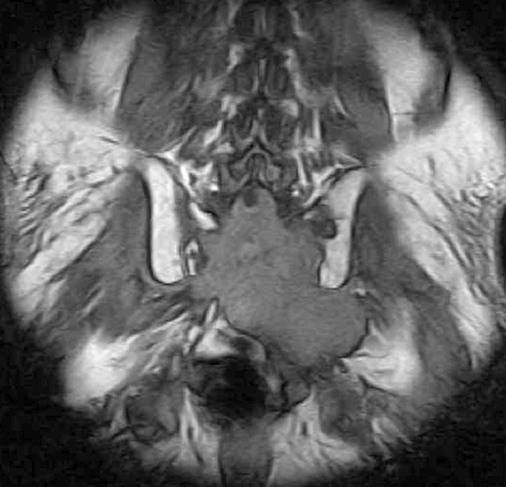
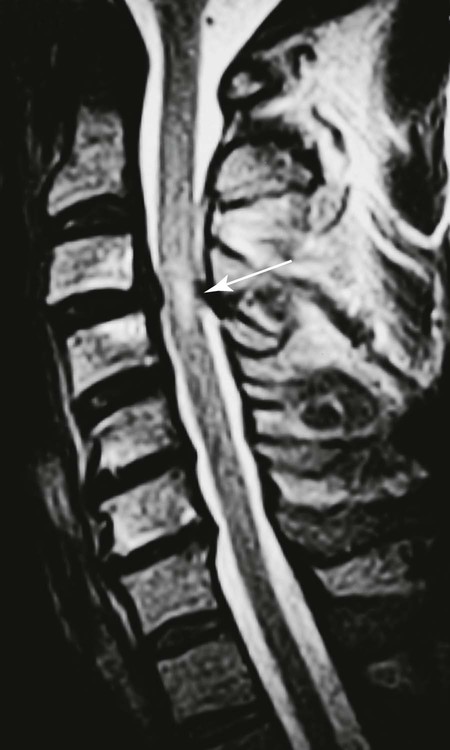
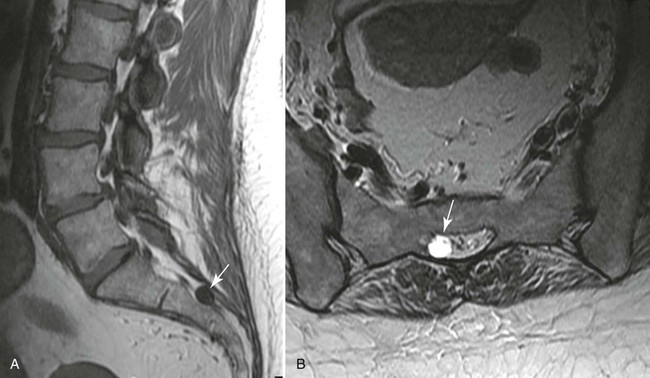
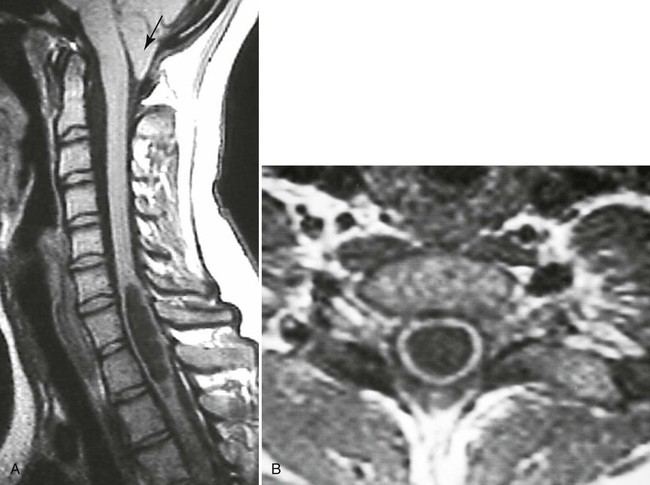
| Spinal canal (Figs. 20-13 to 20-18) | MRI is excellent for imaging the spinal canal; abnormalities such as neurogenic lesions, multiple sclerosis, myelomalacia, dural ectasia, and syringomyelia are noted readily |
MR2 Joints
Most joint lesions are well portrayed with MRI. Tissue contrast with MRI is high, and early changes in marrow, subchondral bone, and cartilage can be evaluated, including arthritis, trauma, infection, and neoplasia. MRI should be considered when a need exists to evaluate internal joint derangement and juxtaarticular pathology or if there is a poor response to conservative management.
MR2a Shoulder
| Disease | Comments |
| Biceps tendon abnormalities (Fig. 20-19) |
Related posts:
Stay updated, free articles. Join our Telegram channel

Full access? Get Clinical Tree


