Recent evidence suggests that vascular permeability and the presence of vascular endothelial growth factor/vascular permeability factor (VEGF/VPF) are important mediators of brain tumor growth in addition to angiogenesis. Perfusion and permeability magnetic resonance (MR) imaging can now measure parameters such as cerebral blood volume and vascular permeability, which can be directly correlated with these histopathologic changes as well as molecular markers such as VEGF. The major techniques currently used in both the clinical and research settings are T1-weighted steady-state dynamic contrast-enhanced MR imaging (DCE MR imaging) and T2∗-weighted first-pass, dynamic susceptibility contrast MR imaging (DSC MR imaging). The advantages and disadvantages of each technique with regard to characterizing tumor biology are discussed in this article. Most clinicians and investigators are currently using the DSC MR imaging T2∗-weighted technique for brain tumor perfusion MR imaging. The existence of multiple approaches to pathologic classification of human glioma implies that there is a lack of consensus among experts as to which is the single best approach. These multiple grading systems do, however, agree on the histologic parameters that are important in the determination of glioma biology, namely hypercellularity, pleomorphism, vascular endothelial proliferation, mitotic activity, and necrosis.
Pathophysiology of brain tumor perfusion and vascular permeability
The effects of vascular endothelial growth factor/vascular permeability factor (VEGF/VPF) and other growth factors on vascular perfusion and permeability have been under investigation since Folkman first described the association of tumoral growth with angiogenesis. Recent evidence suggests that vascular permeability and the presence of VEGF/VPF are important mediators of tumor growth in addition to angiogenesis. Perfusion and permeability magnetic resonance (MR) imaging can now measure parameters such as cerebral blood volume (CBV) and vascular permeability (K trans ), which can be directly correlated with these histopathologic changes as well as molecular markers such as VEGF.
There are several reasons for an increase in regional CBV (rCBV) in gliomas. First, gradient-echo sequences exploit the local paramagnetic susceptibility within the vessel lumen, the vessel wall, and surrounding tissues, resulting in intra- and extravascular spins undergoing reduction of T2∗ signal. Second, pathologic molecular stains such as CD34 demonstrate an increase in the number of tortuous angiogenic vessels, giving the analogy of a “swamp” of numerous, small slow-flowing vessels. This factor is important, as antiangiogenic therapy has been shown to “normalize” these vessels, increasing the diameter and thereby increasing cerebral blood flow (CBF) and decreasing CBV (due to a decrease in overall vessel density); this is further discussed later in this article. In view of this, it is not surprising that rCBV measurements have been shown to correlate reliably with tumor grade and histologic findings of increased tumor vascularity. The degree of vascular proliferation is one of the most critical elements in the histopathologic characterization of tumor biology and determination of prognosis for several reasons. First, the degree of vascular proliferation, or angiogenesis, is one of the most important histologic criteria (along with cellularity, mitosis, pleomorphism, and necrosis) for determination of the degree of malignancy and grade of a glioma. Second, vascular networks are not only the principal route for delivery of oxygen and nutrients to the neoplastic cells but also serve as paths for tumor infiltration along perivascular spaces. Third, the cerebral capillary endothelium (site of the blood-brain barrier, which is composed of a continuous homogeneous basement membrane, numerous astrocytic processes, and tight junctions, and is an important host defense mechanism responsible for the regulation of movement of molecules) is frequently destroyed by malignant tumor cells. Fourth, a hyperpermeable blood-brain barrier associated with or without immature angiogenic vessels allows for contrast agent enhancement, extravasation and, hence, measurement of vascular permeability.
These pathophysiologic changes have been shown to provide good correlation between tumor biology and rCBV, CBF, CBV K trans , and V p measurements. Due to an increase in CBV from microvascular density, as well as many collateral and tortuous vessels (from angiogenesis), it is felt that the mean transit time (MTT) should be prolonged. However, because of the immense heterogeneity of the tumor microvasculature in some regions, MTT may also decrease due to increased CBF, particularly at the tumor margins, where there is rapid shunting of blood flow.
Imaging techniques, pulse sequences, perfusion models, technical pitfalls, artifacts, and limitations
The 2 major techniques currently used in both the clinical and research settings are a T1-weighted steady-state dynamic contrast-enhanced MR imaging (DCE MR imaging) method and a T2∗-weighted first-pass, dynamic susceptibility contrast-enhanced perfusion MR imaging (DSC MR imaging) method. The advantages and disadvantages of each technique with regard to characterizing tumor biology are discussed here; however, most clinicians and investigators are currently using the DSC MR imaging T2∗-weighted technique for brain tumor perfusion MR imaging.
Dynamic susceptibility contrast T2∗ perfusion MR imaging
The most common methods for measurement of DSC MR imaging metrics in brain tumors are the indicator dilution methods for nondiffusible tracers and the pharmacokinetic modeling approach developed by Tofts and Kermode. In DSC MR imaging, the signal measured is due to the susceptibility T2 or T2∗ effect induced by the injected contrast agent.
Indicator dilution theory
The theory of nondiffusible tracer kinetics can be used to derive CBV values from the concentration-time curves. On injection of a contrast agent (gadopentetate dimeglumine), a signal intensity versus time curve is obtained. CBV is proportional to the area under the contrast agent concentration, signal intensity-time curve, in the absence of recirculation and contrast leakage. The gadopentetate dimeglumine concentration is proportional to the change in relaxation rate (ie, change in the reciprocal of T2∗ [ΔR2∗]), which can be calculated from the signal by using the following equation: ΔR2∗ = [−ln(SI t /SI 0 )/TE], where SI t is the pixel signal intensity at time t , SI 0 is the precontrast signal intensity, and TE is the echo time. This equation is valid only if T1 enhancement associated with blood-brain barrier disruption has a negligible effect on signal intensity.
Sequence consideration: spin-echo versus gradient-echo DSC perfusion MR imaging
Gradient-echo sequences are much more sensitive in detecting paramagnetic changes in local magnetic susceptibility between vessels and the surrounding tissue, resulting in intra- and extravascular spins undergoing a reduction of T2∗. The passage of gadolinium through the microvasculature results in changes in both T2 and T2∗ so that both spin-echo and gradient-echo sequences will provide reliable and reproducible CBV measurements.
The advantages of using spin-echo sequences include less susceptibility to artifacts, particularly near the skull base or at brain-bone-air interfaces, and the increased sensitivity to spin-echo perfusion to contrast within the capillaries. It has been demonstrated that spin-echo sequences are mainly sensitive to smaller vessels (<20 μm) and hence may provide more optimal imaging of tumor capillaries. However, gradient-echo sequences seem to be sensitive to both capillary and larger-vessel perfusion. At most institutions, echo-planar gradient-echo imaging provides excellent signal to noise using a standard dose of contrast (0.1 mmol per kilogram of body weight, typically 20 mL of contrast) for brain tumor perfusion studies. Susceptibility artifact can be reduced by reducing slice thickness. The degree of susceptibility effect using 0.1 mmol/kg of gadolinium with gradient-echo sequences is similar in magnitude to using 0.2 mmol/kg with spin-echo sequences. With echo-planar imaging, a new parallel imaging technique, whole brain coverage at 1-second intervals can be achieved using both rapid gradient-echo and spin-echo techniques. Combined spin-echo and gradient-echo techniques can be performed, and this combination can also be used to determine vascular diameter or size, which is important when monitoring antiangiogenic therapy.
First-pass T2∗ DSC MR imaging versus steady-state T1 DCE MR imaging (combined approach)
First-pass pharmacokinetic modeling (FPPM) is used to calculate vascular permeability (K trans ) from the same DSC MR imaging data used to calculate rCBV. FPPM uses an exact expression for tissue contrast concentration, assuming that contrast exists in 2 interchanging compartments (plasma and extravascular, extracellular space).
Due to the complexity of angiogenesis, the accuracy and reproducibility of different perfusion MR imaging techniques for the measurement of vascular permeability has been under discussion recently. The primary issues are that vascular permeability may be “non–flow limited” or “flow limited” and that the first pass of contrast measures only the permeability in the first pass, which is likely to be different to permeability measured in the steady state, where measurement of bidirectional exchange between 2 interchanging compartments (plasma and extravascular, extracellular space) can be characterized.
Cha and colleagues recently compared vascular permeability measurements, K trans using steady-state T1-weighted (ssT1) with a first-pass T2∗-weighted (fpT2∗) MR imaging methods in gliomas and meningiomas. The fpT2∗ K trans was highly correlated with ssT1 K trans in gliomas but not in meningiomas.
Further investigation is likely to demonstrate that there are likely to be 2 types of vascular permeability, very high vascular permeability (which is flow related and can be characterized in the first pass) versus steady-state permeability (which is not necessarily flow limited and more proportional to the surface area product), which may be characterized using steady-state techniques. As a result, some centers, including the authors’, are using both ssT1 and fpT2∗ methods for obtaining perfusion metrics in gliomas. Indeed, there are some inherent advantages to T1 techniques for obtaining perfusion and permeability metrics, such as the ability to estimate fractional blood volume or CBV in the setting of susceptibility from postsurgical blood products or lesions in the temporal lobes or skull base. Three-dimensional T1-weighted dynamic sequences and novel techniques using iterative analysis to estimate permeability and perfusion have been demonstrated.
Technical pitfalls and limitations
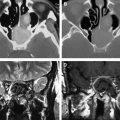
Even though DSC MR imaging is the most commonly used and easily applied technique for studying brain tumor perfusion, there are several important limitations with using a gradient-echo sequence. First, because the technique is weighted to measure susceptibility, it is extremely sensitive to structures of lesions that cause magnetic field inhomogeneity such as blood products, calcium, bone, melanin, metals, or lesions near the brain-bone-air interface, such as the skull base ( Figs. 1 and 2 ).
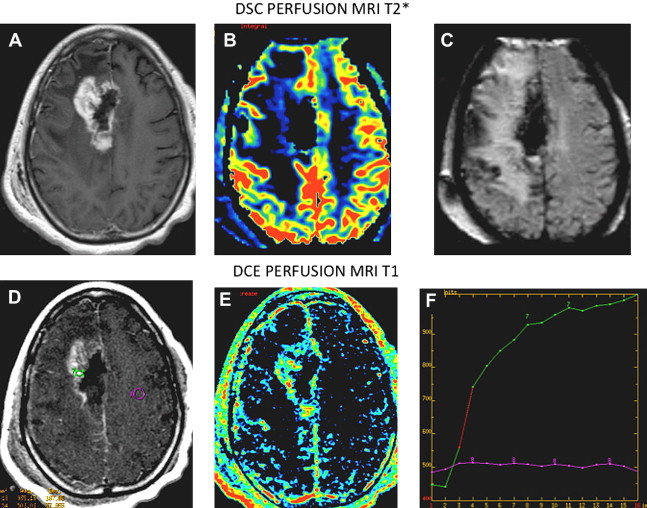
Solutions to reduce the inhomogeneity and susceptibility include decreasing the slice thickness, which also reduces the signal to noise ratio (SNR) and slice coverage. Parallel imaging methods can also reduce both susceptibility and the scan time to allow for more brain coverage and SNR. If there is a larger lesion that requires increased brain coverage, then the interslice gap can be increased while maintaining thinner slices to reduce susceptibility. Second, as discussed earlier, the quantification of perfusion metrics such as CBV and K trans can be inaccurate in lesions where there is a very leaky blood-brain barrier, such as glioblastoma multiforme, choroid plexus tumors, and meningiomas. Therefore, extremely low or high perfusion values must taken with caution. Correction algorithms can be applied to compensate for leakiness. When confined to the intravascular space, paramagnetic contrast agents produce low signal intensity on T2-weighted scans that occur over a dynamic first-pass injection. However, because gadolinium/diethylenetriamine pentaacetic acid (Gd-DTPA) is also an effective T1 relaxation enhancer, the susceptibility contrast signal intensity loss can be masked by signal intensity increase in regions where T1 effects are significant. This situation occurs in enhancing tumors, where Gd-DTPA extravasates into the interstitial space of lesions with significant blood-brain barrier breakdown. In such instances, rCBV will be underestimated, which may affect tumor grade prediction ( Fig. 3 ). Preloading with a small dose of contrast (which can also serve to produce T1 steady-state permeability maps) along with gamma variate, and linear fitting and baseline correction to correct for this leakage will improve accuracy of rCBV estimations. Extreme tumor leakiness can cause rCBV to be greatly underestimated or overestimated using DSC MR imaging techniques. This divergence will impact on the qualitative appearance of rCBV maps and the estimation of rCBV. Paulson and Schmainda recently demonstrated the importance of preloading with a small dose of gadolinium to reduce the error caused by extremely leaky lesions. As a result, at the authors’ institution 2 separate injections are performed. A smaller initial injection of 5 to 7 mL of gadolinium also acquires T1 steady-state DCE MR imaging permeability data; this also serves as a preloading dose for the second injection whereby the DSC MR imaging perfusion data are acquired.
Clinical applications of perfusion MR
Primary Gliomas
Histologic grading limitations with neuropathology and World Health Organization classification in measuring tumor angiogenesis with CBV, CBF, and permeability
The existence of multiple approaches to pathologic classification of human glioma implies that there is a lack of consensus among experts as to which is the single best approach. These multiple grading systems do, however, agree on the histologic parameters that are important in the determination of glioma biology, namely hypercellularity, pleomorphism, vascular endothelial proliferation, mitotic activity, and necrosis.
There have been numerous publications demonstrating the relatively low reproducibility of this system. Coons and colleagues demonstrated that 4-observer concordance is 52%, 3-observer concordance is 60%, and after 3 common reviews and agreement on pathologic features, the 4-observer concordance improved minimally to 69% and 3-observer concordance to 75%. Furthermore, there are other issues affecting pathologic reproducibility that must also to be considered. (1) Because only a few small samples of tissue are assessed, particularly from stereotactic biopsy, the most malignant portion of a tumor may not be sampled. (2) It may be difficult to obtain a range of samples if the tumor is inaccessible to the surgeon (in eloquent brain). (3) There are numerous classification/grading systems used between different institutions. (4) The dynamic nature of central nervous system (CNS) tumors, with at least 50% dedifferentiating into more malignant grades.
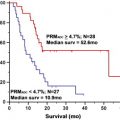
Despite these shortcomings, the World Health Organization (WHO) classification scheme remains the standard reference for guiding therapy and predicting prognosis in patients with brain tumors. Law and colleagues recently compared the value of rCBV measurements in predicting tumor biology ( Fig. 4 ), using patient outcome as the gold standard. In this study, patients with the histopathologic diagnosis of high-grade gliomas (HGGs) and low-grade gliomas (LGGs) (from stereotactic biopsy and resection) were stratified into 2 groups based on rCBV. The Kaplan-Meier curve demonstrated that progression-free survival within the LGG group with (rCBV <1.75) and (rCBV >1.75) rCBV groups (solid lines in Fig. 4 ) was significantly different ( P <.0001). When comparing HGGs (broken lines in Fig. 4 ), similarly there was a significant difference in progression in HGGs with high (rCBV >1.75) versus low rCBV ( P <.0001). Lesions with low baseline rCBV (<1.75) demonstrated stable tumor volumes when followed over time ( Fig. 5 ), and lesions with high baseline rCBV (>1.75) demonstrated progressively increasing tumor volumes over time ( Fig. 6 ). These results demonstrate that perhaps rCBV measurements from DSC MR imaging may overcome some of the limitations of the current histologic methods to provide an additional prognostic factor for tumor biology.
Several studies have demonstrated that rCBV measurements have clinical utility in glioma grading. Comparison of rCBV measurements between LGG and HGG has demonstrated LGG to have maximal rCBV values of between 1.11 and 2.14, and HGG to have maximal rCBV values of between 3.54 and 7.32. A larger study (n = 160) demonstrated LGG to have rCBV values of 2.14 and HGG to have rCBV values of 5.18 ( Figs. 7 and 8 ).
DSC MR imaging increases the sensitivity and predictive value in predicting glioma grade compared with conventional contrast-enhanced MR imaging. In clinical practice, 95% to 100% sensitivity has been reported for differentiating HGGs from LGGs using thresholds of 1.75 and 1.5 for rCBV, respectively ( Fig. 9 ). In the same studies, 57.5% to 69% specificity can be achieved using the same threshold values. Law and colleagues reviewed 160 glioma patients, of whom 120 were HGGs and 40 were LGGs. The relatively lower specificity is due in part to the high number of false positives. Several LGGs with elevated rCBV can be misclassified as HGGs, giving more false positives.
The role of VEGF, also known as VPF, as a mediator of tumor growth and angiogenesis has also resulted in several investigators demonstrating a good correlation between vascular permeability and glioma grade. It seems clear, however, in part due to the heterogeneity of glioma vasculature, that the regions of increased rCBV are spatially heterogeneous and different to areas of increased permeability.
The dynamic nature of CNS tumors, with at least 50% dedifferentiating into more malignant grades, is well known and for some neurosurgeons, if one allows enough time, all low-grade tumors will progress to high-grade tumors. What is still unknown is how, when, and why a dormant (silent) tumor becomes aggressive. A very important concept related to the tumoral progression is the “angiogenic switch.” This concept refers to the transition of an avascular tumor to an angiogenic one, and represents a distinct step in the malignant transformation of gliomas. Overexpression of angiogenic factors or hypoxia results in the production of certain growth factors and cytokines that ultimately induce angiogenesis in gliomas.
Danchaivijitr and colleagues recently demonstrated that in transforming LGG, DSC MR imaging perfusion imaging can demonstrate significant increases in rCBV up to 12 months before contrast enhancement is apparent on T1-weighted MR images. This result indicates that an increase in microvascular density occurs well in advance of blood-brain barrier leakage reflected by pathologic contrast enhancement. rCBV increase is therefore likely to provide an earlier noninvasive indicator of malignant progression, and may likely indicate this “angiogenic switch” ( Fig. 10 ).
Guiding stereotactic biopsy and radiosurgery
The rationale for using perfusion MR imaging to guide stereotactic brain biopsy is again based on the utility of these techniques in defining the most vascular regions of the tumor. Most biopsies are guided with contrast-enhanced T1-weighted MR or computed tomography images, which only reflect blood-brain barrier disruption and may not indicate the most malignant or vascular region of the tumor. Often the region of highest vascularity and hence malignancy is found within the region of T2 signal abnormality and not necessarily within the region of contrast enhancement ( Figs. 11 and 12 ).
Therapeutic monitoring
- –
Therapy-induced necrosis and recurrent tumor
- –
Chemoradiation-induced pseudoprogression
- –
Antiangiogenesis therapies, surrogate biomarker
The differentiation of therapy-induced necrosis (radiation or chemotherapy) from recurrent or residual tumor is challenging, from a clinical point of view and also from conventional MR imaging. Unfortunately, most of the time in clinical practice and also at histopathology, both of these entities coexist. After all, it is primarily in the setting of residual tumor that the patient is receiving adjuvant radiation or chemotherapy.
Delayed radiation necrosis (DRN) is histopathologically an occlusive vasculopathy that results in “strokelike episodes.” Endothelial proliferation can be seen in the early phase of DRN (which may represent “pseudoprogression”—see later discussion); this usually results in obliteration of the vessel lumen in the later phase. The endothelial injury from radiation leads to fibrinoid necrosis of small vessels, endothelial thickening, hyalinization, and vascular thrombosis. Recurrent tumor, on the other hand, demonstrates vascular proliferation and angiogenesis without vascular luminal obliteration.
Hu and colleagues recently published a paper in which they studied 13 patients with new enhancing lesion in the follow-up of HGGs previously treated with multimodality therapy, correlating the CBV values with tissue specimen. Using an in-house Matlab-based MR perfusion technique, they found that in the radionecrosis group the rCBV values ranged from 0.21 to 0.71 and in the tumor group the values ranged from 0.55 to 4.64. In 8.3% of the tumor group, the rCBV values fell within the radionecrosis group range. These investigators concluded that (rCBV >0.71) predicted tumor growth, whereas (rCBV <0.71) predicted radionecrosis, with approximately 95.9% accuracy.
Sugahara and colleagues previously studied 20 patients with new enhancing lesions, and found that all the recurrent tumors presented with CBV values greater than 2.6, whereas the radionecrosis group presented with CBV values less than 0.6. These investigators suggested that patients with CBV values between those numbers should undergo a new modality.
Despite the fact that DSC MR imaging is proving to be a sensitive technique in differentiating DRN from recurrent tumor, to date accurate threshold rCBV values that accurately differentiate radionecrosis from tumor have yet to be published.
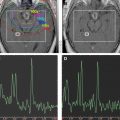
The use of a multiparametric approach that incorporates normalized choline/choline ratio (Cho/Cho(n)) and permeability DCE perfusion studies in the follow-up of these patients certainly adds further diagnostic accuracy. Typically in radioinduced necrosis the vascular permeability (K trans ) is reduced because even though there may be enhancement, the rate of enhancement is typically very slow; pathologically it appears as an occlusive vasculopathy ( Figs. 13–17 ). There will also be a decrease in normalized Cho/Cho(n) compared with the contralateral Cho. On the other hand, in recurrent tumor, the DCE MR imaging T1 steady-state permeability study usually demonstrates a very rapid initial increase in the vascular permeability curve, compatible with a vascular phase then a more steady leakage typical for a highly vascular and highly permeable recurrent tumor (see Figs. 13–15 ; Fig. 18 ). Also, spectroscopy will show an increase in normalized Cho/Cho(n) compared with the contralateral Cho ( Fig. 19 ).


