How to Image Bone Marrow
Imaging of bone marrow has not changed much since the first edition of this book. Screening of marrow with T1 and fat-suppressed T2 images has helped to evaluate marrow processes. Where appropriate, references have been updated, and the text has been modified to include recent advances.
MRI of suspected bone marrow abnormalities should be directed to the site of clinical symptoms or to where abnormalities or confusing findings are present on bone scintigraphy or other imaging studies. The selection of coil, position of patient, planes of imaging, and field of view vary for each site. The parameters generally should be the same as those used for imaging the nearest joint.
When diffuse marrow disease is suspected, a marrow survey of the entire body or, more commonly, of the entire spine, pelvis, and proximal femora is performed. These areas are surveyed because they are where the bulk of hematopoietic marrow (and marrow pathology) exists. The following imaging parameters are for a marrow survey of the spine, pelvis, and proximal femora:
- •
Coils and patient position: For a marrow survey, the patient is supine in the magnet. Spine phased array coils are used for the spine, and the body coil is used for the pelvis and proximal femora.
- •
Image orientation: Sagittal images of the spine and coronal images of the pelvis and proximal femora are obtained.
- •
Pulse sequences and regions of interest: Large field-of-view sagittal T1W images of the cervical and upper thoracic spine and of the lower thoracic and entire lumbar spine are routine. We also use coronal T1W and STIR images of the pelvis and proximal femora. Section thickness in the spine is 4 mm and in the pelvis is 7 mm.
- •
Contrast: IV Gd-DTPA generally serves no useful purpose for routine diagnosis of marrow disorders. It may camouflage the lesions by giving them signal characteristics similar to fatty marrow on T1W images, unless fat suppression is used.
NORMAL MARROW ANATOMY AND FUNCTION ( Box 2-1 )
It is important to understand the function and distribution of normal marrow to be able to diagnose abnormalities and understand how best to image for marrow disease. In simplest terms, bone marrow consists of three components:
- 1.
Trabecular bone
- 2.
Red marrow
- 3.
Yellow marrow
- •
Trabecular bone
- •
Architectural support for red and yellow marrow
- •
Mineral depot
- •
- •
Red marrow
- •
Produces red blood cells, white blood cells, and platelets
- •
- •
Yellow marrow
- •
? Surface/nutritional support for red marrow
- •
Red marrow is the hematopoietically active fraction of marrow that produces blood cells. Yellow marrow is hematopoietically inactive and composed mainly of fat cells, the purpose of which is uncertain. Red and yellow marrow elements are supported by a system composed of reticulum cells, nerves, and vascular sinusoids. The trabecular bone serves as a framework to support the red and yellow marrow elements.
Trabecular Bone
Synonyms for trabecular bone include cancellous, spongy, and medullary bone. It is composed of primary and bridging secondary trabeculae that serve as architectural support and as a mineral depot. The number of trabeculae decreases with age.
Red Marrow ( Table 2-1 )
Synonyms for red marrow are cellular, active, myeloid, or hematopoietic marrow. Red marrow is composed of cellular elements that include erythrocytes (red blood cells), granulocytes (white blood cells), and thrombocytes (platelets), which are responsible for satisfying an individual’s needs for oxygenation (erythrocytes), immunity (granulocytes), and coagulation (thrombocytes). Within islands of red marrow, there is a supporting stroma—the reticulin (or reticulum)—which includes two major groups of cells: phagocytes (or macrophages) and undifferentiated nonphagocytic cells. There is a rich sinusoidal vascular supply in red marrow.
| Red Marrow | Yellow Marrow |
|---|---|
| Rich vascular supply | Poor vascular supply |
| Reticulin stroma | Paucity of reticulin |
| Small fraction of fat cells | Small fraction of red marrow elements |
| Increases if demand for hematopoiesis increases (reconversion) | Increases with age |
Yellow Marrow
Synonyms for yellow marrow include fatty or inactive marrow. The theory for the purpose of fat cells in yellow marrow is that they provide surface or nutritional support for red marrow elements. The vascular supply to yellow marrow is sparse.
For convenience, red and yellow marrow generally are discussed as if they are completely separate entities that exist in precise anatomic locations; however, this is not the case. Red marrow is not composed entirely of hematopoietic cells but always has a significant amount of fat cells scattered throughout the active cellular elements. Conversely, normal yellow marrow is never composed entirely of fat cells but always has some small amount of active cellular elements present. Red marrow is the portion of marrow where the largest concentrations of active cellular elements exist, and yellow marrow is the portion of marrow where fat cells predominate. This composition of marrow elements accounts for the MRI appearance discussed later in this chapter. The fraction of yellow marrow increases with age as trabecular bone resorbs from osteoporosis, and fat fills in the spaces created.
Marrow Conversion ( Table 2-2 )
The amount and distribution of red and yellow marrow change with age. This normal conversion from red to yellow marrow occurs in a predictable and progressive manner and is completed by an individual’s middle 20s ( Fig. 2-1 ). At birth, nearly the entire osseous skeleton is composed of red marrow. When epiphyses and apophyses ossify, they have red marrow within them only transiently, for a few weeks, before conversion to yellow marrow occurs. Conversion of the remainder of the skeleton occurs over the following 2 decades.
| Entire Skeleton (Extremities to Axial Skeleton) | Individual Long Bones (Peripheral to Central) |
|---|---|
| Hands/feet | Epiphyses/apophyses |
| ↓ | ↓ |
| Forearms/lower legs | Diaphysis |
| ↓ | ↓ |
| Humeri/femora | Distal metaphysis |
| ↓ | ↓ |
| Pelvis/spine | Proximal metaphysis |

Conversion from red to yellow marrow proceeds from the extremities to the axial skeleton, occurring in the distal bones of the extremities (feet and hands) first, and progressing finally to the proximal bones (humeri and femora). This process occurs in a roughly symmetric manner on each side in an individual.
Progression of conversion from red to yellow marrow within an individual long bone occurs in the following sequence: epiphyses and apophyses first, then the diaphysis, followed by the distal metaphysis, and finally the proximal metaphysis. Conversion also occurs in a centripetal fashion within a bone, with fat predominating centrally, whereas red marrow predominates at the outer margins or periphery (subcortical region) of the medullary space of flat bones, long bones, and vertebral bodies.
The rate of conversion may vary from one individual to another, but generalities have been established that are important to know ( Table 2-3 ). The reverse process of conversion can occur, called reconversion . This is a process of yellow marrow being reconverted to red marrow when there is an increased demand for hematopoiesis. Reconversion affects marrow in the entire skeleton and in individual long bones in exactly the reverse sequence as conversion.
| Age Group | Marrow Findings | |
|---|---|---|
| Infants (<1 yr) | → | Diffuse red marrow except for ossified epiphyses and apophyses |
| Children (1-10 yr) | → | Yellow marrow below knees and elbows, and in diaphyses of femora and humeri |
| Adolescents (10-20 yr) | → | Progressive yellow marrow in distal and proximal metaphyses of proximal long bones |
| Adults (>25 yr) | → | Yellow marrow except in axial skeleton and proximal metaphyses of proximal long bones |
Variations in Normal Red Marrow ( Box 2-2 )
There are several normal variations in appearance of red marrow that are important to know so as not to misinterpret them as pathology. Variations in red marrow distribution may be confusing.
- •
Amount and distribution vary from person to person but are symmetric in the same person
- •
Persistent curvilinear, subchondral red marrow in proximal epiphyses of humeri and femora
- •
Heterogeneous, focal islands of red marrow
Some individuals have virtually no red marrow in the femora or humeri, whereas others have large amounts; most fall somewhere between these two extremes ( Fig. 2-2 ). Small differences in the amount and distribution of red marrow from side to side are normal, but marked asymmetry is suspicious for a disease process.

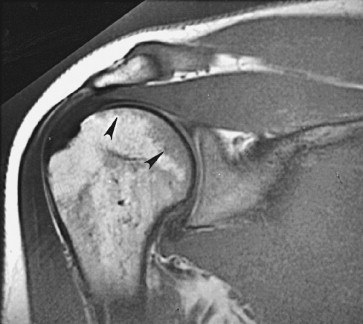
An important and common exception to early and complete conversion in the epiphyses occurs in the proximal humeral and femoral epiphyses, where a small amount of red marrow may persist normally throughout life. This normal epiphyseal red marrow is curvilinear in configuration and located in the subchondral regions of these bones ( Fig. 2-3 ).
Variations in the red marrow pattern commonly are encountered and could be a source of error if not recognized as normal. Heterogeneous patterns of red and yellow marrow distribution occur with isolated islands of red marrow in predominately yellow marrow, or foci of yellow marrow in regions of predominately red marrow. Foci of red marrow are often juxtacortical and located around the periphery of the marrow space ( Fig. 2-4 ). Central foci of yellow marrow within islands of red marrow indicate a benign appearance. Focal islands of conversion to fatty marrow may be the result of chronic stress and biomechanical stimuli causing decreased vascularity at involved sites, which stimulates conversion.
MRI OF NORMAL MARROW
The most important pulse sequence used to evaluate marrow is the T1W–spin echo sequence. T2W and STIR sequences commonly are used also. Gd-DTPA has no apparent effect on normal adult yellow or red marrow; children’s abundant red marrow may show mild enhancement. Red and yellow marrow should be distributed in predictable locations, based on age, as discussed earlier in the section on normal marrow anatomy.
Yellow Marrow
On T1W MR images, yellow marrow has signal characteristics similar to subcutaneous fat, with relatively high signal intensity. On T2W or STIR images, the signal intensity follows that of subcutaneous fat, being relatively intermediate signal intensity on T2W images and completely suppressed and showing low signal intensity on fat-suppressed images (see Fig. 2-2 ).
Fat signal in marrow is interrupted by groups of low signal intensity stress trabeculae. A thin, low signal intensity line where a physeal plate closed (the “physeal scar”) often is evident ( Fig. 2-5 ). Bone islands are oval, low signal intensity regions on all pulse sequences ( Fig. 2-6 ).


Red Marrow
When red marrow exists in enough concentration, it is evident on T1W and T2W images as intermediate signal intensity (see Fig. 2-2 ). On T1W images, it would be lower in signal intensity than yellow marrow and easy to identify. Because yellow and red marrow show intermediate signal intensity on T2W images, they can be difficult to distinguish from each other on this sequence.
On STIR or fat-suppressed T2W images, red marrow shows intermediate signal intensity that is more hyperintense than yellow marrow and similar in appearance to muscle (see Fig. 2-2 ).
An important feature of normal red marrow is that it is always slightly higher in signal intensity than normal muscle or normal intervertebral disks on T1W images (see Figs. 2-2 and 2-6 ). It is never normal for marrow to have lower signal intensity than normal muscle or disk on the same T1W image. The reason red marrow is always slightly higher in signal intensity than muscle or disk on T1W images is because of the normal red marrow composition, where a significant number of fat cells are scattered throughout the red marrow elements, contributing to the higher signal intensity. When red marrow becomes equal or lower in signal intensity than normal disk or muscle on T1W images, pathology is almost certainly present.
Marrow Heterogeneity ( Box 2-3 )
Red and yellow marrow may be either homogeneous or focal in appearance. The focal marrow patterns sometimes are difficult to distinguish from pathology without careful analysis of the location and signal intensity involved. Focal islands of red marrow may have high signal intensity fat centers of a benign nature on T1W images from focal conversion, known as the bull’s-eye appearance . Focal islands of yellow marrow are common in the spine, especially in the posterior elements, around the central venous channels in the vertebral bodies, or adjacent to the end plates of vertebral bodies (see Fig. 2-6 ).
- •
Central venous channels, vertebral bodies
- •
Posterior elements, spine
- •
Vertebral bodies adjacent to degenerated disk
- •
Centrally in islands of red marrow (“bull’s-eye”)
- •
Healed lesion
- •
Hemangioma
- •
Disuse (“aggressive”) osteoporosis
Generally, identification of focal areas of fat within the marrow on MRI should never be a cause for concern. Focal regions of fat in marrow are common in normal marrow or may result from extremely common disease-related alterations, but they never result from anything of a serious nature (see Fig. 2-6 ). Chronic stresses and biomechanical stimuli cause a decrease in the vascularity to specific sites in marrow and stimulate conversion of red to yellow marrow, which probably accounts for many focal areas of conversion to fat. A classic example of this phenomenon occurs in the marrow adjacent to vertebral end plates that border on a degenerated disk. A bandlike focal alteration in marrow signal occurs as a result of the ischemia associated with the disk disease.
Focal areas of red marrow can be particularly difficult to distinguish from pathologic lesions, such as metastases. Articles have been published regarding the use of certain “designer” pulse sequences to try to determine if such lesions are red marrow or not (in-phase and out-of-phase gradient echo imaging and diffusion imaging). The theory behind these sequences is that foci of red marrow have some fat intermixed, whereas neoplasm completely replaces normal marrow, including the fatty elements. On in-phase and out-of-phase gradient echo imaging, the signal contribution of fat and water cycle in and out of phase with respect to each other as the echo time increases. The signal generated from tissue that has fat in it differs from the signal generated from tissue without fat in it. Benign foci of red marrow (which has some fat cells in it) are low signal intensity on the out-of-phase images, whereas neoplasm should be high signal intensity compared with the in-phase images because of the lack of fat in the lesion ( Fig. 2-7 ).

MARROW PATHOLOGY
Abnormalities of bone marrow sometimes have a diagnostic appearance, but they often are nonspecific in their MRI features. It is best to have an approach to the lesions and offer a reasonable differential diagnosis in the many instances where a specific diagnosis is impossible. Five broad categories of marrow disease can be used to facilitate an approach to evaluating the images and forming an appropriate differential diagnosis:
- 1.
Marrow proliferative disorders
- 2.
Marrow replacement disorders
- 3.
Marrow depletion
- 4.
Vascular abnormalities
- 5.
Miscellaneous marrow diseases
Marrow Proliferative Disorders ( Box 2-4 )
Marrow proliferative disorders are considered as benign and malignant diseases that arise from proliferation of cells that normally exist in the marrow. These diseases should be distinguished from the closely related category of marrow replacement disorders, which consists of replacement of normal marrow by implantation of cells that do not arise from normally existing marrow elements.
Arise from existing marrow elements
Diffuse disease, usually; major exception: focal multiple myeloma
Benign
Myelofibrosis
Reconversion
Polycythemia vera
Mastocytosis
Myelodysplastic syndrome
Malignant
Leukemia
Multiple myeloma
Amyloidosis
Waldenström’s macroglobulinemia
MRI
Normal signal and distribution (low tumor burden, higher signal than muscle or disk on T1)
Abnormal signal: Equal or lower than muscle on T1; variable on T2, usually some increased signal
Abnormal distribution: Replacement of yellow marrow
Abnormal signal and distribution
Benign.
Benign marrow proliferative abnormalities include myelodysplastic syndrome, polycythemia vera, myelofibrosis, mastocytosis, and reconversion from yellow to red marrow. Malignant conditions that arise from existing marrow elements are leukemias, multiple myeloma, primary amyloidosis, and Waldenström’s macroglobulinemia. The general MRI appearance of these entities is discussed first, and specifics of some of the diseases are delineated later. Generally, marrow proliferative disorders involve the marrow in a diffuse manner rather than with focal lesions, except for the focal form of multiple myeloma.
MRI of marrow proliferative disorders can have several appearances. First, the normal appearance of marrow on MRI does not eliminate the possibility of a significant marrow disease being present. Proliferation of abnormal cells may be indistinguishable from normal red marrow early in the disease when the tumor burden is low because of the fact that not all fat cells have yet been replaced. This is the situation in about 10% to 20% of patients with multiple myeloma and leukemia, and it is important to understand this weakness of the imaging technique.
The major abnormalities we look for on MRI to indicate a marrow proliferative disease are listed:
- 1.
Abnormal signal intensity
- 2.
Abnormal distribution of what appears to be normal signal intensity red marrow
- 3.
Both abnormal marrow distribution and signal intensity ( Figs. 2-8 and 2-9 )

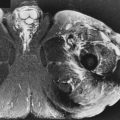
Figure 2-8
Marrow proliferative disorders: mastocytosis. T1 coronal image of the pelvis. The marrow, including the epiphyses and apophyses, is diffusely lower signal than disks and muscle. The spleen is enlarged. The marrow is abnormal in signal and distribution, which is typical of a marrow proliferative disorder. This patient has mastocytosis.

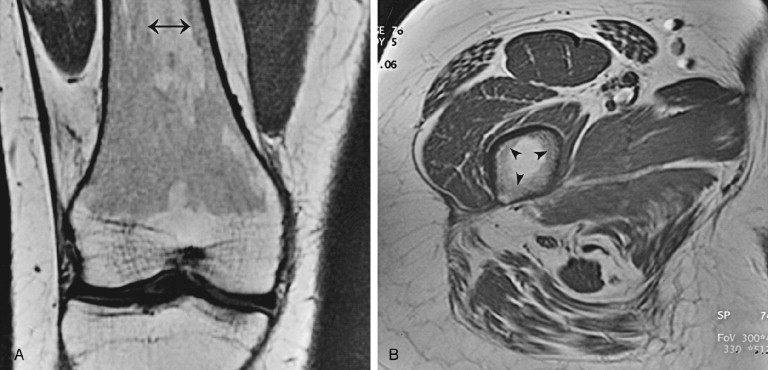
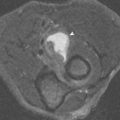
Figure 2-9
Marrow proliferative disorders: reconversion due to sickle cell anemia. A , T1 sagittal image of the knee. The red marrow in the distal femur and proximal tibia of this 27-year-old woman has normal signal that is higher than muscle, but the distribution is abnormal for her age. There also is a low signal serpiginous line in the tibial diametaphysis from osteonecrosis. B , T1 coronal image of the pelvis. The signal of the marrow in the spine is lower than disk, and in the femora and pelvis it is equal to or lower than muscle. These findings are from reconversion from yellow to red marrow in response to sickle cell anemia. The linear signal in the left femoral head is from osteonecrosis.
Only if there is an abnormal distribution of what appears to be red marrow can the disease be diagnosed on MRI before the signal intensity becomes abnormal. Conversely, only if the signal intensity is abnormal compared with normal red marrow can the disease be diagnosed if there is a normal red marrow distribution. As abnormal numbers of cells continue to proliferate, fat cells in the marrow are replaced, and the signal intensity becomes equal to or lower than muscle or disk on T1W images. The cells appear in areas where red marrow should not exist for the age of the patient (distal femora or humeri, diaphyses of long bones, below the knee or elbow, in epiphyses or apophyses along the central venous channels in the vertebral body). Increased cellular elements generally lead to STIR or T2W images showing increased signal intensity relative to muscle.
A potential pitfall when imaging marrow abnormalities occurs when evaluating a FSE sequence without fat suppression. The increased signal of the pathologic marrow-based process on fast spin echo sequence can blend into the background mixture hematopoietic marrow, allowing the process to be overlooked. This is due to the fact that on fast spin echo imaging, both fluid and fat can be of increased signal intensity. Careful evaluation of T1W images and fat-suppressed images should assist with this potential pitfall ( Fig. 2-10 ).

Several of these diseases alter the appearance of the marrow for reasons other than proliferation of the abnormal cellular elements, and the MRI appearance may vary. When the cells proliferate, they replace normal marrow elements and cause induction of reconversion from yellow to red marrow to increase hematopoiesis; reconversion affects the appearance of marrow in ways indistinguishable from proliferation of cells from other benign or malignant causes. Also, some of the marrow proliferative disorders, such as mastocytosis and myelofibrosis, stimulate fibrosis of the reticulin of the marrow, and sclerosis of adjacent trabecular bone occurs, which results in extremely low signal intensity on all pulse sequences. Finally, some patients have hemolysis (eg, sickle cell anemia and thalassemia) and develop hemosiderosis, which causes diffuse, very low signal intensity (black) in marrow from deposition of hemosiderin.
Reconversion of Yellow to Red Marrow ( Box 2-5 ).
If existing red marrow cannot meet an individual’s needs for hematopoiesis, hyperplasia of red marrow elements occurs in exactly the reverse sequence in which conversion from red to yellow marrow occurred during normal maturation ( Fig. 2-11 ). Marrow reconversion starts in areas that are predominantly red marrow and progresses to areas that are predominantly yellow marrow. Regarding the progression of changes in the entire skeleton, the axial skeleton undergoes red marrow hyperplasia earliest, followed by the peripheral (appendicular) skeleton. The humeri and femora are affected before the bones of the forearm and lower leg. In an individual long bone, marrow reconversion first affects the proximal metaphysis, followed by the distal metaphysis and then the diaphysis. If there is an extreme need to recruit red marrow in response to an increased demand for hematopoiesis, the epiphyses and apophyses of long bones convert to cellular red marrow.
Increased Demand for Hematopoiesis
- •
Incidental finding, obese women
- •
Hemolytic anemias (sickle cell, thalassemia, sports)
- •
Increased oxygen requirements
- •
High altitudes
- •
High-level athletes
- •
- •
Replacement/destruction of normal red marrow from marrow proliferative or replacement disorders
- •
Granulocyte colony-stimulating factor given as part of chemotherapy

MRI of marrow reconversion shows an abnormal distribution of marrow signal, with replacement of areas expected to be composed of yellow marrow by focal or diffuse areas of red marrow that have signal characteristics identical to normal red marrow (see Fig. 2-9 ). If red marrow hyperplasia is massive, the signal intensity is abnormal and isointense or even lower signal than muscle and disk on T1W images because of near-complete replacement of all fatty elements in the marrow.
An increased demand for hematopoiesis may exist in circumstances of replacement or destruction of normal red marrow by diffuse marrow proliferative disorders or marrow replacement disorders. It also may be seen in severe anemias, such as sickle cell anemia and thalassemia from hemolysis; in high-level athletes with increased oxygen requirements (marathon runners); in high altitudes; or as an incidental finding, usually in obese female smokers. Hematopoiesis also is stimulated by administration of human hematopoietic growth factors in patients being treated with high-dose chemotherapy.
Mild marrow reconversion as an incidental finding in women who are obese (and who are often smokers) is probably the most common cause of marrow reconversion seen on MRI. The proposed theory for this incidental marrow expansion is that these patients have a leukocytosis, possibly on the basis of chronic bronchitis, which may cause recruitment of myeloid elements in marrow. These women are of menstruating age, and this may contribute to the increased requirement for red marrow hyperplasia.
Sickle cell anemia results in an altered configuration of the red blood cells, preventing them from flowing through small vessels, which causes vascular obstruction and tissue infarction. The two MRI features of sickle cell anemia in the marrow are those of reconversion with red marrow hyperplasia and bone infarction ( Box 2-6 ; see Fig. 2-9 ). Other severe anemias, such as thalassemia, cause identical changes as sickle cell anemia regarding marrow reconversion, but bone infarctions are not typical.
Related posts:

Stay updated, free articles. Join our Telegram channel

Full access? Get Clinical Tree


