Abstract
Currently, the most common method of measuring treatment response in malignancy use size measurements on CT and magnetic resonance (MR). However, metabolic changes in tumors, measurable by FDG PET/CT, are often more rapid and more profound than anatomic changes measurable on CT or MR. It is important to have a framework for how response to treatment is measured on FDG PET/CT. For lymphoma, the current standard is the Lugano Classification and its five-point scale. For solid tumors, is current standard is PERCIST–Positron Emission Tomography Response Criteria in Solid Tumors.
Keywords
FDG, PET/CT, treatment response, Lugano criteria, PERCIST
Currently, the most common method of measuring treatment response in malignancy uses size measurements on computed tomography (CT) and magnetic resonance (MR). However, metabolic changes in tumors, measurable by 18F-fluorodeoxyglucose positron emission tomography (FDG PET)/CT, are often more rapid and more profound than anatomic changes measurable on CT or MR. Although changes in size following effective treatment may take months to manifest on CT or MR, reductions in FDG avidity are often apparent after days or weeks. And for some tumors, such as gastrointestinal stromal tumors, there may even be an increase in size following effective therapy. Thus decreases in FDG avidity may be far more accurate than tumor sizes for assessment of treatment effectiveness. As this knowledge becomes more widespread, the use of FDG PET/CT for determining response or progression during treatment is rapidly growing.
It is important to have a framework for how response to treatment is measured on FDG PET/CT. For lymphoma, the Lugano Classification and its five-point scale are described in Chapter 21 . This has been widely accepted and used in clinical practice and clinical trials. Measuring treatment response with FDG PET/CT in solid tumors is somewhat less clear. There is significant variability in the extent of FDG avidity reduction needed to predict successful outcomes for different solid tumors. Nevertheless, some standardization is needed. The current standard is PERCIST—Positron Emission Tomography Response Criteria in Solid Tumors.
PERCIST defines four categories of treatment response, overly simplified here:
- 1.
Complete metabolic response (CMR)
- A.
Decrease in FDG avidity of all tumor lesions to background AND
- B.
No new tumor lesions
- A.
- 2.
Partial metabolic response (PMR)
- A.
Decrease in FDG avidity of 30% or more from baseline measurements AND
- B.
No new tumor lesions
- A.
- 3.
Stable metabolic disease (SMD)—not CMR, PMR, or progressive metabolic disease (PMD).
- 4.
PMD
- A.
Increase in FDG avidity of 30% or more from baseline measurements OR
- B.
Increase in extent of FDG avidity (bigger tumor) OR
- C.
New tumor lesions
- A.
How is FDG avidity measured in PERCIST? Standard in PERCIST is SULpeak, which is the standardized uptake volume (SUV) normalized by lean body mass in a sphere with 1 cm 3 volume in the most avid portion of the tumor. However, PERCIST criteria could be used with other quantitative measurements, such as the more commonly used SUVmax, the SUV normalized by body weight for the single most avid voxel within the region of interest (ROI). Lean body mass provides less variance of measurement than body weight in patients if their weight is changing. The peak 1 cm 3 sphere provides less variance than does SUVmax when there is more noise in the images. However, SUVmax is so highly reproducible and easy to calculate that it is currently the most commonly used measure of FDG avidity in clinical practice.
How many lesions are measured? PERCIST is designed for use of the single, most avid lesion in each scan, although up to five lesions may be measured. If multiple lesions are selected, PERCIST does not define how to combine the data from multiple lesions.
Does a CMR mean that SUV reduces to zero? No. Remember that normal body structures such as the blood pool and liver have an SUV above zero; thus it is highly unlikely that a tumor will reduce to an SUV of zero. A reduction in the SUV of tumors to equal to or less than the level of a normal structure background, either the liver or local blood pool background, is adequate for a CMR.
Is a 30% reduction or 30% increase representative of a change in the tumor? To the best of our knowledge, the answer is yes. SUV is not as precisely reproducible as size measurements and thus is often referred to as “semiquantitative” (see Table 2.2). If you perform an FDG PET/CT in the same patient on 2 consecutive days, you may get slightly different SUVs. Biologic and technical factors often result in a 10% to 20% difference in SUV even if there is no change in the tumor. Thus a 30% change in SUV between two scans appears highly likely to represent a true change in the tumor metabolism.
Do all FDG-avid findings represent tumor? No. As we have seen throughout this book, there are multiple FDG-avid findings that are benign. Benign findings may be more FDG avid than the malignancy on an FDG PET/CT scan. Thus it is critical to carefully distinguish malignancy from the multiple FDG-avid physiologic and inflammatory processes that may complicate an FDG PET/CT.
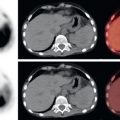
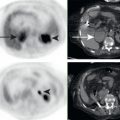
It takes some practice to apply PERCIST criteria in daily practice. Examples of CMR are shown in Chapter 3 , Figs. 3.6 and 3.7 . In both of these cases there are FDG-avid lesions at baseline which decrease to local background following treatment. Fig. 3.6 is particularly impressive because this may be interpreted as new osseous lesions by CT and thus progressive disease; however, the reduction of FDG avidity to background demonstrates this is much better classified as a CMR by PERCIST. Note that in both of these examples the FDG avidity did not decrease to zero. There is some residual FDG avidity that is indistinguishable from background. For example, in Fig. 3.7 , SUVmax values for osseous metastases before treatment were up to 14 and after treatment reduced to 1.2. The residual SUVmax of 1.2 was equal to background, and thus this represents a CMR. These are excellent examples of how tumor response measurement by FDG PET/CT may be far superior to measurement by CT.
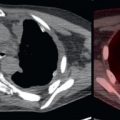
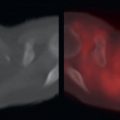
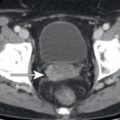
An example of PMR is demonstrated in Fig. 22.1 . This patient with metastatic ductal breast cancer has a dominant sternal mass with extension into the parasternal soft tissues. Following therapy, the SUV of this mass decreased by 36%, consistent with a PMR.