Metabolic, Endocrine, and Crystal Deposition Arthropathies


Metabolic, Endocrine, and Crystal Deposition Arthropathies


An overview of the clinical and imaging hallmarks of the arthropathies associated with metabolic, endocrine, and crystal deposition abnormalities is shown in Table 7.1.


GOUT


Clinical Features

Gout is a metabolic disorder of purine metabolism characterized by recurrent episodes of acute arthritis associated with the presence of monosodium urate monohydrate crystals in the synovial fluid leukocytes and, in many cases, gross deposits of sodium urate (tophi) in periarticular soft tissues. Tophi, a pathognomonic feature of gout, typically form on pressure points in and around the inflamed joints. Serum uric acid concentrations are elevated; however, hyperuricemia does not necessarily lead to gout, and patients with gout may occasionally present with normal serum uric acid levels. Crystal deposits cause acute inflammation of the articular and paraarticular soft tissues, whereas recurrent acute intermittent flares can result in chronic gouty arthritis leading to cartilage and bone destruction.

Gouty arthritis accounts for ˜5% of all arthritides. Four stages of the disease have been recognized: asymptomatic hyperuricemia, acute gouty arthritis, intercritical gout, and chronic tophaceous gout. Articular manifestations occur in the different stages of the disease. Ninety percent of the first gout attacks are monoarticular. The great toe is the most common site of involvement in gouty arthritis; the condition known as podagra, which involves the first metatarsophalangeal joint, occurs in ˜75% of patients. Other frequently affected sites include the ankles, knees, hands, wrists, and elbows. Most patients are men, showing the higher prevalence after the age of 65 years, but gouty arthritis is seen in postmenopausal women as well (men-to-women ratio being 20:1). Recent data from genome-wide association studies (GWAS) show that genetic variants of SLC2A9/GLUT9 were associated with lower serum uric acid levels, and the values were higher among women, and, conversely, genetic variants of protein ABCG2 were associated with higher serum uric acid levels, and the values were higher among men. These studies point to GLUT9 and ABCG2 as being important modulators of uric acid levels and playing important role in the risk of gout.


Hyperuricemia

Uric acid is the end product of catabolism of purine, a component of nucleic acid (DNA and RNA), and because humans lack the enzyme uricase, increased synthesis of uric acid or decreased secretion of uric acid by the kidneys leads to hyperuricemia. In another way, an increased miscible pool of uric acid with resulting hyperuricemia can occur only in two principal ways: first, urate is produced in such large quantities that, even though excretion routes are of normal capacity, they are inadequate to handle the excessive load; second, the capacity for uric acid excretion is critically reduced so that even a normal quantity of uric acid cannot be eliminated.

In 25% to 30% of gouty patients, a primary defect in the rate of purine synthesis causes excessive uric acid
formation, as reflected in excessive urinary uric acid excretion (more than 600 mg/day) measured while the patient is maintained on a standard purine-free diet. Increased production can also be seen in gout secondary to myeloproliferative disorders associated with increased destruction of cells and result in increased breakdown of nucleic acids. Decreased excretion occurs in primary gout in patients with a dysfunction in the renal tubular capacity to excrete urate and in patients with chronic renal disease. In most patients, however, there is evidence of both: uric acid overproduction and diminished renal excretion of uric acid.


Table 7.1 CLINICAL AND IMAGING HALLMARKS OF METABOLIC, ENDOCRINE, AND CRYSTAL DEPOSITION ARTHROPATHIES


Type of Arthritis


Site


Crucial Abnormalities


Technique/Projection


Gout (M > F)


Great toe


Large joints (knee, elbow)


Hand


Articular erosion with preservation of part of joint


Overhanging edge of erosion


Lack of osteoporosis


Periarticular swelling


Standard views of affected joints


Tophi


Dual-energy color-coded CT


CPPD Crystal Deposition Disease (M = F)


Variable joints


Chondrocalcinosis (calcification of articular cartilage and menisci)


Calcifications of tendons, ligaments, and capsule


Standard views of affected joints


Femoropatellar joint


Joint space narrowing


Subchondral sclerosis


Osteophytes


Lateral (knee) and axial (patella) views


Wrists, elbows, shoulders, ankles


Degenerative changes with chondrocalcinosis


Standard views of affected joints


CHA Crystal Deposition Disease (F > M)


Variable joints, but predilection for shoulder joint (supraspinatus tendon)


Pericapsular calcifications


Calcifications of tendons


Standard views of affected joints


Hemochromatosis (M > F)


Hands


Involvement of second and third metacarpophalangeal joints with beaklike osteophytes


Dorsovolar view


Large joints


Chondrocalcinosis


Standard views of affected joints


Alkaptonuria (ochronosis) (M = F)


Intervertebral disks, sacroiliac joints, symphysis pubis, large joints (knees, hips)


Calcification and ossification of intervertebral disks, narrowing of disks, osteoporosis, joint space narrowing, periarticular sclerosis


Anteroposterior and lateral views of spine; standard views of affected joints


Hyperparathyroidism (F > M)


Hands


Destructive changes in interphalangeal joints


Subperiosteal resorption


Dorsovolar view


Dorsovolar and oblique views


Multiple bones


Bone cysts (brown tumors)


Standard views specific for locations


CT, MRI


Skull


Salt-and-pepper appearance


Lateral view


Spine


Rugger jersey appearance


Lateral view


Acromegaly (M > F)


Hands


Widened joint spaces


Large sesamoid


Degenerative changes (beaklike osteophytes)


Dorsovolar view


Skull


Large sinuses


Lateral view


Facial bones


Large mandible (prognathism)


Lateral view


Heel


Thick heel pad (>25 mm)


Lateral view


Spine


Thoracic kyphosis


Lateral view (thoracic spine)


The chance of development of gouty arthritis in hyperuricemic individuals should increase in proportion to the duration and, even more, to the degree of hyperuricemia. Monosodium urate, however, has a marked tendency to form relatively stable supersaturated solutions; therefore, the proportion of hyperuricemic patients in whom gouty arthritis actually develops is relatively low. The clinical development of gouty arthritis in the hyperuricemic subject is also substantially influenced by other factors, such as binding of urate to plasma proteins or the presence of promoters or inhibitors of crystallization.


Examination of Synovial Fluid

A wet preparation of fresh synovial fluid is best for the examination of crystals. Although crystals may often be seen by ordinary light microscopy, reliable identification requires polarization equipment. The identification of the crystals by polarized light microscopy requires a polarizing microscope with a compensating first-order red filter. With the red filter in position, the crystals in the synovial fluid should be aligned so that their long axis is parallel to the line that is drawn on the compensating filter, which is the axis of slow vibration. This allows differentiating between urate and pyrophosphate crystals—characteristics of gout and CPPD, respectively. Because both types of crystals are birefringent, they refract the polarized light that passes through them. The birefringence phenomenon is caused by the refractive index for light, which vibrates either parallel or perpendicular to the axis of the crystal being viewed. Color is the key to negative or positive birefringence. Sodium urate crystals are usually needle shaped and exhibit strong negative birefringence, and they appear bright yellow when the longitudinal axis of the crystal is parallel to the axis of slow vibrations of the red compensator of the polarizing system, but they appear blue when perpendicular (see Figs. 1.11 and 1.12). Conversely, calcium pyrophosphate dihydrate crystals are usually rhomboidal and exhibit weakly positive birefringence, appearing blue and less bright than urate crystals when their long axis is aligned with the line on the compensating filter (see Fig. 1.10).

Monosodium urate crystals, the pathogens of gouty arthritis, range in length from 2 µm to 10 µm and are found within synovial leukocytes or extracellularly in virtually every case of acute gout, although the likelihood of finding such crystals varies inversely with the amount of time elapsed from the onset of symptoms to the time of examination. Crystals from tophi may be larger.


Figure 7.1Pathology of gouty arthritis. A: Gross specimen of an amputated finger from a patient with gout shows the large chalky white deposits of monosodium urate crystals. B: Sagittal section of the specimen shows the extent of the tophaceous deposit and bone destruction. C: The radiograph of the specimen shows large gouty tophi and articular bone destruction. (From Bullough PG. Atlas of Orthopedic Pathology with Clinical and Radiologic Correlation. 2nd ed. New York, NY: Gower Medical Publishing; 1992, Figs. 11.33, 11.34, and 11.35, p. 11.12.)


Pathology

Prolonged hyperuricemia leads to the accumulation of monosodium urate crystals in the joints and soft tissues, which usually results in the formation of nodular masses known as tophi. The accumulation of the crystals within bone marrow and articular cartilage induces a chronic inflammatory reaction with consequent bone resorption and erosions (Fig. 7.1). The chalky tophi consist of large deposits of crystal surrounded by highly vascularized inflammatory tissue rich in mononuclear histiocytes, fibroblasts, and giant cells (Fig. 7.2). The synovium of a joint affected by acute gout shows villous hyperplasia and synoviocyte hypertrophy and hyperplasia. The subintima and synoviocyte layer are heavily infiltrated by large number of polymorphonuclear leukocytes and fewer macrophages and lymphocytes.


Imaging Features

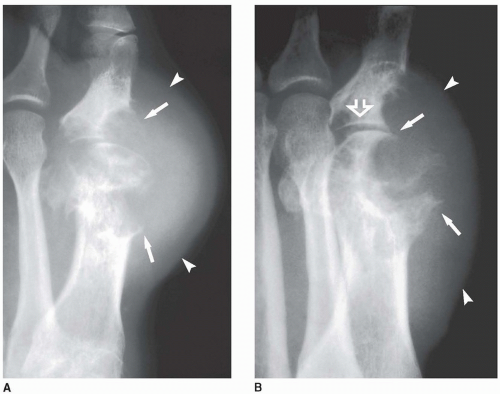
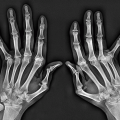
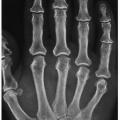
Gouty arthritis has several characteristic imaging features. Erosions, which are usually sharply marginated, are initially periarticular in location (Fig. 7.3) and are later seen to extend into the joint (Fig. 7.4); an “overhanging edge” of erosion is a frequent identifying feature (Figs. 7.5, 7.6, 7.7). Occasionally, intraosseous defects are present secondary to the formation of intraosseous tophi (Figs. 7.8 and 7.9). Usually, there is a striking lack of osteoporosis, which


helps differentiate this condition from rheumatoid arthritis. The reason for the absence of osteoporosis is that the duration of an acute gouty attack is too short to allow the development of the disuse osteoporosis so often seen in patients with rheumatoid arthritis. If erosion involves the articular end of the bone and extends into the joint, part of the joint is usually preserved (Fig. 7.10A, see also Fig. 7.5). Unlike rheumatoid arthritis, periarticular and articular erosions are asymmetric in distribution (Fig. 7.11). In chronic tophaceous gout, monosodium urate crystal deposit in and around the joint is seen, creating dense masses in the soft tissues called tophi, which frequently exhibit calcifications (Figs. 7.12, 7.13, 7.14, 7.15, see also Figs. 7.1 and 7.2). Characteristically, tophi are randomly distributed


and are usually asymmetric; if they occur in the hands or feet, they are more often seen on the dorsal aspect (Fig. 7.16). Currently, dual-energy CT (DECT) color-coded images can accurately depict gouty tophi (Figs. 7.17, 7.18, 7.19, 7.20, see also Figs. 2.27 and 2.28). DECT has ability to extract information and characterize the chemical composition of material according to the differential x-ray photon energy-dependent attenuation of compounds being examined at two different energy levels. Reported sensitivity of this technique varies between 78% and 100% and specificity between 89% and 100%. Magnetic resonance imaging is also an effective way to detect articular and soft tissue abnormalities of gouty arthritis. Tophaceous gouty deposits exhibit a wide spectrum of signal intensities characteristics, which reflects their variable composition and relative proportion of protein, fibrous tissue, crystals,


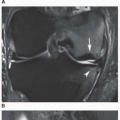
and hemosiderin. Most lesions are isointense relative to muscle on T1-weighted images, and low-to-intermediate heterogeneous signal intensity on proton density-weighted and water-sensitive (IR, T2) sequences (Fig. 7.21). There is strong enhancement following intravenous injection of gadolinium, although contrast enhancement of the tophus is variable and depends on the vascularity of the affected synovium and surrounding granulation tissue (Fig. 7.22). Concomitant enhancement of adjacent tendon sheaths, ligaments, muscles, and bone marrow may also be present, reflecting intense inflammatory reaction.


Figure 7.2Histopathology of gouty arthritis. A: Low-power photomicrograph of a portion of the joint shown in Figure 7.1 depicts the erosion of the bone and articular cartilage by an amorphous material (H&E, original magnification ×2.5). B: On slightly higher magnification observe bluish amorphous material surrounded by bundles of dense collagenized tissue and inflammatory cells (H&E, original magnification ×4). C: Same field examined by polarized light demonstrates the birefringence of the crystalline material (H&E, polarize light, original magnification ×4). D: On the higher magnification, note a thin layer of mononuclear and giant cells surrounding the amorphous crystalline deposit, with an occasional sprinkling of chronic inflammatory cells (H&E, polarized light, original magnification ×25). (From Bullough PG. Atlas of Orthopedic Pathology with Clinical and Radiologic Correlation. 2nd ed. New York, NY: Gower Medical Publishing; 1992, Figs. 11.37, 11.38, and 11.39.)


Figure 7.3Gouty arthritis. A: Dorsovolar radiograph of the left hand of a 55-year-old man shows small periarticular erosions at the proximal interphalangeal joints of the index, middle, and small fingers (arrowheads) with associated soft tissue tophi (arrows). B: Dorsovolar radiograph of the left hand of a 51-year-old man shows small periarticular erosions at the proximal interphalangeal joints of the index, middle, and small fingers and at the first metacarpophalangeal joint with associated soft tissue tophi. C: Dorsoplantar radiograph of the left forefoot of a 68-year-old man shows periarticular erosions of the first, second, and third metatarsal heads, as well as at the bases of the proximal phalanges of the great, second, and third toes. Note preservation of the joint spaces.


Figure 7.4Gouty arthritis. A: Dorsovolar radiograph of the left hand of a 43-year-old man with tophaceous gout shows multiple sharply marginated articular and periarticular erosions and soft tissue masses at the proximal interphalangeal joints of the index and middle fingers, representing tophi. B: Dorsovolar radiograph of the fingers of a 70-year-old man with gouty arthritis shows multiple articular and periarticular erosions associated with large tophi (arrows).


Figure 7.5Gouty arthritis. Anteroposterior (A) and oblique (B) radiographs of the right great toe of a 58-year-old man with a 3-month history of gout shows the typical involvement of the first metatarsophalangeal joint. Note the characteristic “overhanging edge” of the erosive changes (arrows), preservation of the lateral portion of the joint (open arrow), and a large tophus (arrowheads).


Figure 7.6Gouty arthritis. Typical para-articular erosions in the distal inter-phalangeal joint of the index finger exhibiting an “overhanging edge” are associated with a large tophus.


Figure 7.7Gouty arthritis. A: Dorsoplantar radiograph of the left foot of a 71-year-old man shows destruction of the second metatarsophalangeal joint exhibiting overhanging edges. B: Oblique radiograph of the left foot of an 80-year-old man shows erosions at the first metatarsophalangeal joint. Observe overhanging edge and preservation of part of the joint.


Figure 7.8Gouty arthritis. Dorsovolar radiograph of both hands of a 60-year-old man shows articular and periarticular erosions. In addition, note the presence of intraosseous defects in the phalanges consistent with intraosseous tophi.


Figure 7.9Gouty arthritis. Radiograph of the index finger of a 65-year-old man shows the intraosseous tophi within the middle and distal phalanges.


Figure 7.10Gouty arthritis. A: Dorsoplantar radiograph of the left foot of a 62-year-old man with a long history of tophaceous gout shows multiple erosions involving the joints of the great and small toes and the base of the fourth and fifth metatarsals. The first metatarsophalangeal joint is partially preserved, a characteristic feature of gouty arthritis. A large soft tissue mass of the great toe represents a tophus. Dorsoplantar radiograph of the left foot (B) and lateral radiograph of the left ankle (C) of a 49-year-old man show numerous articular and periarticular erosions of the midfoot and Lisfranc joint and destruction of the second metatarsophalangeal joint associated with several soft tissue tophi.


Figure 7.11Gouty arthritis. A: Dorsovolar radiograph of the hands of a 64-year-old woman shows the typical asymmetric distribution of periarticular and articular erosions. Note involvement of the carpometacarpal joints of the right hand (arrows), a typical site for gout. B: Dorsovolar radiograph of the hands of a 58-year-old man shows periarticular erosions and soft tissue tophi of the proximal interphalangeal joints of the index, middle, and small fingers of the left hand. There are also tophi at the first and second metacarpophalangeal joints (arrows), but no erosions are present. In the right hand, a soft tissue tophus is seen adjacent to the hamate bone (arrowhead). C: Dorsoplantar radiograph of the feet of a 46-year-old man shows asymmetric distribution of the articular and periarticular erosions, some of them associated with soft tissue tophi.


Figure 7.12Gouty tophi. A: Lateral radiograph of the elbow of a 73-year-old man with a 30-year history of gout shows a tophus with dense calcifications adjacent to the olecranon process, which exhibits small erosion. B: Dorsoplantar radiograph of the right forefoot of a 69-year-old man shows densely calcified prominent tophi at the fifth and first metatarsophalangeal joints (arrows). Note small periarticular erosion at the base of the proximal phalanx of the great toe (arrowhead). C: Lateral radiograph of the right knee of a 60-year-old man shows a large infrapatellar tophus (arrow). There are no articular erosions present, but there is a small suprapatellar joint effusion (arrowheads).


Figure 7.13Gouty tophi. Anteroposterior radiograph of both feet (A) and lateral radiograph of the left foot (B) of a 69-year-old man show numerous gouty tophi (arrows). Note also a characteristic for this arthritis erosion of the first metatarsophalangeal joint of the left foot. C: Radiograph of the great toe of a 54-year-old man shows a large tophus adjacent to the first metatarsophalangeal joint. Note also small erosions at the base of the proximal phalanx and at the medial aspect of the first metatarsal head.


Figure 7.14Gouty tophi. Dorsoplantar radiograph of both feet (A) and dorsovolar (B) and lateral (C) radiographs of both hands of an 81-year-old man show numerous calcified tophi associated with periarticular and articular erosions.


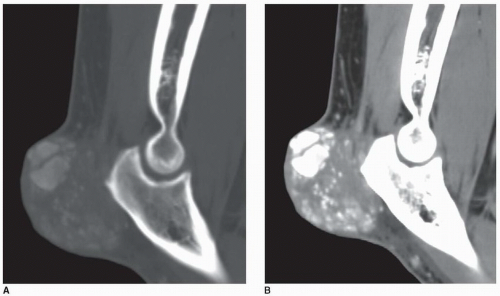
Figure 7.15CT of gouty tophus. Sagittal reformatted CT images of the elbow viewed in bone (A) and soft tissue (B) window show a large soft tissue mass with numerous calcifications adjacent to the olecranon process of ulna.


Figure 7.16Gouty tophus. Dorsoplantar (A) and lateral (B) radiographs of the great toe show articular and periarticular erosions (arrows) associated with a large tophus on the dorsal aspect of the first metatarsophalangeal joint (arrowheads).


Figure 7.17Dual-energy CT of tophaceous gout. A: Merchant view of the left knee of a 68-year-old man shows a radiolucent defect in the medial aspect of the patella (arrow). B: Two dual-energy color-coded axial CT images show a soft tissue, monosodium urate crystal-containing tophus (green foci) eroding medial aspect of the patella.


Figure 7.18Dual-energy CT of tophaceous gout. Anteroposterior radiograph of the right foot (A) of a 48-year-old man shows nonspecific erosion at the third tarsometatarsal joint (arrow), confirmed on the coronal reformatted CT image (B). Dual-energy coronal (C) and 3D reconstructed (D) color-coded CT images show in addition several masses (green areas) representing uric acid crystals within the gouty tophi.


Figure 7.19Dual-energy CT of tophaceous gout. A 50-year-old man presented with painful swollen third toe of the left foot. A: Anteroposterior radiograph shows a para-articular erosion of the proximal phalanx of the third toe (arrow), associated with a fusiform mass (arrowhead). Dualenergy sagittal reformatted (B) and axial color-coded (C) CT images supplemented with 3D reconstructed CT color-coded image (D) viewed from the plantar aspect of the foot were diagnostic of gouty tophi in several locations (green areas).


Figure 7.20Dual-energy CT of tophaceous gout. A: Long-axis CT image of the right foot of a 71-year-old man (same patient as shown in Fig. 7.7A) shows a nonspecific low-attenuation mass in the region of the second toe. Long-axis (B) and sagittal (C) reformatted dual-energy color-coded CT images identify the mass as being a large tophus containing monosodium urate crystals (green area). In addition, several smaller tophi are identified at the site of Lisfranc joint and at the site of Achilles tendon attachment to the calcaneus. Three-dimensional reconstructed dual-energy CT color-coded images viewed from the plantar (D) and medial (E) aspects of the foot better demonstrate the spatial distribution of the urate tophi.

Although imaging findings of gouty arthritis are generally very characteristic and most of the time even pathognomonic, clinical presentation of acute gouty arthritis may be sometimes mistaken for septic arthritis. The two conditions may present with similar symptoms including joint pain, swelling, tenderness, and occasionally similar laboratory findings such as elevated white blood cell count and sedimentation rate. Soft tissue tophi may at times mimic rheumatoid nodules. Intraosseous tophi may have aggressive appearance and thus may simulate malignant bone tumor. On radiography, articular gouty erosions, particularly affecting the proximal and distal interphalangeal joints, may sometimes mimic erosive osteoarthritis. Amyloid infiltrate of the articular structures may cause soft tissue masses accompanied by cystic and erosive lesions indistinguishable from those of gout. Finally, it has to be pointed out that gout may coexist with other arthropathic conditions such as rheumatoid arthritis, osteoarthritis, and infectious arthritis.


CALCIUM PYROPHOSPHATE DIHYDRATE (CPPD) CRYSTAL DEPOSITION DISEASE


Clinical and Pathologic Features

CPPD crystal deposition disease is a metabolic disorder, which is characterized by the accumulation of calcium pyrophosphate dihydrate crystals in intra-articular and periarticular tissues, most commonly within fibrocartilage and hyaline cartilage. In addition, synovial, bursal, ligamentous, and tendinous calcifications are encountered. It rarely presents as a soft tissue mass in extra-articular location, which is known as tumoral or tophaceous pseudogout. The condition may occur as a hereditary or sporadic disorder. Some investigators suggested that a putative pyrophosphate transporter, the progressive ankylosis protein homolog, a protein encoded by ANKH gene, might be responsible for this disease. ANKH may also play a role in modulating the enzymes involved in mineralization, such as alkaline phosphatase, thus potentially contributing to the disease process. The men and women are equally affected; most commonly, patients are middle aged and older. The disease may be asymptomatic, in which case the only imaging finding may be chondrocalcinosis (see text below). When symptomatic, it is called pseudogout. There is, however, a great deal of confusion about these terms, and they are often misused.

In an effort to explain the relationship between chondrocalcinosis, calcium pyrophosphate arthropathy, and the pseudogout syndrome, Resnick has proposed an integration of these terms under the rubric CPPD crystal deposition disease. Chondrocalcinosis, a condition in which calcification of the hyaline (articular) cartilage or fibrocartilage (menisci) occurs, may be seen in other disorders as well, such as gout, hyperparathyroidism, hemochromatosis, hepatolenticular degeneration (Wilson disease), and degenerative joint disease (Table 7.2). Calcium pyrophosphate arthropathy refers to CPPD crystal deposition disease affecting the joints and producing structural damage to the articular cartilage. It displays distinctive imaging abnormalities such as narrowing of the joint space, subchondral sclerosis, and osteophytosis, similar to osteoarthritis. The pseudogout syndrome represents a condition in which symptoms such as acute pain are similar to those seen in gouty arthritis; however, it does not respond to the usual treatment (colchicine) for the latter disease.


Table 7.2 MOST COMMON CAUSES OF CHONDROCALCINOSIS


Senescent (aging process)


Osteoarthritis


Posttraumatic


Calcium pyrophosphate arthropathy (CPPD crystal deposition disease)


Gout


Hemochromatosis


Hyperparathyroidism


Hypophosphatasia


Ochronosis


Oxalosis


Wilson disease


Acromegaly


Idiopathic


Modified from Reeder MM, Felson B, 1975, with permission.


Calcium pyrophosphate crystals, the pathogens in pseudogout, range up to 10 µm in length. As in gout, many intracellular crystals are seen during an acute episode. The colors are usually but not always much less intense than urates, that is, they are weakly birefringent. Pyrophosphate crystals are generally chunkier and often show a line down the middle. The most common form of calcium pyrophosphate crystal is a rhomboid. Pyrophosphate crystals are positively birefringent in that they are blue when the longitudinal axis of the crystal is parallel to the slow vibrations axis of the red compensator and yellow when it is perpendicular (see previous text and Figs. 1.9 and 1.10). Pathologic findings consist of punctate or linear calcium deposits, usually in the hyaline cartilage paralleling the subchondral bone end plate, also referred to as a “subchondral” or “articular” cortex (Fig. 7.23). Punctate calcifications may also be seen in synovial tissue (Fig. 7.24). On microscopic examination, the chalky white deposits appear either crystalline or amorphous. In the vascularized tissue, there is associated inflammatory infiltrate that includes monophages and phagocytic polykaryons. In nonvascularized tissue, no inflammatory reaction is present. The pyrophosphate crystals are distinguished from urate crystals by their rhomboid shape (Fig. 7.25) and by their weakly positive birefringence (see prior text).

Only gold members can continue reading. Log In or Register to continue

Stay updated, free articles. Join our Telegram channel

Oct 1, 2018 | Posted by in GENERAL RADIOLOGY | Comments Off on Metabolic, Endocrine, and Crystal Deposition Arthropathies

Full access? Get Clinical Tree

Get Clinical Tree app for offline access