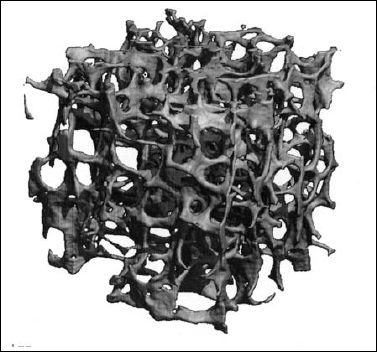
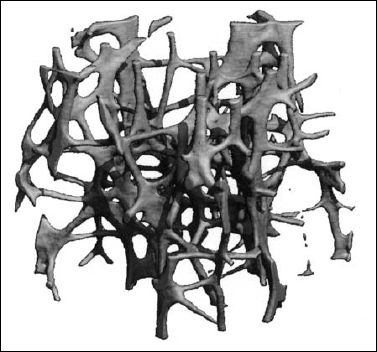
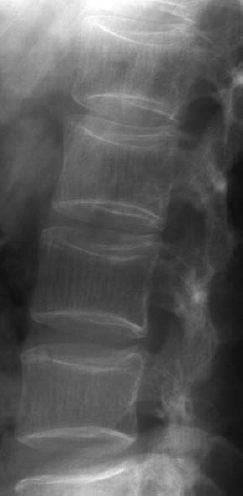
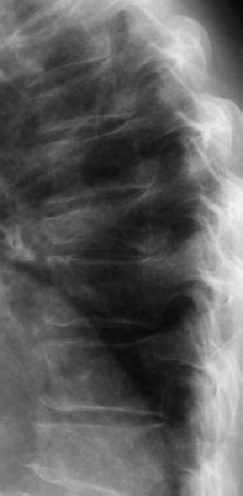
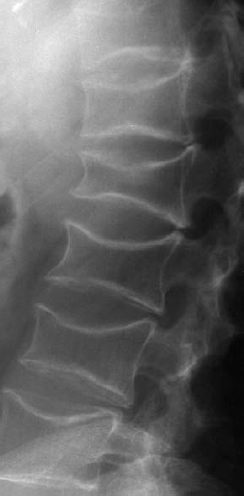
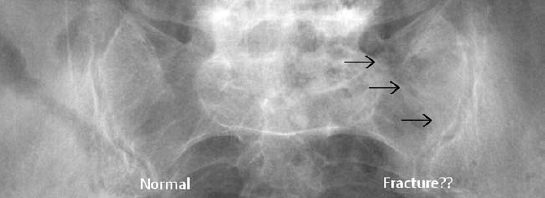
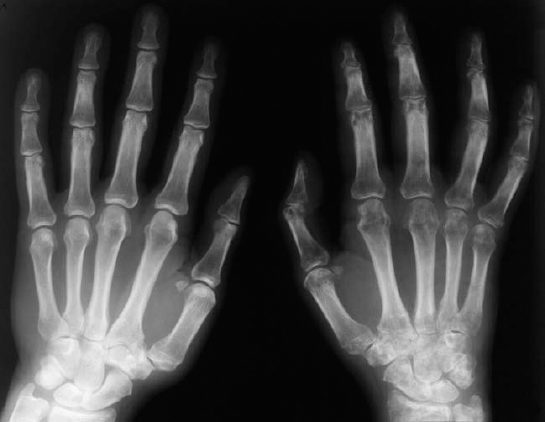
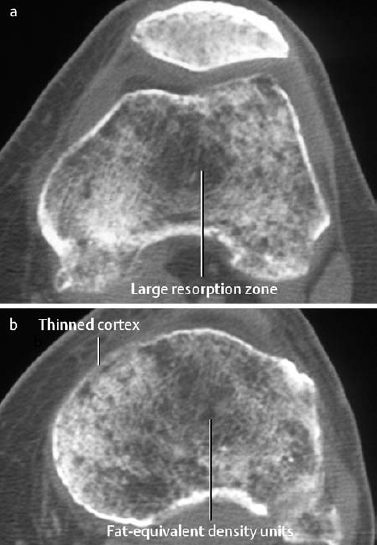
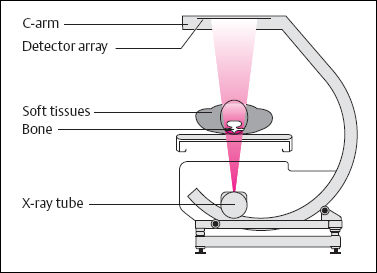
6 Metabolic, Hormonal, and Toxic Osteopathies The microstructure of normal spongiosa primarily consists of trabecular plates that are broadly connected (Fig. 6.1). In osteoporosis, the trabecular plates show deep resorptive lacunae that disconnect the trabeculae, and osteoblasts lack the morphologic substrate for the deposition of new bone. The trabecular plates are gradually reduced to thin rods, which in turn perforate and eventually disappear (Fig. 6.2). At this stage, more and more microfractures and reparative microcallus formation are observed. This process is followed by progressive loss of intertrabecular connections and a corresponding increase in brittleness. Primary Osteoporosis (Idiopathic): Secondary Osteoporosis: Caution! Renal osteodystrophy is a separate clinical entity and, strictly speaking, should not be categorized as a secondary osteoporosis. Clinical screening is important and should include all individuals at risk for osteoporosis. This includes the clinical history (hereditary risk factors, low dietary calcium and vitamin intake, physical inactivity, tobacco abuse, slender constitution, etc.), hormonal status (premature menopause, amenorrhea, masculine hypogonadism, corticosteroid therapy, etc.), and bone densitometry. Peak bone mass is reached at 30–35 years and measures 160 ± 30 mg of calcium HA/ml. The World Health Organization (WHO) has proposed a gradation of the bone mass loss based on densitometry of the lumbar spine in Caucasian women: Fig. 6.2 Senile osteoporosis with thin rod-like trabecule, reduced number of trabecule, and decreased trabecular connections. 3-D CT of block specimen (4 × 4 mm3) with ultra-high resolution. Fig. 6.3 Postmenopausal osteoporosis with marked longitudinal striation caused by accentuated vertical trabecule. Sharply outlined vertebral bodies (‘picture-framing’) are also seen. Fig. 6.4 Wedge-shaped thoracic vertebral body in osteoporosis. Fig. 6.5 Lumbar ‘codfish’ vertebral bodies with biconcave indentation. Extreme accentuation of the vertebral outline is seen. All types of osteoporosis involve the spine more frequently than other skeletal sites. Decrease in bone mass corresponds to a decrease in radiographically detected calcium with an increase in the radiolucency of bone. Radiography does not show decreased bone density until approximately 30% of the bone mass is lost. Consequently, radiography is not appropriate for the early detection of demineralization. Caution: In the vertebral bodies, there is initially attenuation of the horizontal trabeculae and accentuation of the load-bearing vertical trabeculae, resulting in increased longitudinal striation and trabecular thickening on radiography. This so-called ‘hypertrophic atrophy’, which is observed mainly in old age, is attributed to microcallus deposition. The trabecular loss results in accentuation of the cortex of the vertebral body, which exhibits a sharply delineated outline in contrast to osteomalacia. These textural changes produce the so-called ‘picture-frame’ vertebral bodies Figs. 6.3, 6.5 In postmenopausal (Type I) osteoporosis, the fractures tend to involve the vertebral bodies and can even occur without demonstrable decrease in bone density. The vertebral deformities range from subtle indentation of the end plates, wedging, and codfish-vertebra deformity to a complete collapse of the vertebral body (Figs. 6.4,6.5). In addition, intra-vertebral disk protrusion and fractures with intervertebral vacuum phenomenon are observed. The vertebral bodies of the thoracolumbar transition (most frequently T12 and L1) are most commonly involved because of their load bearing. The wedged thoracic vertebral bodies cause an accentuated kyphosis of the thoracic spine. Recent fractures are characterized by increased density along the vertebral end plates (impacted bone substance, reparative callus formation). The differentiation between osteoporotic, traumatic and metastatic vertebral fractures is discussed on pages 52–53. Fractures due to senile (Type II) osteoporosis tend to involve the peripheral skeleton, and typical sites are femoral neck, distal radius, and ribs. In addition, insufficiency fractures can occur in the osteoporotic skeleton, appearing as a band-like sclerosis or radiolucent lines, with or without periosteal reaction. The preferential sites are the spine, sacrum, pelvis (ilium, pubic bone), femoral neck, tibia, and calcaneus (Fig. 6.6). Osteoporosis can produce the following findings in the cortex: Fig. 6.6 Insufficiency fracture of the left sacrum. Confirmation by CT or MRI. Fig. 6.7 Severe patchy osteoporosis of the right hand due to longstanding immobilization in hemiplegia. Fig. 6.8 Moth-eaten osteoporosis in the femoral stump following amputation for osteosarcoma. Fig. 6.9 Senile osteoporosis. Cortical thinning with corresponding enlargement of the marrow space. Many methods have been proposed for measuring the extent of demineralization with radiography. Indices that consider both severity of vertebral deformity and the number of affected vertebral bodies can be helpful to monitor therapy. However, they are all unsuitable for the early diagnosis of osteoporosis. Bone Densitometry: It is the goal of bone densitometry to determine the fracture risk before fractures have occurred. It is used in subjects at risk of osteoporosis or suspected of having increased bone loss. Bone densitometry basically measures bone mineral density and content. The two requirements for this measurement are a representative site and a reliable, reproducible method. Preferred sites are the lumbar spine, proximal femur, distal radius, and calcaneus. For the assessment of fracture risk, the lumbar spine should be measured, since measurements of the peripheral skeleton do not always predict the fracture risk in the axial skeleton. Planar methods (area density in g/cm2): Volumetric methods (quantitative computerized tomography [QCT], true bone density in mg/ml): Quantitative sonography (QUS) Quantitative MRI (QMR) The major criteria for determining the quality of any measurement technique are absolute precision and reproducibility. Which measurement error is more critical depends on the goal of the examination. If an individual measurement is obtained to determine the mineral content of the patient relative to subjects of the same age and sex (early detection, risk analysis), the reliability rests primarily on absolute precision. If the rate of loss is the most important measurement in a specific patient (e.g., for monitoring therapy), reproducibility is the most crucial criterion. To determine a loss rate of 2.5%, the reproducibility error of the method should not exceed 1%. Absorptiometry and computed tomography are the most common methods in widespread use and play a practical role. Both of these are based on the attenuation of the radiation beam passing through the skeleton. Single x-ray Absorptiometry (SXA) This measures the attenuation of an x-ray beam at a peripheral site, most commonly the radius. It is relatively simple and inexpensive but has been abandoned because of suboptimal precision and reproducibility. Dual x-ray Absorptiometry (DEXA) This technique measures the attenuation of an x-ray beam from two energy peaks (Fig. 6.11). Measuring the attenuation of two different energy peaks compared with a standard reference material enables the calculation and subtraction of the soft-tissue component of the x-ray attenuation. This increases the precision of the measured bone density in comparison to single x-ray absorptiometry. Dual x-ray absorptiometry has become the standard method for diagnosing and following osteoporosis and is used to measure the lumbar spine, hip, or distal forearm. In the lumbar spine, erroneous measurements due to overlying calcific structures (calcified aortic plaques, osteophytes), compression fractures, and scoliosis may be encountered, and comparison with current lumbar spine radiographs are important to avoid misdiagnosis. Quantitative CT (QCT) With the gantry appropriately angled, the mid-level of three lumbar vertebrae (usually L1–L3) is scanned, provided they are not fractured. A region of interest is automatically and, consequently, reproducibly placed in the spongiosa of each vertebral body. The bone density is determined by comparing the average of the measured Hounsfield units with the measured Hounsfield units of the known densities of a reference phantom. Single x-ray QCT measures the attenuation at one energy level, and dual x-ray QCT adds a second measurement at another energy level by changing the x-ray tube voltage. Analogous to DEXA, the dual x-ray QCT can eliminate the error introduced by the marrow fat, but places more demand on the software needed for analysis. The advantage of quantitative CT is the selective measurement of a small volume of spongiosa of bone and the simultaneous display of its structure (microcallus, micro calcifications). Extraneous calcifications, such as aortic calcifications, do not present a problem in measuring the bone density. The disadvantage is that the radiation dose delivered is higher than that of DEXA. Practical remark: The report of a QCT should read as follows: The bone mineral density was calculated from representative axial sections of three lumbar vertebral bodies… The absolute bone mineral density averaged over the three vertebral bodies is… mg/ml. This value is… standard deviations below the average in a population of the patient’s age and sex (Z score) and… standard deviations below the peak bone mass of a young adult (T score). Conclusion: No osteoporosis/osteopenia/osteoporosis/manifest osteoporosis.’ (Note: One standard deviation corresponds to 30 mg/ml; consequently, a calcium content of less than 85 mg of CaHA corresponds to osteoporosis.) Peripheral Quantitative CT A small, specially designed unit measures the bone density of the distal radius using the principle of quantitative CT. This method enables clinical follow-up and requires an experienced technologist. Moreover, this method can provide information about the biomechanical property of the bone but alone is unsuitable for establishing the initial diagnosis of osteoporosis. Quantitative Sonography and Quantitative MRI Both of these methods are currently being investigated and are not yet used in clinical practice. Fig. 6.10 Disuse osteoporosis of the knee after trauma. a Femoral condyles, b tibial plateau. The fat-equivalent density in the region of the trabecular resorption is indicative of osteoporosis. Fig. 6.11 Schematic drawing of a DEXA unit.
Osteoporosis
 Osteoporosis is a systemic skeletal disease characterized by low bone mass and microarchitectural deterioration with a consequent increase in bone fragility and susceptibility to fractures (Consensus Development Conference, 1996, Amsterdam). The fractures occur spontaneously or after minor injury. The decreasing bone mass keeps the ratio of mineral content to collagenous matrix unchanged (in contrast to osteomalacia).
 The entire bone mass of the human is composed of 80% cortex and 20% spongiosa. The spongiosa has by far the larger surface and consequently reacts faster to metabolic changes. Physiologic remodeling takes place in small functional units in which osteoclasts and osteoblasts interact.
Classification of Osteoporosis
 Osteoporosis is clinically silent until the appearance of macrofractures. Specific biochemical markers do not exist for primary osteoporosis, but laboratory tests are important for the differential diagnosis of secondary osteoporosis and other low-calcium osteopathies.
 Since the peak bone mass is the same for women and men, the term ‘osteoporosis’ can be defined as a bone mineral content of less than 85 mg CaHA/ml.
 Osteoporosis is characterized by decreased bone density, rarefied trabecular structure, cortical thinning and fractures.
Bone Density
 A decreased bone density is seen not only with osteoporosis, but also with other skeletal diseases. Therefore, it is preferable to use the descriptive term osteopenia until the underlying condition has been found.
Bone Structure
Macrofractures
Cortex
 An osteoporotic appearance that is practically indistinguishable from genuine osteoporosis can be observed in:
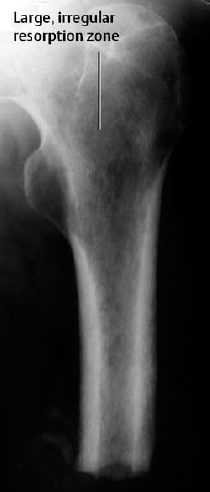
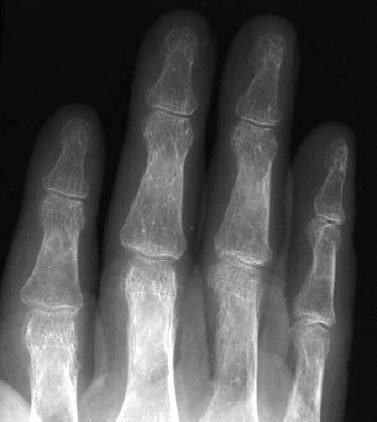
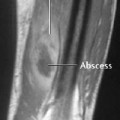
 Osteoporosis occasionally produces a moth-eaten or permeative pattern and can then appear rather ‘malignant’, especially in cases of localized disuse osteoporosis (Figs. 6.8, 6.10). Clinical history and the detection of fat in the bone marrow by CT or MRI usually enables differentiation in radiographically equivocal cases.
x-ray Absorptiometry and Osteoporosis
Types of Bone Densitometry
Technical Principles and Clinical Role of the Various Methods
Rickets and Osteomalacia
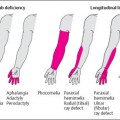
 This is a group of conditions with inadequate mineralization of the osteoid due to vitamin D deficiency or hereditary disorders of vitamin D metabolism. In the growing skeleton, this interferes with the normal development of the growth plates, causing rickets, and in the mature skeleton leads to a delayed mineralization of the spongiosa and cortical bones, causing osteomalacia.
 Calcium metabolism
![]()
Stay updated, free articles. Join our Telegram channel


Full access? Get Clinical Tree


