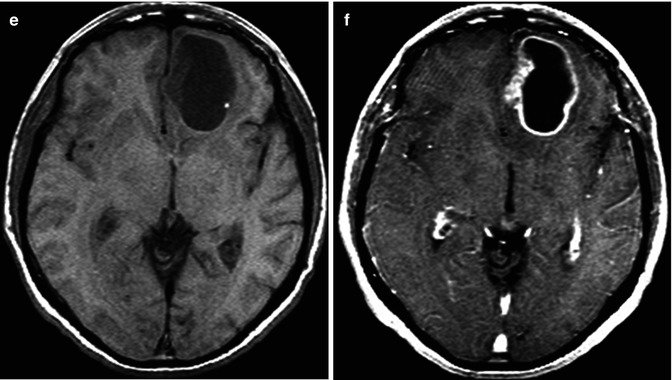
Fig. 26.1
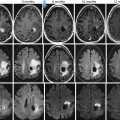
A 74-year-old man presents with a 2-week history of altered mental status. Axial T2WI (a), DWI (b), ADC map (c), FLAIR (d), and pre- (e) and post-contrast (f) T1WI are shown. There is a large necrotic cortical-subcortical lesion located within the left frontal lobe with surrounding edema. This lesion demonstrates a peripheral ring of enhancement. There is no evidence of restricted diffusion from the necrotic component of the lesion. The findings are mainly compatible with a high-grade glial neoplasm or a metastatic lesion. Pathology demonstrated multiple fragments of adenocarcinoma with glandular formations and abundant mucin, consistent with metastatic carcinoma of pulmonary origin
Given the wide spectrum of metastatic lesions, there is a great degree of variability in the imaging appearance. Typically on non-contrast CT, metastatic lesions appear isodense to hypodense relative to cortex. Calcifications can occur in metastatic lesions, particularly those of mucinous descent (frequently reported with colorectal carcinomas). On MRI, lesions most commonly demonstrate T1 isointensity to hypointensity. Internal hemorrhage or paramagnetic properties (as is the case with melanoma) may result in intrinsic T1 shortening (Fig. 26.2). Heterogeneous T2/FLAIR hyperintensity is also a common finding. T2/FLAIR hyperintensity seen within the peritumoral brain parenchyma represents vasogenic edema (Fig. 26.1). After the administration of contrast, metastases typically enhance reflecting breakdown of the blood–brain barrier (Fig. 26.1). The pattern of enhancement is variable. Nodular, ring-enhancing, and heterogeneous patterns of enhancement have been described (Fig. 26.1). Contrast-enhanced MRI is the gold standard for evaluation of metastases. Typically, larger lesions demonstrate ring enhancement, which surrounds a central necrotic core. Such necrosis occurs when tumor growth exceeds its blood supply. Many different disease processes including primary glial tumors and infections can demonstrate ringlike enhancing lesions. History of a primary malignancy (known to metastasize to the brain) and lack of diffusion restriction from the necrotic component of the tumor help suggest the diagnosis of metastasis. The neuropathologist remains the final arbiter in most clinical scenarios.
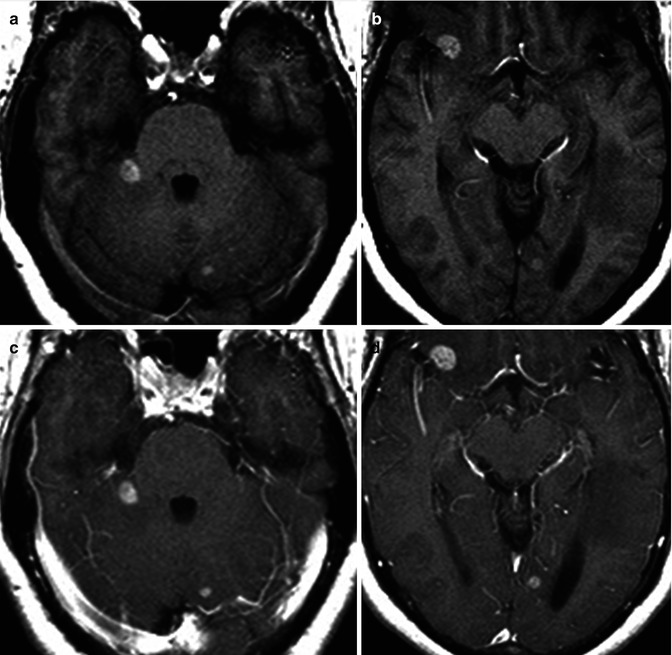
Fig. 26.2
A 41-year-old woman with history of skin melanoma. Axial pre-contrast T1 (a, b) and post-contrast T1WI (c, d) are shown. Multiple T1 bright cortical medullary junction lesions are seen associated with contrast enhancement. Diagnosis: metastatic melanoma
26.2.2 Special Considerations
26.2.2.1 Hemorrhagic Metastases
The incidence of spontaneous intratumoral hemorrhage within a metastatic lesion ranges from 1.4 to 10 % [6]. Generally, any brain neoplasm can result in intracranial hemorrhage, but the frequency varies widely among the different tumor types. The tumors that demonstrate the highest propensity to bleed are fast-growing, highly vascularized neoplasms with an irregularly fragile vascular network [7, 8]. Metastatic tumors and high-grade glial tumors demonstrate the greatest likelihood of hemorrhage, with the incidence of hemorrhage being approximately 10 % in metastatic intracranial tumors. Metastatic melanoma has the highest rate of bleeding (50 %), while metastatic adenocarcinoma, squamous cell carcinoma, and anaplastic carcinoma bleed at much lower rates [9]. Other common hemorrhagic metastatic tumors include renal cell carcinoma, choriocarcinoma, and thyroid carcinoma. Intratumoral hemorrhage is an atypical feature of metastatic lung and breast carcinoma. However, the relative incidence of intratumoral metastatic hemorrhage is more commonly seen in patients with lung and breast carcinoma when compared with other tumors having a greater propensity to hemorrhage, due to the relatively common occurrence of these tumors.
Intracranial hemorrhage manifests as high density on CT and has a variety of appearances on MRI depending on the evolution of the hematoma. Typically hemorrhage is isointense on T1-weighted sequences in the hyperacute and acute phases and then becomes hyperintense in the subacute phase until ultimately becoming hypointense in the chronic setting. It is important to understand that in every case of intracranial hemorrhage, an underlying lesion must be excluded. Frequently, MR findings may be equivocal because of the large amount of edema and mass effect associated with the blood. Further compounding interpretation is the intrinsic T1 shortening associated with subacute blood products, making it difficult to discern true enhancement on post-gadolinium T1-weighted imaging. Contrast-enhanced MRI is the gold standard in evaluating for an underlying lesion. An incomplete hemosiderin rim, presence of enhancing soft tissue, lack of typical expected evolution pattern of hemorrhage, worsening edema, and mass effect should suggest the presence of an underlying mass. If the initial MRI is equivocal, a short interval follow-up contrast-enhanced MRI should be obtained for further definite evaluation.
The effects of intratumoral intracranial hemorrhage can be catastrophic. Because the intracranial vault has a finite amount of space, any rapid or sudden increase in volume (hemorrhagic mass) can result in edema, mass effect, midline shift, hydrocephalus, and herniation of brain contents. Early detection and expeditious intervention are therefore crucial in the management of large hemorrhagic metastases.
26.2.2.2 Extra-axial Metastases
Intraparenchymal metastases are more likely to be encountered than extra-axial lesions in patients with systemic malignant neoplasms. 15 % of autopsied patients with a primary malignancy demonstrate an intraparenchymal lesion, while leptomeningeal and pachymeningeal metastases account for 8 % and 3–4 %, respectively [10, 11]. Contiguous pachymeningeal involvement secondary to calvarial or skull base lesions may be seen but is less commonly encountered than dural-based metastases (Fig. 26.3) [10].
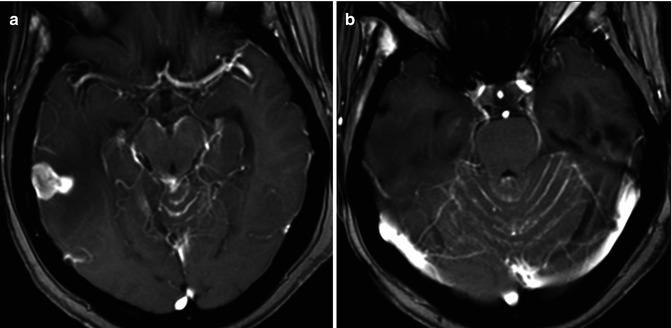
Fig. 26.3
A 55-year-old woman with history of breast cancer. Axial post-contrast T1WI (a, b) demonstrates a nodular leptomeningeal-based lesion in the right temporal region. There is diffuse leptomeningeal enhancement, especially visible around the cerebral peduncles and the cerebellar folia. The findings are compatible with leptomeningeal carcinomatosis
Leptomeningeal disease is most frequently seen with breast carcinoma, acute lymphocytic leukemia, and malignant high-grade non-Hodgkin’s lymphomas (Fig. 26.3) [10]. Small cell lung cancers, breast cancer, and melanoma tend to involve both the leptomeninges and the brain parenchyma. Non-small cell lung cancers, on the other hand, are frequently intra-axial only [12]. Pachymeningeal metastases are most frequently seen with prostate, breast, lung, and kidney carcinomas as well as multiple myeloma. In patients with multiple myeloma, the pachymeningeal involvement is frequently secondary to calvarial infiltration [10].
Leptomeningeal spread of tumor occurs most commonly due to hematogenous dissemination (Fig. 26.3). Nodules frequently coat the brainstem, surface of the brain (and spinal cord), ventricular surface, and cranial nerves [10]. Leptomeningeal carcinomatosis is a term reserved for extensive leptomeningeal tumor seeding resulting in clinical neurologic compromise.
Contrast-enhanced MRI is exquisite in assessing for leptomeningeal tumor, although a 30 % false-negative rate has been reported [13]. Specific MR techniques, which have increased the ability to discern subtle leptomeningeal disease, include 3D T1-weighted sequences, multiplanar imaging, and contrast-enhanced FLAIR sequences. Given the propensity for leptomeningeal disease to affect the skull base cisterns, obstructive (noncommunicating) hydrocephalus may develop (particularly at the level of the 4th ventricle). Obstructive (communicating) hydrocephalus may also result secondary to arachnoid granulation involvement causing impaired CSF resorption [10].
Dural-based metastatic tumors are uncommonly seen (Fig. 26.3). On cross-sectional imaging, dural-based lesions may characteristically show the typical biconvex (lenticular) shape with resultant local mass effect upon the cerebral gyri. Bony involvement is an important discriminator when attempting to distinguish epidural neoplasm from subdural tumor. Dural-based tumors may occasionally result in hemorrhage collecting within the epidural space.
26.2.2.3 Perineural Spread
Perineural spread of metastatic disease includes growth along the endoneurium, perineurium, or perineural lymphatics. Perineural dissemination can occur in any direction. However, centripetal extension (toward the skull base foramina) is the most common (Fig. 26.4) [10]. Adenoid cystic carcinoma is notorious for perineural spread. Such spread of tumor occurs in 15–60 % of patients with adenoid cystic carcinoma [14, 15]. A thorough search of the cranial nerves for perineural tumor spread should be performed in every patient with known adenoid cystic carcinoma. Additional head and neck malignancies with a propensity for perineural spread include squamous cell carcinoma (of the skin or mucosal epithelium), desmoplastic melanoma, salivary gland carcinomas, and lymphomas [10].
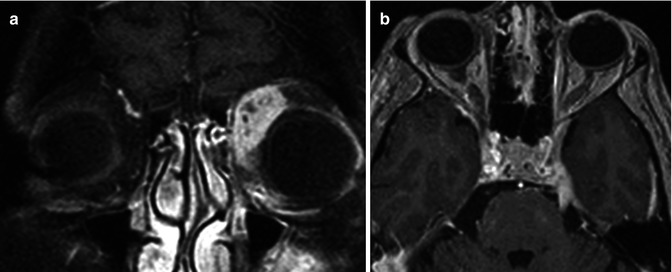
Fig. 26.4
A 33-year-old woman presents with left-sided proptosis and left trigeminal pain. Fat-suppressed post-contrast coronal T1WI (a) demonstrates a heterogeneously enhancing lesion within the left extraconal space. Contrast-enhanced axial T1WI (b) demonstrates an enhancing thickened left trigeminal nerve in Meckel’s cave and along its cisternal segment. Diagnosis: adenoid cystic carcinoma with associated retrograde perineural spread
Clinical symptoms may be deceiving as many of these patients are asymptomatic at the time of diagnosis. Therefore, imaging plays a critical role. Fat-suppressed contrast-enhanced MRI is the gold standard for detection of perineural spread of tumor. Imaging characteristics include segmental thickening of the involved nerve. Associated enhancement is frequently present. Many attribute this finding to breakdown of the blood-nerve barrier [10]. The neural foramen contains the coursing nerve and surrounding fat. Effacement of fat, and replacement with abnormal soft tissue, best appreciated on non-contrast T1WI, should alert the radiologist of possible perineural tumor spread in an appropriate clinical setting (Fig. 26.4). Thin section CT is excellent for discerning remodeling of the skull base foramina, another common finding. Frank bony erosion may also be seen at later stages. Ancillary findings include distal muscle denervation, which is manifested by edema in the early stages. Atrophy and fatty replacement predominates the denervated muscle groups in the chronic stages.
False negatives do occur on MRI when searching for perineural tumor. This may be the result of either skip lesions or the resurfacing phenomenon. This principle relates to nests of tumor cells, below the resolution of MRI, resurfacing more distally (or proximally) along a nerve [16–18]. The surrounding bony canal may also compress the nerve, making evaluation for perineural disease difficult. False positives on MRI may also exist, secondary to nerve enhancement in the setting of inflammation, infection, demyelination, axonal degeneration, ischemia, and trauma [19].
26.3 Nonglial Primary CNS Tumors
26.3.1 Meningiomas
Meningiomas comprise approximately 13–30 % of all primary intracranial tumors [20]. They are the most common intracranial extra-axial tumors. Meningiomas arise from arachnoid cap cells (also called meningothelial cells). The meningothelial cells are found within the leptomeninges as well as within the choroid plexus, which resides within the ventricular system [21]. Typically, meningiomas most commonly present during the fourth to sixth decade of life. These lesions are usually slow-growing and asymptomatic. Symptoms when present include headache and partial seizures [20]. Meningiomas have a strong female predilection (ratio 3:1), and there appears to be a link to hormonal influences, specifically estrogens. These tumors are associated with hormone replacement [22] and symptoms worsen during pregnancy [23]. This perhaps also explains why they are frequently found incidentally in patients imaged for breast cancer [24]. Meningiomas are more frequently seen with neurofibromatosis type II as well as in familial meningiomatosis [25] and a prior history of CNS radiation [26].
The World Health Organization (WHO) categorizes meningiomas based on recurrence risk. The distinction between the various strata of meningiomas relates to the number of mitosis and degree of cellular atypia. WHO grade I tumors are commonly seen and are considered “benign” (88–94 %). WHO grade II meningiomas are relatively uncommon and are considered “atypical” (7.2 %), and WHO grade III are the least common and are considered “anaplastic or malignant” (2.4 %) [27].
The imaging appearance for meningiomas is fairly characteristic. Their extra-axial location can be easily discerned by the presence of a clear CSF cleft between the meningioma and the brain, inward cortical buckling, and the characteristic dural tail identified on contrast-enhanced sequences (Fig. 26.5, 26.6, and 26.7). The dural tail refers to dural thickening and enhancement, which is contiguous with the meningioma (Fig. 26.7). These imaging features are nonspecific and can be seen with most extra-axial neoplasms. However, the presence of focal hyperostosis involving the adjacent inner table of the skull on CT is diagnostic for meningioma. Sometimes, when these tumors are associated with the paranasal sinuses, focal-associated prominence of the underlying sinus can be seen, a term called pneumosinus dilatans, again diagnostic for meningioma (Fig. 26.5). Because meningiomas are primarily fed by the external carotid arterial system, enlarged meningeal grooves may be seen.
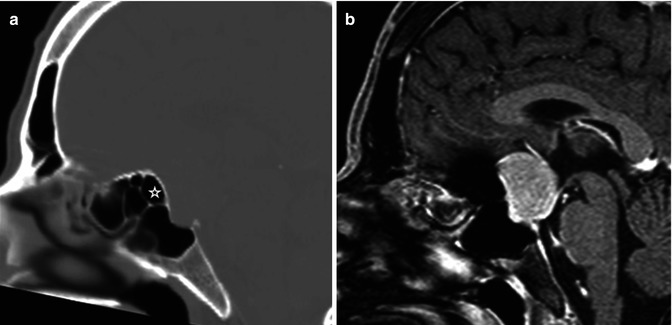
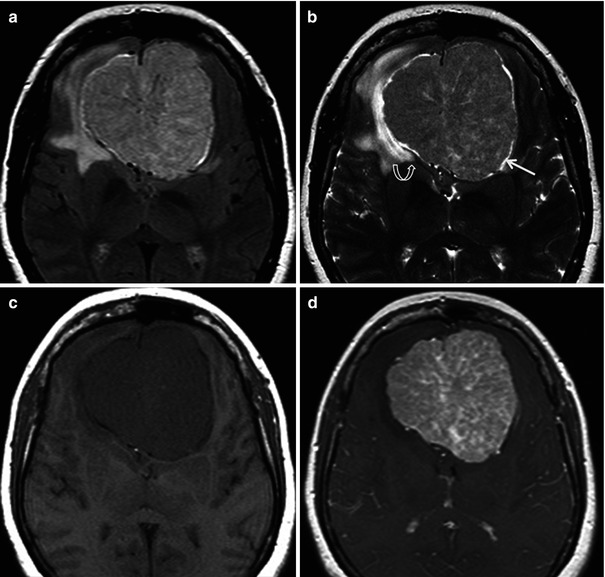
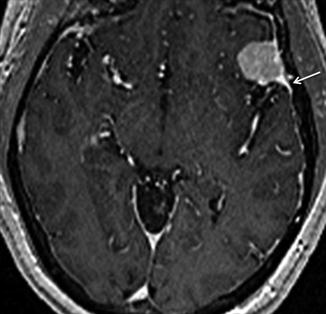
Fig. 26.5
Sagittal reconstructed CT scan (a) and post-contrast T1WI (b) are shown. There is a dural-based lesion seen in the region of the tuberculum sella. The posterior ethmoid sinus (star) appears enlarged bowing toward the lesion. The finding is related to “pneumosinus dilatans.” Diagnosis: meningioma
Fig. 26.6
A 45-year-old man presents with a 2-week history of anosmia. Axial FLAIR (a), T2WI (b), and pre- (c) and post-contrast (d) T1WI are shown. A large anterior skull base lesion is seen. Notice the CSF cleft (arrow), inward cortical buckling and the posterior displacement of the anterior cerebral arteries (curved arrow) are signs which help in establishing the extra-axial location of the lesion. The spoke wheel appearance, visible on the T2 and FLAIR images, is highly suggestive of meningioma
Fig. 26.7
Axial post-contrast T1WI in this 65-year-old man demonstrates the typical “dural tail” sign of an extra-axial lesion. Notice how the tail (arrow) enhances more than the lesion itself. The enhancing dural tail is related to both tumor invasion and hypervascular reaction to the dura. Diagnosis: meningioma
WHO grade I meningiomas are well-circumscribed extra-axial lesions. On CT, the tumors typically are hyperdense or isodense relative to cortex and frequently demonstrate calcification. On MRI, these tumors demonstrate T1 isointensity to hypointensity and T2 isointense signal relative to cortex. Following administration of contrast, these tumors enhance early and often homogenously. The contrast tends to persist for a long time within the tumor. This enhancement pattern is therefore referred to as the “mother-in-law” enhancing pattern (Fig. 26.8). The MRI appearance may occasionally vary depending on cellular atypia, calcification, cysts, and degree of vascularization. Atypical and malignant meningiomas demonstrate more diffusion restriction (as evidenced by lower ADC values) when compared to their typical counterparts [28]. Atypical meningiomas are associated with a permeability higher than that of typical variants, as expressed by the volume transfer constant (Ktrans) [29] (Fig. 26.9). WHO grade II and III meningiomas also typically demonstrate a more aggressive growth pattern with intraparenchymal invasion and rapid growth.
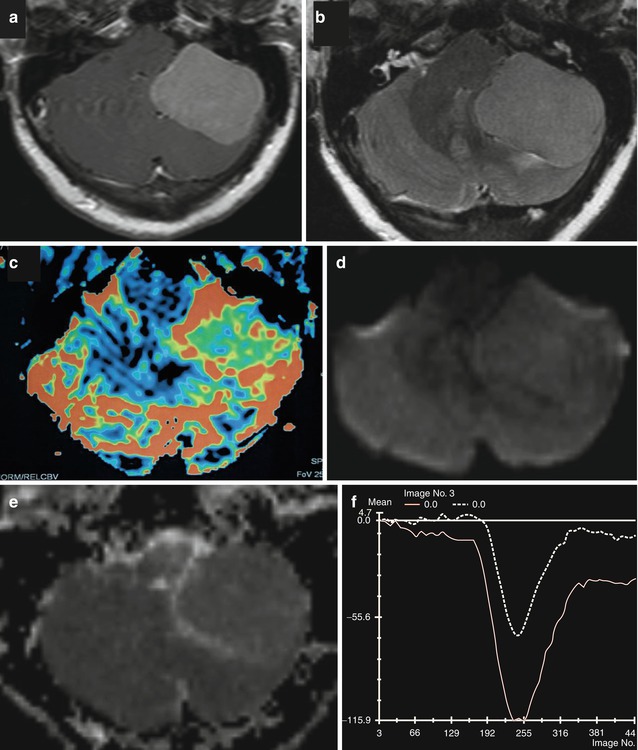
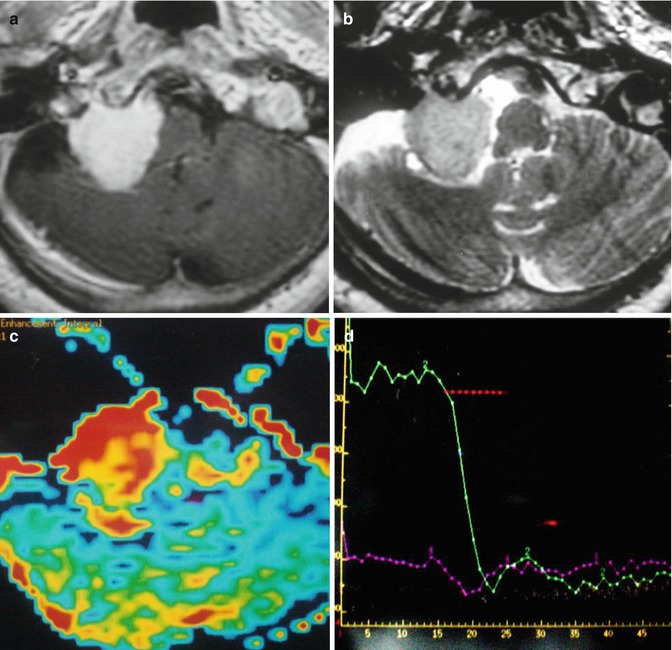
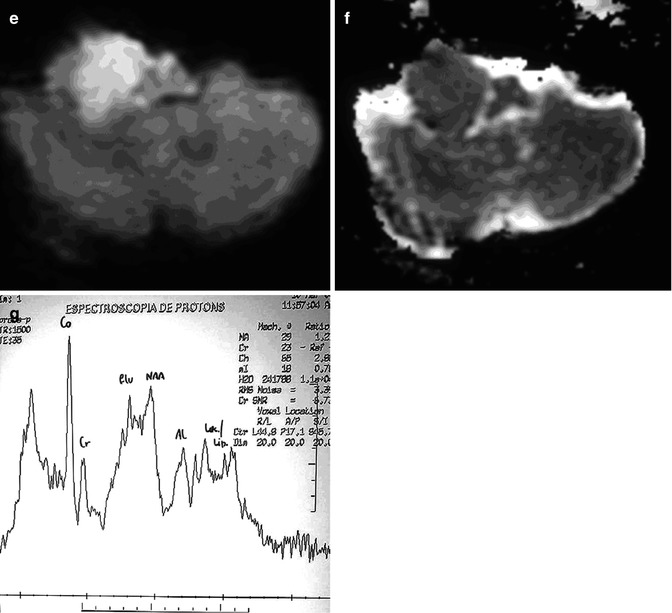
Fig. 26.8
Axial and post-contrast T1WI (a), FLAIR (b), rCBV map (c), DWI (d), and corresponding ADC map (e) and mean curve (f) are shown. A pathologically confirmed typical meningioma (WHO grade I) in the left posterior fossa does not demonstrate any restricted diffusion. Axial rCBV shows a high rCBV. Normalized signal intensity plotted against time for the lesion demonstrates that the curve never returns to the baseline confirming extra-axial nature of the lesion. It should be noted that the curve returns closer to the baseline in typical than in atypical meningiomas
Fig. 26.9
Axial post-contrast T1WI (a), T2WI (b), rCBV map (c), mean curve (d), DWI (e), corresponding ADC map (f), and MR spectroscopy (g) are shown. A pathologically confirmed atypical meningioma (WHO Grade II) in the left posterior fossa demonstrates restricted diffusion within the lesion. Axial rCBV shows a high rCBV. Normalized signal intensity plotted against time for the lesion demonstrates a curve that does not return to baseline favoring the diagnosis of an atypical meningioma. MR spectroscopy typically demonstrates a high peak of choline and a doublet peak of alanine at 1.47 ppm
26.3.2 Schwannomas
Schwannomas are benign tumors, which represent 8 % of all intracranial neoplasms [30] and 75–90 % of all cerebellopontine angle masses [31, 32]. As their name would imply, they originate from Schwann cells, a neural crest derivative. Cranial nerve VIII is most commonly involved giving rise to the term “acoustic neuroma.” This term has fallen out of favor, as this tumor is neither related to the cochlear division of the VIII nerve complex nor is it a neuroma. The schwannoma arises from the inferior division of the vestibular nerve in over 90 % of the cases [33]. The preferred term is therefore a vestibular schwannoma. After cranial nerve VIII, cranial nerves V (Fig. 26.10), IX, X, and VII are affected in descending order of occurrence [30].
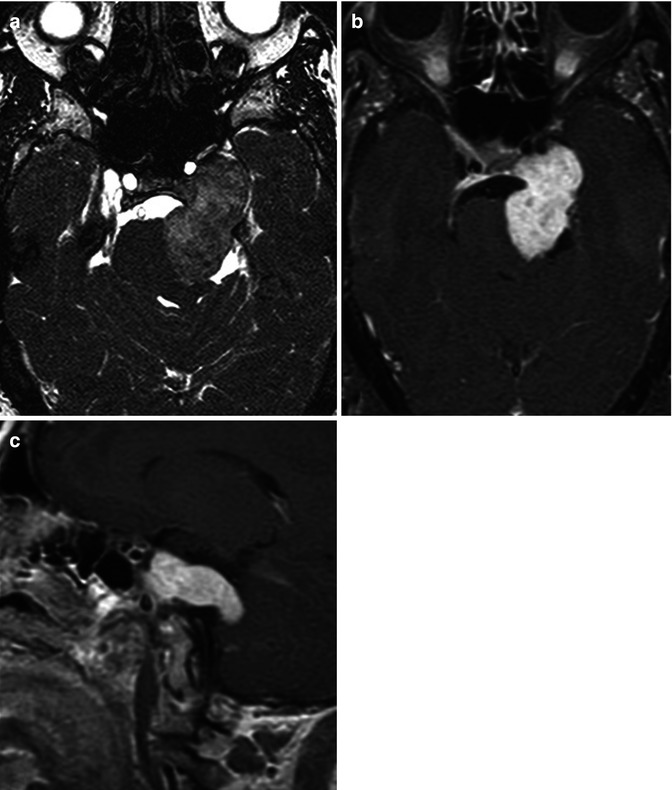
Fig. 26.10
Axial CISS (a), axial (b), and sagittal (c) post-contrast T1WI in this 43-year-old woman show the classic dumbbell shape of a trigeminal schwannoma, associated with anteromedial displacement of the internal carotid artery, indentation of the pons, and enlargement of the ipsilateral cerebellopontine angle cistern
Typically patients will present with cranial nerve palsy, but frequently patients are asymptomatic, and they are discovered incidentally [34]. Most often, these are isolated lesions. However, they can be seen in association with certain phacomatoses, such as neurofibromatosis type 2 (NF2). Multiple inherited schwannomas, meningiomas, and ependymomas (MISME) syndrome is a hallmark of NF2. The presence of bilateral vestibular schwannomas is diagnostic of NF2 (Fig. 26.11).
Fig. 26.11
Axial T2WI (a), pre-contrast T1WI (b), and contrast-enhanced fat-suppressed T1WI (c) in this 33-year-old man demonstrate bilateral heterogeneous large cerebellopontine angle vestibular schwannomas. Diagnosis: neurofibromatosis type 2
Schwannomas are well-encapsulated tumors that arise from cranial nerve fibers but are distinctly separate from these fibers histologically. They tend to splay and displace the fibers rather than incorporate the fibers [4]. Two growth patterns exist which parallel the histology. The Antoni A pattern shows elongated cells with cytoplasmic processes arranged in fascicles, a paucity of stromal matrix and palisading nuclei surrounding nuclear-free regions (Verocay bodies). The Antoni B pattern illustrates microcysts and myxoid change amidst a less cellular meshwork of cells [4]. On imaging it is difficult to reliably distinguish between these two patterns; however, some features may be suggestive. Large heterogeneous tumors are more commonly type B, likely relating to hemosiderin deposits and cystic change [35]. On CT, attenuated foci (not related to hemorrhage) within schwannomas correlate with the hypercellular Antoni A tissue, while hypoattenuating portions correlate with Antoni B tissue [36, 37].
On CT, most schwannomas are isoattenuating relative to the adjacent brain parenchyma. In untreated lesions, hemorrhage and calcification are rare. Bone algorithm CT helps delineate the nonaggressive bony changes which include smooth remodeling of the adjacent osseous structures, typically the neural foramina. This is very helpful in distinguishing schwannomas from malignant and more aggressive lytic processes. On MRI, schwannomas are isointense to slightly hypointense on T1-weighted sequences and heterogeneously hyperintense on T2-weighted pulse sequences (Fig. 26.10 and 26.11). Cystic areas of T2 hyperintensity may be seen with schwannomas. Avid enhancement is seen, although this may be slightly more heterogeneous in larger lesions or those with cystic change. Cystic degeneration is more commonly seen in larger tumors [31].
26.3.3 Lymphoma
Lymphoma affecting the brain consists of two subtypes: primary and secondary CNS lymphoma. The more common of the two, secondary lymphoma refers to CNS involvement from systemic lymphoma. Primary CNS lymphoma represents 1 % of all non-Hodgkin’s lymphomas [38] and is limited to the brain and spinal cord [39]. Primary CNS lymphoma represents 1–5 % of all brain tumors [40, 41]. Immunodeficient patients (especially those with AIDS) and those with extra-nodal involvement are more likely to develop primary CNS lymphoma [42]. With the widespread use of HAART, the incidence of primary CNS lymphoma has declined [43]. With regard to systemic lymphoma, the risk of CNS involvement is higher with non-Hodgkin’s lymphoma (NHL) (2–27 %) when compared to the Hodgkin’s variety (≤0.5 %).
26.3.3.1 Primary CNS Lymphoma
In an immunocompetent patient, primary CNS lymphoma is a solitary, densely cellular, intraparenchymal tumor with a high nuclear to cytoplasmic ratio. There is a predilection for periventricular and superficial locations adjacent to ependymal and meningeal surfaces, respectively (Fig. 26.12) [44]. Some have described a frontal lobe predilection followed by brainstem, basal ganglia, and cerebellar involvement [45]. These tumors due to their highly cellular composition appear hyperdense on non-contrast CT studies. On MRI, these tumors appear isointense on T1WI, hypointense on T2WI and demonstrate diffusion restriction (Fig. 26.12). Enhancement is usually homogeneous and avid. Surrounding vasogenic edema exists which manifests as peritumoral T2/FLAIR hyperintensity (Fig. 26.12). Typically the degree of edema is much less than that of glial tumors or metastatic lesions [46]. Internal hemorrhage and associated calcification are exceedingly rare with lymphoma [46].
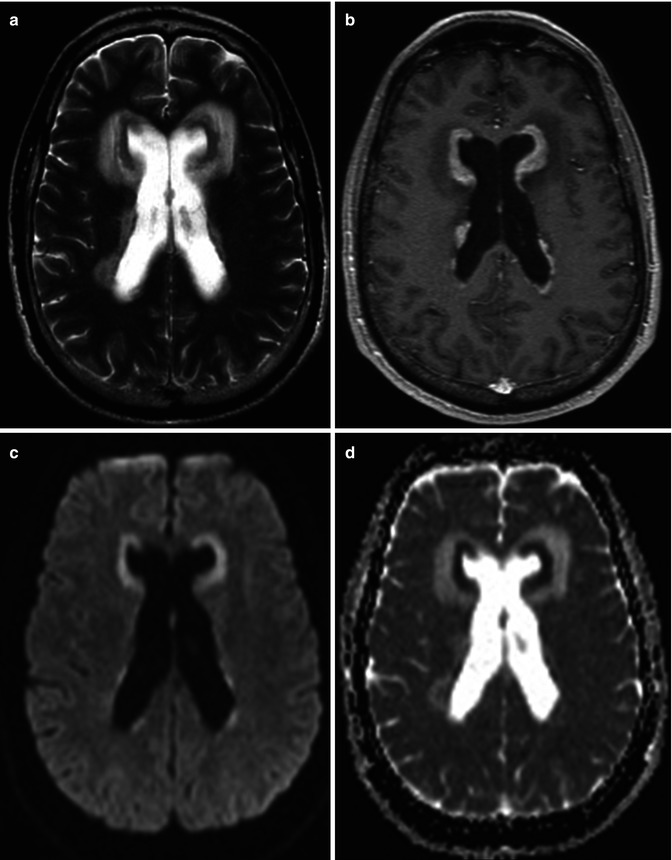
Fig. 26.12
A 27-year-old man with headache and vomiting. Axial T2WI (a), post-contrast T1WI (b) DWI (c), and corresponding ADC map (d) are shown. Diffuse periventricular T2-dark lesions demonstrating diffusion restriction and enhancement are seen. Diagnosis: primary CNS lymphoma with subependymal spread of tumor
Extension of parenchymal CNS lymphoma to the eye represents secondary intraocular lymphoma. This has been described in up to 25 % of the cases of primary CNS lymphoma [47].
Multifocal lesions or centrally necrotic, peripherally enhancing lesions of primary CNS lymphoma are often characteristic of immunocompromised patients. In fact, 30–80 % of patients with AIDS may have multifocal lesions [48–50]. Toxoplasmosis is the main differential diagnostic consideration in this subset of immunocompromised patients. Features that favor lymphoma over toxoplasmosis include the presence of a single lesion, subependymal spread, and solid enhancement. Thallium SPECT uptake, elevated choline peak on MR spectroscopy, and elevated rCBV on MR perfusion are additional imaging features which help distinguish lymphoma from toxoplasmosis (Fig. 26.13). Sometimes, neuroimaging cannot make the distinction, and a trial of empiric toxoplasmosis therapy is employed. Spontaneous hemorrhage into these lesions has been described in the AIDS population [50]. The basal ganglia and corpus callosum are typical locations in the immunosuppressed group [48].
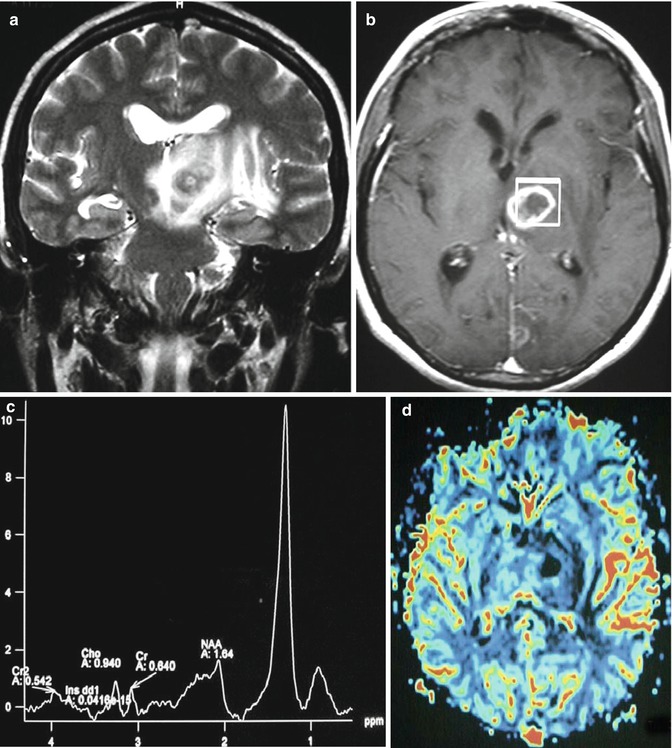
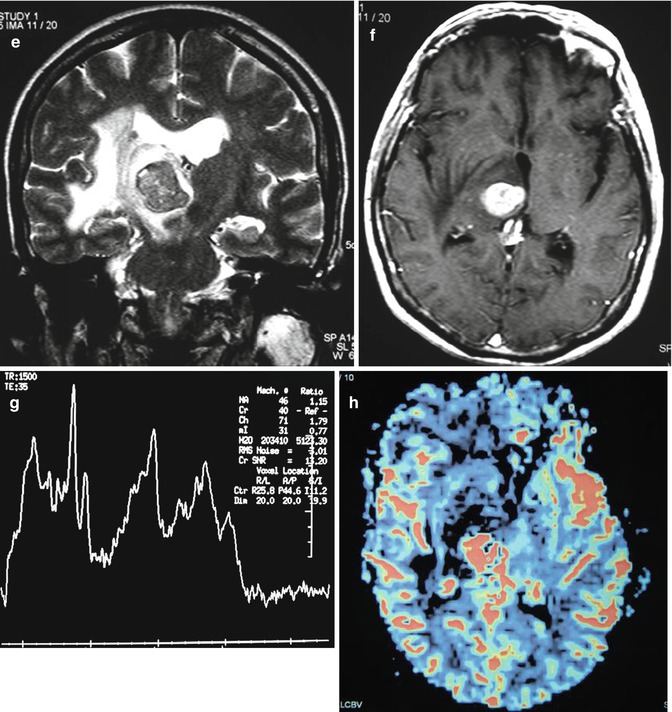
Fig. 26.13
A 47-year-old woman with right hemiparesis and mental confusion (a–d). Coronal T2WI (a), axial post-contrast T1WI (b) MR spectroscopy (c), and rCBV map (d) are shown. A ring-enhancing, T2-dark lesion in the left thalamus surrounded by vasogenic edema, without hyperperfusion, is seen. MRS demonstrates a very high peak of lipids/lactate. Diagnosis: toxoplasmosis. A 65-year-old woman with left hemiparesis and headache (e–h). Coronal T2WI (e), axial post-contrast T1WI (f), MR spectroscopy (g), and rCBV map (h) are shown. An enhancing, T2-dark lesion in the right thalamus surrounded by vasogenic edema, with hyperperfusion, is seen. MRS demonstrates a high peak of choline and elevated lipids/lactate. Diagnosis: lymphoma
One of the great mimickers of meningiomas is the relatively uncommon primary dural lymphoma. This rare subtype of primary CNS lymphoma arises from the dura mater. Dural lymphoma is usually found in the same location that one would find meningioma, including the cerebral convexities, falx, tentorium, sellar, and parasellar locations [51].
26.3.3.2 Secondary CNS Lymphoma
Two-thirds of patients with secondary CNS lymphoma present with leptomeningeal disease [42]. Cranial nerve palsy may result given the propensity for leptomeningeal involvement to occur at the skull base. Contrast-enhanced MRI is superior to CT in detecting and characterizing leptomeningeal disease. MR findings include leptomeningeal, dural, and subependymal enhancement. Nodular thickening and enhancement along the cranial nerves are common. Secondary lymphoma, much like the primary variety, demonstrates restricted diffusion. Communicating hydrocephalus may be seen.
26.3.4 Pituitary Origin Tumors
26.3.4.1 Pituitary Adenomas
The most common of the pituitary tumors are the pituitary adenomas. These are categorized into microadenomas (less than 1 cm) and macroadenomas (greater than 1 cm). Usually the diagnosis is suggested by clinical findings and hormonal imbalance. However, MRI is frequently requested for confirmation of the diagnosis, anatomic delineation, and assessment of surrounding structures including the cavernous sinuses and optic chiasm.
Microadenomas are best detected using dynamic contrast-enhanced high-resolution coronal imaging through the sella turcica, which takes advantage of the differential time course enhancement of the adenoma relative to the normal gland (Fig. 26.14) [52]. Typically, focal, rounded/ovoid areas of hypoenhancement relative to the remainder of the adenohypophysis are characteristic (Fig. 26.14). These lesions may be mildly hyperintense on T2-weighted pulse sequences, which can aid in their detection. Asymmetric or convex margins of the gland as well as contralateral pituitary stalk deviation are also helpful ancillary findings.
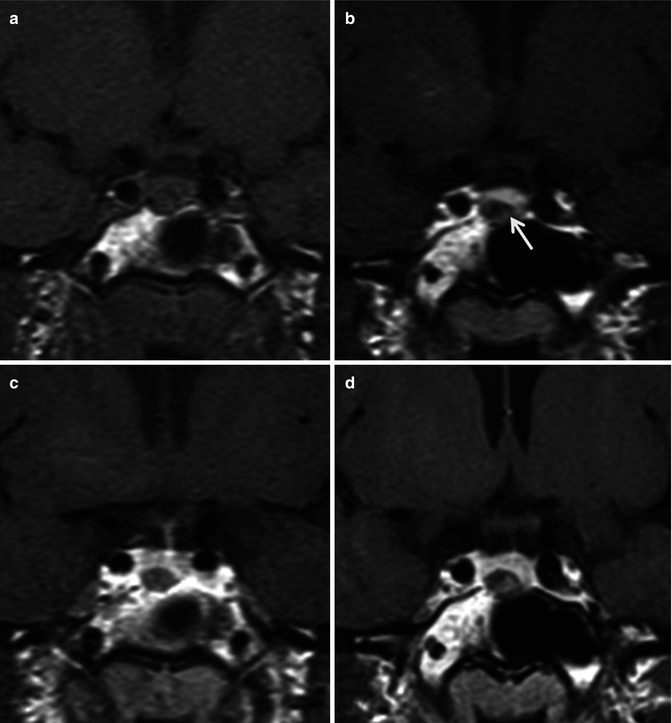
Fig. 26.14
Coronal dynamic T1WI sequence pre-contrast (a), 1-min post-contrast (b), 2-min post-contrast (c), and 4-min delayed (d) images demonstrate an 8 mm lesion in the right side of the gland (arrow) which shows a differential enhancement pattern than the rest of the normal pituitary gland. The infundibulum is slightly deviated to the left. Diagnosis: pituitary microadenoma
In contrast to the microadenomas, the macroadenomas are notorious for expanding the sella. Sellar enlargement is seen in 94–100 % of pituitary macroadenomas [53]. Macroadenomas often have a lobulated appearance. A snowman or figure-of-8 sign often results from the cinching effect by diaphragma sella as the tumor grows cranially into the suprasellar cistern (Fig. 26.15). Evaluation for indentation of the optic chiasm in the suprasellar cistern and invasion of the cavernous sinuses should always be performed in patients with macroadenomas. Skull base erosion and invasion may be seen with invasive macroadenomas. Signal intensity and enhancement pattern may become more heterogeneous with larger lesions.
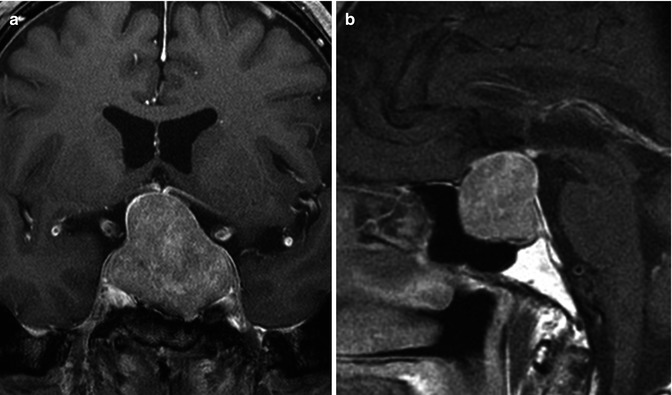
Fig. 26.15
Post-contrast coronal (a) and sagittal T1WI (b) demonstrate a pituitary macroadenoma. Notice the expanded sella and the classic snowman-shaped or “figure-of-eight” sellar/suprasellar mass resulting from a waist-like constriction at the diaphragma sella
26.3.4.2 Craniopharyngiomas
Craniopharyngiomas are WHO grade I neoplasms which are histologically categorized into the adamantinomatous, papillary, and mixed subtypes [54]. There is a bimodal distribution of craniopharyngiomas with the earlier peak (ages 10–14) made up almost exclusively by the adamantinomatous type (Fig. 26.16). Because pediatric CNS tumors are beyond the scope of this chapter, this subtype will not be discussed. The second peak occurs in young- to middle-aged adults and is made up primarily of the papillary variety.
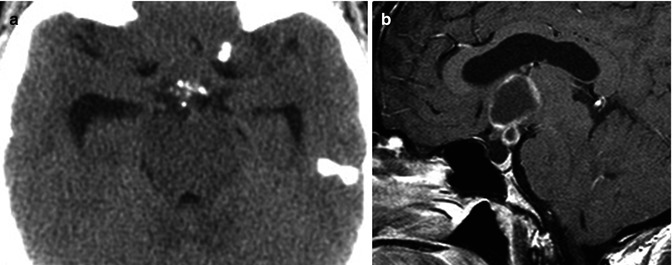
Fig. 26.16
Non-contrast axial CT scan (a) and sagittal post-contrast T1WI (b) demonstrate a predominantly cystic, partially solid, peripherally enhancing, suprasellar mass with focal rim calcifications. There is associated mild hydrocephalus, secondary to the mass effect on the third ventricle. On pathology the lesion was a craniopharyngioma
Papillary craniopharyngiomas are usually solid tumors, which may contain a few small cysts [54]. Calcification is a very rare finding, in contradistinction to the adamantinomatous type. Avid enhancement of the solid components is commonly seen.
26.3.5 Pineal Origin Tumors
The pineal gland is a midline structure emanating from the posterosuperior margin of the third ventricle. The pineal gland is centered within the quadrigeminal plate cistern, surrounded by a rich network of cisterns including the velum interpositum anteriorly. The paired internal cerebral veins course through the velum interpositum traveling posterosuperior around the pineal gland, where they join the basal veins to become the vein of Galen. This is an important anatomic landmark as masses of the pineal gland will elevate these venous structures, while masses of the corpus callosum will depress them. Just anteroinferior to the pineal gland is the tectal plate, comprised of the paired superior and inferior colliculi, which is also frequently compressed with pineal masses [55]. When compression of the tectal plate occurs, a supranuclear vertical gaze disturbance results termed Parinaud syndrome [56].
Related posts:


Stay updated, free articles. Join our Telegram channel

Full access? Get Clinical Tree


