Methods of Examination, Normal Anatomy, and Radiographic Findings of Chest Disease
Julio Lemos
Jeffrey S. Klein
There are many imaging techniques available to the radiologist for the evaluation of thoracic disease (1). The decision about which imaging procedures to perform depends upon many factors, with the most important one being the availability of various modalities and the type of information sought. Although conventional radiographs of the chest still constitute 25% to 35% of the volume of any general radiology department, there has been a steady decline in favor of CT despite the considerable increase in radiation to the patient. The recent years have seen near disappearance of diagnostic thoracic vascular interventions, thanks to multidetector CT and MR. The recent advent of multichannel, parallel MR imaging might allow for gradual replacement of CT for thoracic vascular diagnostics. Although the imaging algorithm for specific problems may seem relatively straightforward, medical judgment should be preferred. For example, a thin-section CT showing a suspicious solitary pulmonary nodule might be followed directly by a thoracotomy, or rather, in selected patients, by transthoracic needle biopsy. This type of flexible approach will often streamline the diagnostic workup and ultimately lead to better patient care.
Imaging Modalities
Conventional Chest Radiography. Posteroanterior (PA) and lateral chest radiographs are the mainstays of thoracic imaging. Conventional radiographs should be performed as the initial imaging study in all patients with thoracic disease. These radiographs are obtained in most radiology departments on a dedicated chest unit capable of obtaining radiographs with a focus-to-film distance of 6 ft, a high kilovoltage potential (140 kVp) technique, a grid to reduce scatter, and a phototimer to control the length of exposure (2).
The recognition of proper radiographic technique on frontal radiographs involves assessment of four basic features: penetration, rotation, inspiration, and motion. Proper penetration is present when there is faint visualization of the intervertebral disk spaces of the thoracic spine and discrete branching vessels can be identified through the cardiac shadow and the diaphragms. Rotation is assessed by noting the relationship between a vertical line drawn midway between the medial cortical margins of the clavicular heads and one drawn vertically through the spinous processes of the thoracic vertebrae. Superimposition of these lines (the former in the midline anteriorly and the latter in the midline posteriorly) indicates a properly positioned, nonrotated patient. An appropriate deep inspiration in a normal individual is present when the apex of the right hemidiaphragm is visible below the tenth posterior rib. Finally, the cardiac margin, diaphragm, and pulmonary vessels should be sharply marginated in a completely still patient who has suspended respiration during the radiographic exposure (Fig. 12.1).
Portable Radiography. Portable anteroposterior (AP) radiographs are obtained when patients cannot be safely mobilized (3). Portable radiographs help monitor a patient’s cardiopulmonary status; assess the position of various monitoring and life support tubes, lines, and catheters; and detect complications related to the use of these devices.
There are technical and patient-related compromises as well as inherent physiologic changes with portable bedside radiography. The limited maximal kilovoltage potential of portable units requires longer exposures to penetrate cardiomediastinal
structures, which results in greater motion artifact. Because critically ill patients are difficult to position for portable radiographs, the images are often rotated. Inaccuracies in directing the x-ray beam perpendicular to the patient lead to kyphotic or lordotic radiographs. The short focus-to-film distance (typically 40 in) and AP technique result in magnification of intrathoracic structures. For instance, the apparent cardiac diameter increases by 15% to 20%, bringing the upper limit of normal for the cardiothoracic ratio from 50% on a PA radiograph to 57% on an AP. Physiologically, the supine position of critically ill patients elevates the diaphragm, thus compressing lower lobes and decreasing lung volumes. The normal gravitational effect evens out the blood flow between upper and lower zones in supine patients, which makes assessment of pulmonary venous hypertension difficult. The increase in systemic venous return to the heart produces a widening of the upper mediastinum or “vascular pedicle.” The gravitational layering of free-flowing fluid may hide small effusions. Similarly, a pneumothorax may be difficult to detect because free intrapleural air rises to a nondependent position, producing a subtle anteromedial or inferior radiolucency. A device called the inclinometer has been developed to accurately record the position of the bedridden patient from supine to completely upright. This device, which clips onto the portable radiograph cassette, gives an accurate estimate of the patient’s position at the time of the radiograph, which helps assess the distribution of pulmonary blood flow, pleural effusions, and pneumothorax.
structures, which results in greater motion artifact. Because critically ill patients are difficult to position for portable radiographs, the images are often rotated. Inaccuracies in directing the x-ray beam perpendicular to the patient lead to kyphotic or lordotic radiographs. The short focus-to-film distance (typically 40 in) and AP technique result in magnification of intrathoracic structures. For instance, the apparent cardiac diameter increases by 15% to 20%, bringing the upper limit of normal for the cardiothoracic ratio from 50% on a PA radiograph to 57% on an AP. Physiologically, the supine position of critically ill patients elevates the diaphragm, thus compressing lower lobes and decreasing lung volumes. The normal gravitational effect evens out the blood flow between upper and lower zones in supine patients, which makes assessment of pulmonary venous hypertension difficult. The increase in systemic venous return to the heart produces a widening of the upper mediastinum or “vascular pedicle.” The gravitational layering of free-flowing fluid may hide small effusions. Similarly, a pneumothorax may be difficult to detect because free intrapleural air rises to a nondependent position, producing a subtle anteromedial or inferior radiolucency. A device called the inclinometer has been developed to accurately record the position of the bedridden patient from supine to completely upright. This device, which clips onto the portable radiograph cassette, gives an accurate estimate of the patient’s position at the time of the radiograph, which helps assess the distribution of pulmonary blood flow, pleural effusions, and pneumothorax.
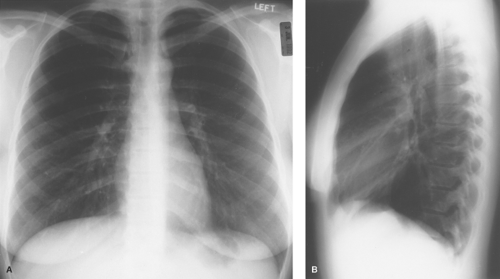 Figure 12.1. Normal PA (A) and lateral (B) radiographs of the chest. |
Digital (Computed) Radiography. The main advantages of computed chest radiography are superior contrast resolution and the availability of the image on any computer monitor through a PACS (picture archiving and communication system). Contrast levels and windows can be adjusted to enhance visualization of various regions in the chest or compensate partly for faulty exposure. Although digital images have poorer spatial resolution than their analog counterparts, these benefits render the system appealing.
Dual energy subtraction, a form of computed radiography that utilizes low-energy (60 keV) and high-energy (120 keV) photons to produce selective bone and soft tissue images, respectively, allows improved visualization of lung nodules, calcification, chest wall and pleural lesions, hilar masses, and localization of indwelling tubes, lines and catheters (4).
Special Techniques. A lateral decubitus radiograph is obtained with a horizontal x-ray beam while the patient lies in the decubitus position. It is used to detect small effusions, to characterize free-flowing effusions on the decubitus side (Fig. 12.2), or to detect a small pneumothorax on the contralateral side. As little as 5 mL of fluid or 15 mL of air can be demonstrated by this view. Normally, the downside diaphragm assumes a higher position than the upside one. Air trapping can be demonstrated in the dependent lung in patients with a check valve bronchial obstruction who are unable to cooperate for inspiratory/expiratory radiographs or chest fluoroscopy.
An expiratory radiograph obtained at residual volume (end of maximal forced expiration) can detect focal or diffuse air trapping and eases detection of a small pneumothorax. In the absence of a direct communication between the pleura and the bronchi, the volume of air in the pleural space remains stable, whereas the volume of air in the lung parenchyma decreases. Because the lung is also displaced away from the chest wall, the visceral pleural line becomes more visible.
An apical lordotic view improves visualization of the lung apices, which are obscured on routine PA radiographs by the clavicles and first costochondral junctions. Caudocephalad angulation of the tube projects these anterior bony structures superiorly, providing an unimpeded view of the apices. This view enhances the visualization of middle lobe atelectasis by placing the inferiorly displaced minor fissure in tangent with the x-ray beam and by increasing the AP thickness of the atelectatic middle lobe.
Chest fluoroscopy is used mainly to assess chest dynamics on patients with suspected diaphragmatic paralysis. Although it has been widely abandoned to the benefit of CT, fluoroscopy can still often bring the same answers as CT at a fraction of the radiation exposure: evaluation of a nodular opacity seen on only one view, evaluation of apparent pseudotumor images
caused by vertebral lamina, osteophytes, vertebral transverse processes, healed rib fractures, skin lesions, nipples, or other external objects.
caused by vertebral lamina, osteophytes, vertebral transverse processes, healed rib fractures, skin lesions, nipples, or other external objects.
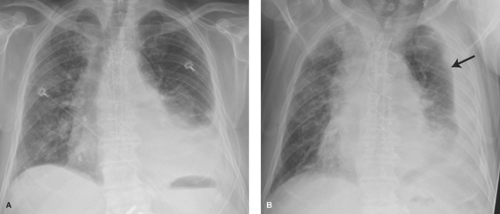 Figure 12.2. Lateral Decubitus Film for the Assessment of Pleural Effusion. An upright radiograph (A) in a patient recovering from coronary bypass graft surgery shows a left-sided meniscus indicative of a pleural effusion. A left lateral decubitus film (B) demonstrates free-flowing effusion laterally on the dependent side (solid arrows). |
CT and HRCT (Thin-Section CT). Thoracic chest CTs can be acquired in an incremental “stop, acquire, and go” mode, such as for high-resolution CT, in a helical mode, whereby acquisition occurs while the patient translates through the gantry on the CT scan table, or in a step-and-shoot mode, in which data is acquired in contiguous 12 to 16 cm long stacks of images triggered to one phase of the ECG tracing. The latter technique markedly reduces radiation dose and maximizes longitudinal coverage and is therefore most useful for coronary and aortic CTA. Multidetector scanners with 256 to 320 detectors now allow for full chest coverage with collimation as narrow as 1.0 mm in approximately 3 to 5 seconds. Scans without contrast are usually performed for evaluation or follow-up of parenchymal disease. Iodinated contrast material is administered for mediastinal mass or cancer staging evaluation, systemic or pulmonary arterial evaluation, or for cardiac studies.
The field of view for image reconstruction is determined by measuring the widest transverse diameter, as seen on the CT scout view. An edge-enhancing computer reconstruction algorithm (“bone” or “sharp” algorithm) improves the spatial resolution of parenchymal structures and is used for all types of thoracic CT scans. Most frequently, the image is reconstructed in a 512 × 512 matrix size. Matrix sizes up to 1,024 × 1,024 are now available, but studies would be needed to assess whether there is any diagnostic benefit to this fourfold increase in image size. Although images can still be filmed using a laser camera, PACS workstation viewing offers the possibility to modify window width (WW) and window level (WL) as needed. Routine settings for CT display of mediastinal structures are WW = 400 and WL = 40 and for the lungs are WW = 1,500 and WL = -700.
HRCT, thin-section CT, technique involves incremental thinly collimated scans (1.0 to 1.5 mm) obtained at evenly spaced intervals through the thorax for the evaluation of diffuse bronchial or parenchymal lung disease. Image acquisition time is limited to minimize the effects of respiratory and cardiac motion. Expiratory HRCT scans are useful for the detection of air trapping in patients with small airways disease. Normal and abnormal HRCT findings are reviewed in Chapter 17.
The volume of data of a helical CT is acquired with a thickness (collimation) of 0.5 to 10 mm, and the user can then determine the reconstruction interval, which is chosen according to the amount of desired overlap. For example, a helical scan covering 25 cm with a 2.0-mm collimation can be reconstructed with a 2.0-mm interval, yielding 125 contiguous images with no overlap, but could also be reconstructed at a 1.25-mm interval, yielding 200 images, each of which overlaps the following image by 0.75 mm (5).
The major advantages of CT are its superior contrast resolution and cross-sectional display format. Superior contrast resolution allows for the differentiation of calcium, soft tissue, and fat within lung nodules or mediastinal structures. Intravenous enhancement improves contrast within structures or masses as well as within blood vessels (e.g., pulmonary emboli, aortic dissection). The cross-sectional display eliminates the superimposition of structures and allows visualization of parenchymal nodules as small as 2 mm.
The clinical indications for thoracic CT will vary among institutions. The indications for thoracic CT and HRCT are shown in Tables 12.1 and 12.2.
MR. As MR usage expands, studies must be tailored to the individual patient. Morphologic studies usually require only spin echo T1W and T2W sequences in the axial plane. Coronal and sagittal planes are used in selected cases. Mass evaluation might benefit from fat-suppressed sequences, such as STIR, or from gadolinium-enhanced sequences. Angiographic acquisitions are most often performed with GRE volumetric acquisitions. Cardiac sequences benefit from cardiac-gated balanced steady-state free precession (SSFP) techniques. Respiratory motion is minimized by performing rapid single breath-hold acquisitions or by using respiratory compensation techniques. The latest generation of multichannel scanners with parallel imaging and faster gradients show promise in evaluation of embolic disease, without the radiation cost of multidetector CTs (5).
The major advantages of MR are the superior contrast resolution between tumor and fat, the ability to characterize tissues on the basis of T1 and T2 relaxation times, the ability to scan in direct sagittal and coronal planes, and the lack of need for intravenous iodinated contrast (6). In addition, the ability to obtain images along the long axis of the aorta and the advent of cine-MR techniques have made MR the primary
modality for the imaging of most congenital and acquired thoracic vascular disorders. Direct coronal scans are of benefit in imaging regions that lie within the axial plane and are therefore difficult to depict on CT. For this reason, superior sulcus tumors, subcarinal and aortopulmonary window lesions, and certain hilar masses are better depicted by MR than CT. MR is superior to CT in the diagnosis of chest wall or mediastinal invasion because of the high contrast between tumor and chest wall fat and musculature and tumor and mediastinal fat, respectively. The characterization of tissues by their T1 and T2 relaxation times allows for the diagnosis of fluid-filled cysts, hemorrhage, and hematoma formation. The ability to distinguish tumor from fibrosis, based on their T1 and T2 relaxation times, has proven particularly useful in the follow-up of patients irradiated for Hodgkin disease. MR is currently unable to distinguish benign masses from malignant masses or lymph nodes.
modality for the imaging of most congenital and acquired thoracic vascular disorders. Direct coronal scans are of benefit in imaging regions that lie within the axial plane and are therefore difficult to depict on CT. For this reason, superior sulcus tumors, subcarinal and aortopulmonary window lesions, and certain hilar masses are better depicted by MR than CT. MR is superior to CT in the diagnosis of chest wall or mediastinal invasion because of the high contrast between tumor and chest wall fat and musculature and tumor and mediastinal fat, respectively. The characterization of tissues by their T1 and T2 relaxation times allows for the diagnosis of fluid-filled cysts, hemorrhage, and hematoma formation. The ability to distinguish tumor from fibrosis, based on their T1 and T2 relaxation times, has proven particularly useful in the follow-up of patients irradiated for Hodgkin disease. MR is currently unable to distinguish benign masses from malignant masses or lymph nodes.
Table 12.1 Indications for Thoracic Ct | ||||||||||||||||
|---|---|---|---|---|---|---|---|---|---|---|---|---|---|---|---|---|
|
The major disadvantages of thoracic MR scanning are the limited spatial resolution, the inability to detect calcium, and the difficulties in imaging the pulmonary parenchyma. MR is also more time-consuming and expensive than CT. These factors, along with the ability of CT to provide superior or equivalent information in most situations, have limited the use of thoracic MR for most noncardiovascular thoracic disorders. The primary indications for thoracic MR are listed in Table 12.3.
PET. Fluorodeoxyglucose (FDG) PET is an imaging modality based on the metabolic activity of neoplastic and inflammatory tissues and therefore can be considered complementary to the anatomic information provided by chest radiography and CT. The role of PET in oncologic diagnosis and staging has developed gradually over the past decade. There is a growing published experience of whole-body PET in the evaluation of patients with malignancy, particularly bronchogenic carcinoma, and of thoracic PET for the evaluation of the solitary pulmonary nodule (7).
Table 12.2 Indications for Thoracic Hrct | ||||||||||||||
|---|---|---|---|---|---|---|---|---|---|---|---|---|---|---|
| ||||||||||||||
Sonography. Transthoracic sonography is now commonly used for the detection, characterization, and sampling of pleural, peripheral parenchymal, and mediastinal lesions (see Chapter 39). The aspiration of small pleural effusions visualized on real-time sonography is preferable to blind thoracentesis. Similarly, sampling of visible pleural masses in patients with malignant effusions can diminish the number of negative pleural biopsies. The aspiration of pleural-based masses and abscesses can be safely performed by US-guided needle placement into the lesion through the point of contact between the mass and pleura. Large anterior mediastinal masses that have a broad area of contact with the parasternal chest wall may be biopsied without transgressing the lung.
Real-time sonography can also confirm phrenic nerve paralysis without the use of ionizing radiation. It easily detects
subpulmonic and subphrenic fluid collections, which may cause apparent diaphragmatic elevation. In emergency room and critical care settings, thoracic sonography is used to detect pneumothorax and to guide central venous catheterization.
subpulmonic and subphrenic fluid collections, which may cause apparent diaphragmatic elevation. In emergency room and critical care settings, thoracic sonography is used to detect pneumothorax and to guide central venous catheterization.
Table 12.3 Indications for Mr of the Thorax | |
|---|---|
|
Ventilation/Perfusion Lung Scanning. The nuclear medicine examinations for the evaluation of noncardiac thoracic disease are ventilation/perfusion (V/Q) lung scintigraphy (see Chapter 55) and gallium scintigraphy. V/Q scanning is used almost exclusively for the diagnosis of pulmonary embolism, although quantitative V/Q imaging may be useful in the planning of bullectomy, lung volume reduction surgery for emphysema, and lung transplantation. Gallium-67 scanning of the chest is used in the detection of pulmonary infection (e.g., Pneumocystis carinii pneumonia in a patient with a normal radiograph) or inflammation (e.g., disease activity in idiopathic pulmonary fibrosis) and in the evaluation of suspected sarcoidosis.
Diagnostic Arteriography has largely been replaced by MDCT angiography. Pulmonary angiograms are only performed in cases where CT pulmonary angiography is suboptimal or equivocal.
Thanks to the newer scanners and to the improvement of three-dimensional rendering tools, thoracic aortography has also been largely replaced by CT, MR, or US. On occasion, an equivocal diagnosis of an aortic laceration following blunt chest trauma can be resolved with this technique. Inflammatory changes of infectious aortitis are also better imaged with MR or CT.
Active bleeding through a bronchial artery is still best addressed by bronchial arteriography, as an active bleeding site is often difficult to pinpoint. When massive or recurrent hemoptysis occurs, most commonly from bronchiectasis, neoplasm, or mycetoma, arteriography and embolization can be performed in the same setting.
Transthoracic Needle Biopsy guided by CT, fluoroscopy, or US is a diagnostic technique used in selected patients with pulmonary, pleural, or mediastinal lesions (7).
Percutaneous Catheter Drainage of intrathoracic air or fluid collections, performed by imaging-guided placement of small-bore multihole catheters, is used for the treatment of empyema, pneumothorax, malignant pleural effusion, and other intrathoracic fluid collections (3).
Normal Lung Anatomy
Tracheobronchial Tree. The trachea is a hollow cylinder composed of a series of C-shaped cartilaginous rings (Fig. 12.3). The rings are completed posteriorly by a flat band of muscle and connective tissue called the posterior tracheal membrane. The tracheal mucosa consists of pseudostratified, ciliated columnar epithelium, which contains scattered neuroendocrine (APUD) cells. The submucosa contains cartilage, smooth muscle, and seromucous glands. The left lateral wall of the distal trachea is indented by the transverse portion of the aortic arch.
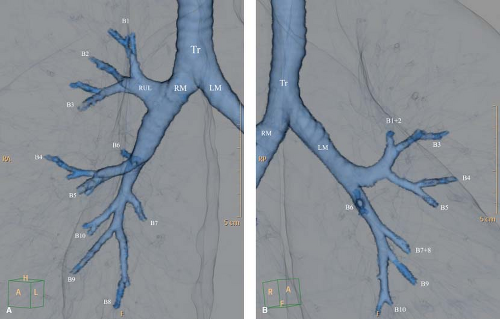 Figure 12.3. Prevailing Pattern of Segmental Bronchi. Virtual bronchography three-dimensional rendered images of the usual bronchial anatomy. A. Right bronchial tree. B. Left bronchial tree. Tr, trachea; RUL, right upper lobe; LUL, left upper lobe; RM, right main bronchus; LM, left main bronchus; BT, left lower lobe basal trunk; RML, right middle lobe; B1, apical (upper lobe); B2, posterior (upper lobe); B3, anterior (upper lobe); B4, lateral (middle lobe) and superior (lingula); B5, medial (middle lobe) and inferior (lingula); B6, superior (lower lobe); B7, medial basilar (lower lobe); B8, anterior (lower lobe); B9, lateral basilar (lower lobe); B10, posterior (lower lobe). |
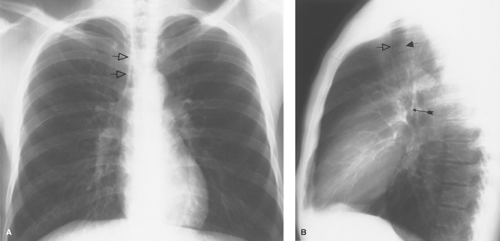 Figure 12.4. Trachea. A. The right paratracheal stripe (open arrows) is composed of the right lateral tracheal wall, a small amount of mediastinal fat, paratracheal lymph nodes, and the visceral and parietal pleural layers of the right upper lobe. B. Left lateral chest film shows the anterior (open arrow) and posterior (short solid arrow) walls of the trachea. The posterior wall of the bronchus intermedius (long solid arrow) is readily visible on lateral radiographs as it crosses the end-on view of the left upper lobe bronchus. Because these structures are central, their relationship tends to remain even on rotated films. This is easily seen on CT (see Fig 12.5B, image 3). |
The trachea is approximately 12 cm long in adults, with an upper limit of normal coronal tracheal diameter of 25 mm in men and 21 mm in women. In cross section, the trachea is oval or horseshoe-shaped, with a coronal-to-sagittal diameter ratio of 0.6:1.0. A narrowing of the coronal diameter producing a coronal-to-sagittal ratio of <0.6 is termed a saber sheath trachea and is seen in patients with chronic obstructive pulmonary disease.
On chest radiographs, the trachea is seen as a vertically oriented cylindric lucency extending from the cricoid cartilage superiorly to the main bronchi inferiorly. A slight tracheal deviation to the right after entering the thorax can be a normal radiographic finding. The interface of the right upper lobe (RUL) with the right lateral tracheal wall is called the right paratracheal stripe (Fig. 12.4A). This stripe should be uniformly smooth and should not exceed 4 mm in width; thickening or nodularity reflects disease in any of the component tissues, including medial tracking pleural effusion. The left lateral wall is surrounded by mediastinal vessels and fat and is not normally visible radiographically. The posterior trachea can be visualized on the lateral chest (Fig. 12.4B). The presence of air in the esophagus produces the tracheoesophageal stripe, which represents the combined thickness of the tracheal and esophageal walls and intervening fat. This stripe should measure less than 5 mm; thickening is most commonly seen with esophageal carcinoma.
The bronchial system exhibits a branching pattern of asymmetric dichotomy, with the daughter bronchi of a parent bronchus varying in diameter, length, and the number of divisions. The bronchial generation “n” indicates the number of divisions since the trachea, which bears generation number 1 (8). The main bronchi arise from the trachea at the carina, with the right bronchus forming a more obtuse angle with the long axis of the trachea. The right main bronchus is considerably shorter than the left main bronchus (mean lengths of 2.2 and 5 cm, respectively). The tracheal and main, lobar, and segmental bronchial anatomy are easily seen on CT (Fig. 12.5). Bronchi on end can be seen as a ring shadow on chest radiographs. Bronchi gradually lose their cartilaginous support between generations 1 and 12 to 15. Once this happens, these 1- to 3-mm airways are called bronchioles (9). Bronchioles bearing alveoli on their walls are termed respiratory bronchioles. The latter divide into alveolar ducts and alveolar sacs. The airway just before the first respiratory bronchiole is the terminal bronchiole. It is the smallest bronchiole without respiratory exchange structures. In average, a total of 21 to 25 generations are found between the trachea and the alveoli.
Lobar and Segmental Anatomy (Fig. 12.6). The lungs are divided by the interlobar fissures, which are invaginations of the visceral pleura. On the right, the minor fissure separates the middle from the upper lobe. The major fissure separates the lower lobe from the upper lobe superiorly and from the middle lobe inferiorly. The upper lobe bronchus and its artery, arising from the truncus anterior, branch into three segmental branches: anterior, apical, and posterior. The middle lobe bronchus arises from the intermediate bronchus and divides into medial and lateral segmental branches, with its blood supplied by a branch of the right interlobar pulmonary artery. The right lower lobe (RLL) is supplied by the RLL bronchus and pulmonary artery. It is subdivided into a superior segment and four basal segments: anterior, lateral, posterior, and medial.
The left lung is divided into upper and lower lobes by the left major fissure. The left upper lobe (LUL) is analogous to the combined right upper and middle lobes. The LUL is subdivided into four segments: anterior, apicoposterior, and the superior and inferior lingular segments. Arterial supply to the anterior and apicoposterior segments parallels the bronchi and is via branches of the upper division of the left main pulmonary artery. The superior and inferior lingular arteries are proximal branches of the left interlobar pulmonary artery, analogous to the middle lobe’s blood supply. The left lower lobe (LLL) has a superior segment and three basal segments: anteromedial, lateral, and posterior.
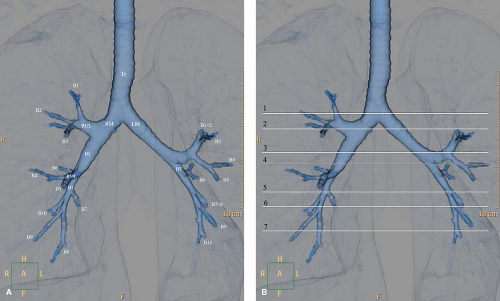 Figure 12.5. Tracheobronchial and Hilar Anatomy. A. Three-dimensional volume-rendered virtual bronchographic view of the bronchial tree. Tr, trachea; RM, right main bronchus; LM, left main bronchus; RUL, right upper lobe; RML, right middle lobe; LUL, left upper lobe; BI, bronchus intermedius; BT, basal trunk. B. Levels of the CT images depicting the bronchial and hilar anatomy. 1. Level of tracheal carina. Right apical bronchus (1); right superior posterior pulmonary vein (rv); left apicoposterior bronchus (1 and 2 on the left). 2. Level of right upper lobe bronchus. Right main bronchus (RM); right upper lobe bronchus (ru); right upper lobe anterior (3) and posterior (2) segmental bronchi; right superior pulmonary vein (rv); left main bronchus (LM); left apicoposterior segmental bronchus (1 + 2); left superior pulmonary vein (lv). 3. Level of left upper lobe bronchus, superior division. Bronchus intermedius (BI), with its posterior border at the level of the left main (LM); right superior pulmonary vein (rv); superior division of left upper lobe bronchus (small arrows); left upper lobe anterior (3) and apicoposterior (1 + 2) segmental bronchi; left descending pulmonary artery (Ld). 4. Level of left upper lobe bronchus, inferior (lingular) division. Bronchus intermedius (BI); right descending pulmonary artery (Rd); lingular bronchus (4 + 5); left lower lobe bronchus (LL); left lower lobe superior segmental bronchus (6); left descending pulmonary artery (Ld). 5. Level of middle lobe bronchus. Middle lobe bronchus (4 + 5); right lower lobe bronchus (RL); right descending pulmonary artery (Rd); lingular superior segmental bronchus (4); left lower lobe basal trunk (BT); left lower lobe segmental arteries (a). 6. Level of lower lobe basal trunks. Lateral (4) and medial (5) segmental bronchi of the middle lobe; right lower lobe basal trunk (BT); right lower lobe basal segmental arteries (a, on right); lingular segmental bronchus (5); left lower lobe anteromedial segmental bronchus (7 + 8); left lower lobe lateral and posterior basal segmental bronchi (9 + 10); left lower lobe basal segmental arteries (a, on left).7. Level of basal segmental bronchi. Right lower lobe medial (7, on right), anterior (8, on right), lateral (9, on right), and posterior (10, on right) basal segmental bronchi; right inferior pulmonary vein (v, on right); left lower lobe medial (7, on left), anterior (8, on left), lateral (9, on left), and posterior (10, on left) basal segmental bronchi; left inferior pulmonary vein (v, on left). |
Respiratory Portion of Lung. The respiratory bronchioles contain a few alveoli along their walls and give rise to the gas-exchanging units of the lung: the alveolar ducts and the alveolar sacs. The pulmonary alveolus is lined by two types of epithelial cells (pneumocytes). Type 1 pneumocytes are flattened squamous cells covering 95% of the alveolar surface area and are invisible by light microscopy. These cells are incapable of mitosis or repair. The rarer type 2 pneumocytes are cuboidal cells, which are visible under light microscopy and are capable of mitosis. Type 2 pneumocytes are the source of new type 1 pneumocytes and provide a mechanism for repair following alveolar damage. These cells are also thought to be the source of alveolar surfactant, a phospholipid that lowers the surface tension of alveolar walls and prevents alveolar collapse at low lung volumes.
Pulmonary Subsegmental Anatomy is discussed in Chapter 17, along with the HRCT description of these anatomic structures.
Fissures. The interlobar pulmonary fissures represent invaginations of the visceral pleura deep into the substance of the lung (Fig. 12.6) (10). These fissures may completely or incompletely separate the lobes from one another. An incomplete fissure has important consequences regarding interlobar spread of parenchymal consolidation, collateral air drift in patients with lobar bronchial obstruction, and the appearance of pleural effusion in the supine patient. The fissures are well delineated on CT or HRCT (Fig. 12.7).
In most individuals, there are two interlobar fissures on the right and one on the left. The fissures are complete laterally and incomplete medially, fusing with the adjacent lobe. The minor fissure is complete in about 25% of individuals but fuses with the RUL in about 50%. The inferior fissure of the right middle lobe (RML) is well developed and there is very little fusion between the RML and the RLL. This oblique fissure is complete in less than 35% of individuals, with fusion between the lobes most common along the posteromedial portion of the fissure. The left major fissure is similar to the right major fissure, with fusion along the posterior aspect in approximately 35% of individuals.
The major and minor fissures are best visualized on lateral radiographs. Variable portions of the major fissures are seen
as obliquely oriented, thin white lines coursing anteroinferiorly from posterior to anterior. The left major fissure usually begins more superiorly and has a slightly more vertical course than the right major fissure. At their points of contact with the diaphragm or chest wall, the fissures often have a triangular configuration, with the apex of the triangle pointing toward the fissure. This appearance is the result of the presence of a small amount of fat within the distal aspect of the fissure. Although the major fissures are not usually visualized on frontal radiographs because of their oblique course relative to the x-ray beam, occasional extrapleural fat infiltration along their superolateral aspect can give rise to a curvilinear edge in the upper thorax. The minor fissure projects at the level of the right fourth rib and is seen as a thin undulating line on frontal radiographs in approximately 50% of individuals. On a lateral radiograph, the minor fissure is often seen as a thin curvilinear line with a convex superior margin. Not uncommonly, the posterior aspect of the minor fissure extends posterior to the margin of the right major fissure. This is because the minor fissure abuts the entire convexity of the anterior lower lobe, but the major fissure interface is caused by the crest of the convexity.
as obliquely oriented, thin white lines coursing anteroinferiorly from posterior to anterior. The left major fissure usually begins more superiorly and has a slightly more vertical course than the right major fissure. At their points of contact with the diaphragm or chest wall, the fissures often have a triangular configuration, with the apex of the triangle pointing toward the fissure. This appearance is the result of the presence of a small amount of fat within the distal aspect of the fissure. Although the major fissures are not usually visualized on frontal radiographs because of their oblique course relative to the x-ray beam, occasional extrapleural fat infiltration along their superolateral aspect can give rise to a curvilinear edge in the upper thorax. The minor fissure projects at the level of the right fourth rib and is seen as a thin undulating line on frontal radiographs in approximately 50% of individuals. On a lateral radiograph, the minor fissure is often seen as a thin curvilinear line with a convex superior margin. Not uncommonly, the posterior aspect of the minor fissure extends posterior to the margin of the right major fissure. This is because the minor fissure abuts the entire convexity of the anterior lower lobe, but the major fissure interface is caused by the crest of the convexity.
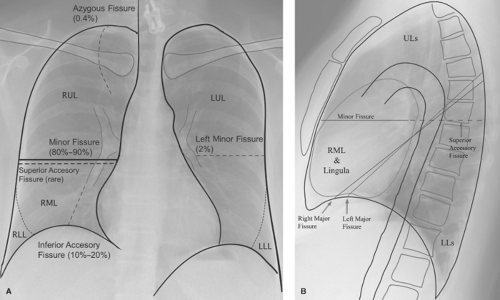 Figure 12.6. Normal Lobar and Fissural Anatomy. A. Frontal view. B. Lateral view. RUL, right upper lobe; LUL, left upper lobe; RML, right middle lobe; RLL, right lower lobe; LLL, left lower lobe; ULs, upper lobes; LLs, lower lobes. |
The inferior accessory fissure is the most common accessory fissure and is found in approximately 10% to 20% of individuals. This fissure, which separates the medial basal from the remaining basal segments of the lower lobe, is often incomplete (Fig. 12.6). It may be seen on frontal radiographs as a thin curvilinear line extending superiorly from the medial third of the hemidiaphragm toward the lower hilum. The inferior accessory fissure has been misidentified as the inferior pulmonary ligament (invisible on normal chest radiographs) and is responsible for the juxtaphrenic peak described in upper lobe volume loss. A small triangle of extrapleural fat, seen at its point of insertion on the diaphragm, helps identify the inferior accessory fissure. An inferior accessory fissure can be seen on CT scans through the lower thorax, where it is identified as a curvilinear line extending anterolaterally from just in front of the inferior pulmonary ligament toward the major fissure.
The azygos fissure is seen in 0.5% of individuals (Fig. 12.6). It is composed of four layers of pleura (two visceral and two parietal) and represents an invagination of the right apical pleura by the azygos vein, which has incompletely migrated to its normal position at the right tracheobronchial angle. The azygos fissure appears as a vertical curvilinear line, convex laterally, which extends inferiorly from the lung apex and ends in a teardrop, which is the azygos vein. The significance of this fissure lies in its ability to limit the spread of apical segmental consolidation to the azygos lobe (that portion of the apical segment delineated by the azygos fissure) and in excluding pneumothorax from the apical portion of the pleural space.
The superior accessory fissure separates the superior segment from the basal segments of the lower lobe. On the right side it may be distinguished from the minor fissure on lateral radiographs because it extends posteriorly from the major fissure to the chest wall.
The left minor fissure is a rarely seen normal variant that separates the lingula from the remaining portions of the upper lobe.
Ligaments. The inferior pulmonary ligament is a sheet of connective tissue that extends from the hilum superiorly to a level at or just above the hemidiaphragm. Thus, it comprises fused visceral and parietal pleura and binds the lower lobe to the mediastinum and runs alongside the esophagus. The ligament contains the inferior pulmonary vein superiorly and a variable number of lymph nodes. The inferior pulmonary ligament is sometimes seen on CT scans through the lower thorax as a small laterally directed beak of mediastinal pleura adjacent to the esophagus (Fig. 12.8). The tethering effect of this ligament on the lower lobe accounts for the medial location
and triangular appearance of lower lobe collapse. The ligament may also act as a barrier to the spread of pleural and mediastinal fluid and may marginate medial pleural or mediastinal air collections to produce a characteristic appearance on radiographs.
and triangular appearance of lower lobe collapse. The ligament may also act as a barrier to the spread of pleural and mediastinal fluid and may marginate medial pleural or mediastinal air collections to produce a characteristic appearance on radiographs.
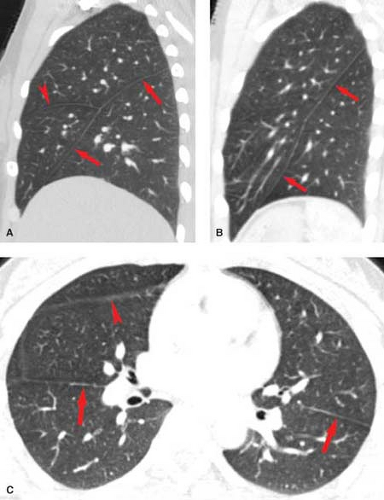 Figure 12.7. Fissural Anatomy on Multidetector CT. A. CT with sagittal reconstruction through the right lung shows major (arrows) and minor (arrowhead) fissures. B. CT with sagittal reconstruction through the left lung shows major fissure (arrows). C. Axial CT shows the oblique fissures as thin lines (arrows). The minor fissure (arrowhead) is indistinct owing to its domed shape and oblique orientation. |
The sublobar septum (Fig. 12.8) has been mistaken for the inferior pulmonary ligament. It is a linear structure seen on CT near the inferior pulmonary ligament extending into the lung from the mediastinal pleura.
The pericardiophrenic ligament is a triangular density extending toward the lung that is seen along the posterior aspect of the right heart border on lung windows on chest CT (Fig. 12.8). It represents a reflection of pleura over the inferior portion of the phrenic nerve and pericardiophrenic vessels. It is distinguished from the sublobar septum by its more anterior location and by its characteristic ramifications as branches of the nerve and vessel reflect over the hemidiaphragm.
Pulmonary Arteries (Fig. 12.9A–C) (11). The pulmonary artery is an elastic artery that arises from the right ventricle at approximately 1-o’clock position relative to the ascending aorta. These two structures then rotate from right to left as they ascend in the mediastinum until the pulmonary artery lies at the 5-o’clock position. The left pulmonary artery is a direct continuation of the main pulmonary artery. The right artery branches just below the carina, with an angle close to 90°. Within the left hilum, the artery envelopes the upper margin of the left main bronchus, at which point it divides into the upper and lower lobe arteries. The arch formed by
the LLL artery over the left hilar bronchi (i.e., the bronchus is hypoarterial) is easily seen on the lateral view. On the other hand, the right pulmonary artery courses laterally and anterior to the main bronchus. The right artery divides within the pericardium into the truncus anterior and interlobar arteries. In contradistinction to the left side, the right interlobar artery courses anterolateral to the bronchus (i.e., the bronchus is epiarterial). The different spatial relationships are essential when determining bronchial and pulmonary situs. At the same level that the bronchi lose their cartilage and become bronchioles, the elastic arteries lose their elastic lamina and become muscular arteries. Thickening of the alveolocapillary membrane from edema fluid or fibrosis impedes gas exchange and results in dyspnea and hypoxemia.
the LLL artery over the left hilar bronchi (i.e., the bronchus is hypoarterial) is easily seen on the lateral view. On the other hand, the right pulmonary artery courses laterally and anterior to the main bronchus. The right artery divides within the pericardium into the truncus anterior and interlobar arteries. In contradistinction to the left side, the right interlobar artery courses anterolateral to the bronchus (i.e., the bronchus is epiarterial). The different spatial relationships are essential when determining bronchial and pulmonary situs. At the same level that the bronchi lose their cartilage and become bronchioles, the elastic arteries lose their elastic lamina and become muscular arteries. Thickening of the alveolocapillary membrane from edema fluid or fibrosis impedes gas exchange and results in dyspnea and hypoxemia.
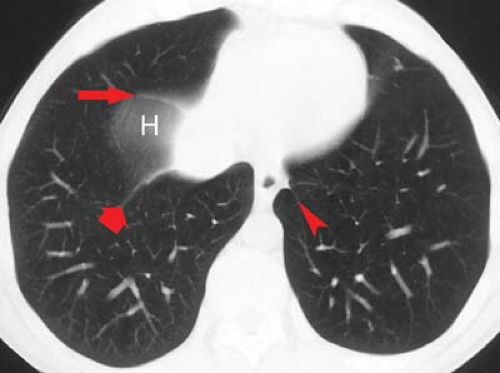 Figure 12.8. Inferior Pulmonary and Pericardiophrenic Ligaments. A CT scan just above the diaphragm demonstrates a thin line (arrowhead) extending posterolaterally at the level of the esophagus that represents the sublobar septum extending to the inferior pulmonary ligament. On the right, a curvilinear line (fat arrow) extending from just lateral to the inferior vena cava represents the right pericardiophrenic ligament containing branches of the phrenic nerve and pericardiophrenic vessels. More anteriorly, a thin line (arrow) is seen just above the apex of the right hemidiaphragm (H), which represents fat within the inferior aspect of the major fissure. |
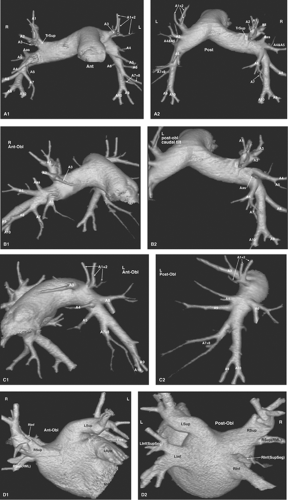 Figure 12.9. Prevailing Pattern of Segmental Arteries and Venous Returns. Three-dimensional volume-rendered images of the pulmonary arterial system in different views depict the most usual arterial anatomy. The branches of the right and left pulmonary arteries accompany and divide in parallel with the corresponding bronchi. A. Left and right pulmonary arteries; (1) anterior view and (2) posterior view. B. Right pulmonary artery; (1) anterior view and (2) posterior view. C. Left pulmonary artery; (1) anterior view and (2) posterior view. TrSup, truncus superior; A1, apical (upper lobe); A2, posterior (upper lobe); A3, anterior (upper lobe); A4, lateral (middle lobe) and superior (lingula); A5, medial (middle lobe) and inferior (lingula); A6, superior (lower lobe); A7, medial basal (lower lobe); A8, anterior basal (lower lobe); A9, lateral basal (lower lobe); A10, posterior basal (lower lobe). Note that the right upper lobe receives an accessory branch from the proximal right interlobar pulmonary artery (Aas). D. Left atrium and venous returns; (1) anterior view and (2) posterior view. Three-dimensional volume-rendered images of the left atrium and venous returns depict the most usual venous return anatomy. Significantly more variation exists than in the bronchial/arterial systems. Although only the main returns are depicted here, the reader will find an extensive discussion in Yamashita (11). RSup, Right superior venous return; LSup, left superior venous return; RInf, right inferior venous return; LInf, left inferior venous return. Several branches can join the left atrium separate from their lobar venous return. The most common ones are RSup (RML), right middle lobe branch of the RSup; LInf(SupSeg) and RInf(SupSeg), branches from the superior segments of the lower lobes. Lapp, Left atrial appendage; MV, mitral valve plane. |
Bronchial Arteries are the primary nutrient vessels of the lung. They supply blood to the bronchial walls to the level of the terminal bronchioles. In addition, several mediastinal structures receive a variable amount of blood supply from the bronchial circulation. These include the tracheal wall, middle third of the esophagus, visceral pleura, mediastinal lymph nodes, vagus nerve, pericardium, and thymus.
The bronchial arteries usually arise from the proximal descending thoracic aorta at the level of the carina but may show significant variability. Most commonly there are one right-sided and two left-sided arteries. The right bronchial artery usually arises from the posterolateral wall of the aorta in common with an intercostal artery as an intercostobronchial trunk. The left bronchial arteries arise individually from the anterolateral aorta or, rarely, from an intercostal artery. Approximately two-thirds of the blood from the bronchial arterial system returns to the pulmonary venous system via the bronchial veins (a small right-to-left shunt). The remaining blood, which includes veins draining the large bronchi, tracheal bifurcation, and mediastinum, drains into the azygos or hemiazygos systems.
Pulmonary Veins (Fig. 12.9D) arise within the interlobular septa from the alveolar and visceral pleural capillaries. The veins travel in connective tissue envelopes that are separate
from the bronchoarterial trunks. The pulmonary veins, which may number from three to eight, drain into the left atrium.
from the bronchoarterial trunks. The pulmonary veins, which may number from three to eight, drain into the left atrium.
Pulmonary Lymphatics help clear fluid and particulate matter from the pulmonary interstitium. There are two major lymphatic pathways in the lung and pleura. The visceral pleural lymphatics, which reside in the vascular (innermost) layer of the visceral pleura, form a network over the surface of the lung that roughly parallels the margins of the secondary pulmonary lobules. These peripheral lymphatics penetrate the lung to course centrally within interlobular septa, along with the pulmonary veins, toward the hilum. The parenchymal lymphatics originate in proximity to the alveolar septa (“juxta-alveolar lymphatics”) and course centrally with the bronchoarterial bundle. The perivenous and bronchoarterial lymphatics communicate via obliquely oriented lymphatics located within the central regions of the lung. These perivenous lymphatics and their surrounding connective tissue, when distended by fluid, account for the radiographic appearance of Kerley A lines.
Pulmonary Interstitium is the scaffolding of the lung and as such provides support for the airways and pulmonary vessels (Fig. 12.10) (10). It begins within the hilum and extends peripherally to the visceral pleura. The interstitial compartment that extends from the mediastinum and envelopes the bronchovascular bundles is termed the axial interstitium. The axial fiber system continues distally as the centrilobular interstitium along with the arterioles, capillaries, and bronchioles to provide support for the air-exchanging portions of the lung. The subpleural interstitium and interlobular septa are parts of
the peripheral interstitium, which divides secondary pulmonary lobules. The pulmonary veins and lymphatics lie within the peripheral interstitium. The intralobular interstitium is a thin network of fibers that bridges the gap between the centrilobular and peripheral compartments.
the peripheral interstitium, which divides secondary pulmonary lobules. The pulmonary veins and lymphatics lie within the peripheral interstitium. The intralobular interstitium is a thin network of fibers that bridges the gap between the centrilobular and peripheral compartments.
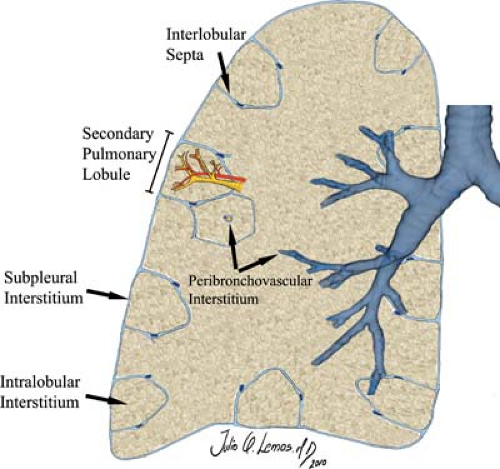 Figure 12.10. Diagram of the Pulmonary Interstitium. |
Edema involving the axial interstitium is recognized radiographically as peribronchial cuffing. Pathologic involvement of the intralobular interstitium is difficult to discern radiographically, but may account for some cases of so-called “ground-glass” opacity on chest radiographs and HRCT scans. Thickening of portions of this interstitium are occasionally seen as intralobular lines on HRCT. Radiographically, edema of the peripheral and subpleural interstitium accounts for Kerley B lines (or interlobular lines on HRCT) and “thickened” fissures on chest radiographs.
Posteroanterior Chest Radiograph
A firm knowledge of the normal anatomy displayed on the frontal (usually PA) chest radiograph is key to detecting and localizing pathologic conditions and to avoid mistaking normal structures for pathologic findings (Fig. 1A).
Soft Tissues of the chest wall consist of the skin, subcutaneous fat, and muscles. The lateral edges of the sternocleidomastoid muscles are readily visible in most patients. The visualization of normal fat in the supraclavicular fossae and the companion shadows of skin and subcutaneous fat paralleling the clavicles helps exclude mass, adenopathy, or edema in this region. The inferolateral edge of the pectoralis major muscle is normally seen curving toward the axilla. Both breast shadows should be evaluated routinely to detect evidence of prior mastectomy or distorting mass. The soft tissues lateral to the bony thorax should be smooth, symmetric, homogeneous densities.
Bones. The thoracic spine, ribs and costal cartilages, clavicles, and scapulae are routinely visible on frontal chest radiographs. The bodies of the thoracic vertebrae should be vertically aligned, with endplates, pedicles, and spinous processes visualized. Twelve pairs of symmetric ribs should be seen; the upper ribs have smooth superior and inferior cortical margins, while the middle and lower ribs have flanged inferior cortices where the intercostal neurovascular bundles run. Cervical ribs are identified in approximately 2% of individuals and may be associated with symptoms of thoracic outlet syndrome. Companion shadows paralleling the inferior margins of the first and second ribs represent extrapleural fat, which may be abundant in obese individuals. Costal cartilage calcification is seen in a majority of adults, increases in prevalence with advancing age, and can add multiple shadows to the PA view. Men typically show calcification at the upper and lower margins, while the majority of women develop central cartilaginous calcification.
Lung–Lung Interfaces. A familiarity with the normal mediastinal interfaces is key to the interpretation of frontal chest radiographs (2). The lung–mediastinal interfaces are seen as sharp edges where the lung and adjacent pleura reflect off of various mediastinal structures. The lung–lung interfaces as seen on frontal radiographs relate directly to the space available in three regions viewed on the lateral film: the retrosternal space, the retrotracheal triangle, and the retrocardiac space (Fig. 12.11).
The retrosternal airspace reflects contact of the anterosuperior aspect of the upper lobes (Fig. 12.11). On frontal radiographs, the anterior junction line is seen as a thin vertical line that overlies the thoracic spine (Fig. 12.12). The anterior junction anatomy is an inferior extension of the upper lobe reflections off the innominate veins, with the latter producing an inverted V-shaped retromanubrial opacity. The anterior junction line often disappears after sternotomy, or when abundant anterior mediastinal fat precludes retrosternal contact of the upper lobes.
A second potential lung–lung interface is seen on the lateral chest radiograph as the retrotracheal triangle, a radiolucent region representing contact of the posterosuperior portions of the upper lobes (Fig. 12.11). If the retrotracheal
space available is small, only a right paraesophageal interface is visualized on the PA view (Fig. 12.13). If the space is large, a posterior junction line is seen (Fig. 12.12) (Table 12.4).
space available is small, only a right paraesophageal interface is visualized on the PA view (Fig. 12.13). If the space is large, a posterior junction line is seen (Fig. 12.12) (Table 12.4).
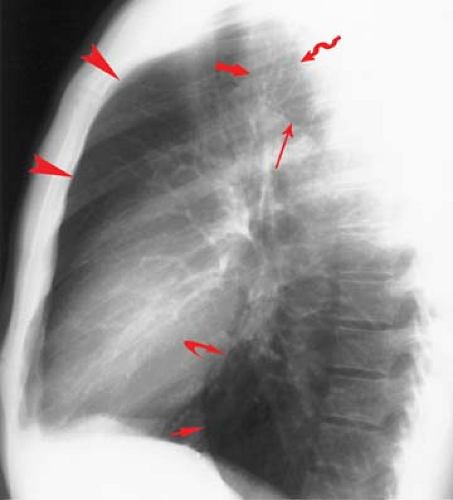 Figure 12.11. Radiolucent Spaces on Lateral Chest Radiographs. The retrosternal space is demarcated anteriorly by the posterior margin of the sternum (arrowheads) and the heart and ascending aorta posteriorly and accounts for the anterior junction line seen on frontal radiographs. The retrotracheal triangle is marginated by the posterior wall of the trachea anteriorly (fat arrow), the spine posteriorly (squiggly arrow), and the aortic arch inferiorly (solid triangle). The retrocardiac space is demarcated anteriorly by the posterior cardiac margin (curved arrow) and the inferior vena cava (small arrow). |
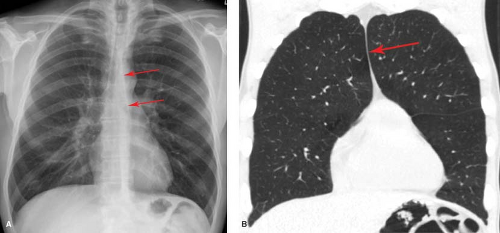 Figure 12.12. Anterior Junction Line. A. A PA chest film shows the anterior junction line (arrows). B. Coronal-reformatted CT at lung windows through the anterior thorax shows the anterior junction line (arrow). |
The third potential lung–lung interface occurs in the retrocardiac space (Fig. 12.11). If that space is large, the azygoesophageal recess of the RLL can abut the preaortic recess of the LLL to produce an inferior posterior junction line.
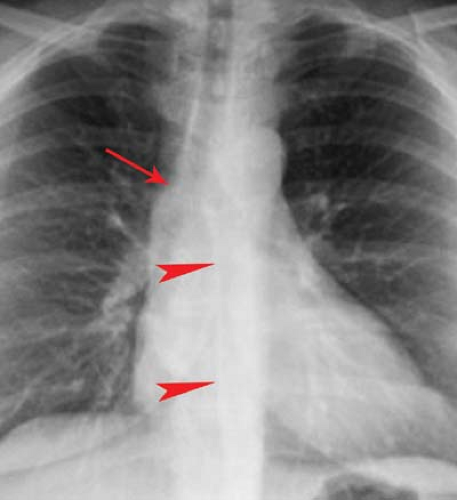 Figure 12.13. Lung–Lung Interfaces on Frontal Radiograph. Coned down view of a PA film shows the azygos arch (arrow) that separates the supra-azygos lung from the infra-azygos lung, which creates the azygoesophageal recess interface (arrowheads). |
Lung–Mediastinal Interfaces (Table 12.5). The right lateral margin of the superior vena cava is commonly seen as a straight or slightly concave interface with the RUL extending from the level of the clavicle to the superior margin of the right atrium. Prominence or convexity of the caval interface may represent caval dilatation or lateral displacement by a dilated or tortuous aortic arch or other mediastinal mass.
Along the right upper mediastinum, the RUL contacts the right lateral tracheal wall in a majority of individuals. This produces the right paratracheal stripe (Fig. 12.4A). The thickness of this line, measured above the level of the azygos vein, should not exceed 4 mm. Thickening or nodularity of the paratracheal stripe is seen in abnormalities of the tissues comprising the strip, including tracheal tumors, paratracheal lymph node enlargement, and right pleural effusion (Fig. 12.2).
The arch of the azygos vein separates the right paraesophageal from the upper azygos esophageal space (Fig. 12.13). The measurement should be made through the midpoint of the azygos arch perpendicular to the right main bronchus. Supine positioning or performance of the Müller maneuver (forced inspiration against a closed glottis) will increase azygos venous diameter. In general, a diameter of >10 mm on a PA radiograph should raise the possibility of mass, adenopathy, or dilatation of the azygos vein; the latter may be seen with right
heart failure, obstruction of venous return to the heart, or a congenital venous anomaly such as azygos continuation of the inferior vena cava. An increase in the diameter of the azygos vein from prior comparable radiographs is more important than the actual measurement.
heart failure, obstruction of venous return to the heart, or a congenital venous anomaly such as azygos continuation of the inferior vena cava. An increase in the diameter of the azygos vein from prior comparable radiographs is more important than the actual measurement.
Table 12.4 Anterior and Posterior Junction Lines | ||||||
|---|---|---|---|---|---|---|
|
Table 12.5 Normal Lung–Mediastinal Interfaces | ||||
|---|---|---|---|---|
|
The azygoesophageal recess interface is a vertically oriented interface overlying the thoracic spine (Fig. 12.13). While normally straight or concave in contour, the middle third of the interface may have a slight rightward convexity at the level of the right inferior pulmonary veins. Convexity of the superior third of the interface should suggest subcarinal lymph node enlargement or a mass. Convexity of the middle third of this recess is usually a result of the confluence of right pulmonary veins or the right border of the left atrium. Left atrial dilatation will enlarge and laterally displace this interface, producing a double-density interface composed of the right lateral borders of both the right and the left atria. Convexity of the inferior third is most commonly due to a sliding hiatal hernia. Occasionally, a tortuous descending aorta or enlarged paraesophageal lymph nodes can cause this recess to be convex to the right in its lower third. When air is present in the distal portion of the esophagus and the azygoesophageal recess interfaces with the right lateral wall of the esophagus, a line (the right inferior esophagopleural stripe) rather than an edge is seen.
The paraspinal interface is a straight, vertical interface extending the length of the right hemithorax and represents contact of the right lung with a small amount of tissue lateral to the thoracic spine. It is inconsistently visualized on the right side. A focal convexity of this interface suggests spinal or paraspinal disease.
The right heart projects just to the right of the lateral margin of the thoracic spine on a normal PA radiograph (Fig. 12.11). This portion of the heart is the lateral margin of the right atrium, which creates a smooth convex interface with the medial segment of the middle lobe. Individuals with pectus excavatum have leftward cardiac displacement and may not demonstrate this interface. In patients with right atrial dilatation, this interface may extend well into the right lung.
The right lateral border of the inferior vena cava may be seen at the level of the right hemidiaphragm as a concave lateral interface. The inferior vena caval interface is best visualized on lateral radiographs (Fig. 12.11). This interface may be absent in patients with azygos continuation of the inferior vena cava.
In the uppermost portion of the left mediastinum, one or more interfaces may be recognized cephalad to the aortic arch. The interface most often visualized is the subclavian artery (Fig. 12.14). It is unusual for the LUL to interface with the left lateral wall of the trachea to form the left paratracheal stripe because the subclavian artery and adjacent fat usually intervene.
The transverse portion of the aortic arch (“aortic knob”) creates a small convex indentation on the left lung in normal individuals (Fig. 12.14). As the aorta elongates and dilates with age, this interface projects more laterally, and lung may be seen to encircle a greater circumference of the knob.
In approximately 5% of individuals, the left superior intercostal vein may be seen on frontal radiographs as a rounded or triangular opacity that focally indents the lung immediately superolateral to the aortic arch. This density, termed the “aortic nipple” (Fig 12.15), represents the superior intercostal vein as it arches anteriorly from its paraspinal position around the aortic arch to drain into the posterior aspect of the left innominate vein. This structure, which normally measures <5 mm, may enlarge with elevation of right atrial pressure or with congenital or acquired obstruction of venous return to the right heart.
Related posts:
Stay updated, free articles. Join our Telegram channel

Full access? Get Clinical Tree


