There are several potential pitfalls that radiologists face when interpreting images of the kidneys. Some result from image acquisition and can arise from the imaging equipment or imaging technique, whereas others are patient related. Another category of pitfalls relates to image interpretation. Some difficulties stem from methods to detect enhancement after contrast administration, whereas others are benign entities that can mimic a renal tumor. Finally, interpretation and diagnosis of fat-containing renal masses may be tricky due to the complexities discerning the pattern of fat within a mass and how that translates to an accurate diagnosis.
Key points
- •
Not all focal renal abnormalities are malignant tumors; benign neoplasms and posttraumatic, infectious, vascular, and treatment changes can mimic malignancy.
- •
Attention to technical details when interpreting renal images is paramount; radiologists must consider factors such as the imaging protocol, imaging plane, phase of enhancement, and region-of-interest placement.
- •
Identification of fat within a renal mass and characterization of the type of fat can narrow the differential diagnosis.
Introduction
In general terms, much of what we do when characterizing renal lesions involves a binary determination: an abnormality either enhances and is thus more likely to be a tumor or does not enhance and is thus more likely to be a benign lesion. However, there are many instances in which these simplistic rules do not apply. In such cases, clues to making the correct diagnosis may be historical (such as the presence of pyuria and fever or a history of renal trauma or surgery) or may relate to specific imaging features of a focal abnormality (such as shape or the presence of intralesional fat). Further, several technical pitfalls may be encountered when interpreting renal images. These pitfalls may be related to contrast delivery, phase of enhancement, or collecting system opacification after contrast administration; imaging plane orientation with respect to a renal abnormality; use of proper window and level settings during image interpretation; and placement of regions of interest (ROIs) to measure attenuation or signal intensity. In addition, several focal renal lesions can mimic tumors. These pseudotumors may be congenital, may have a vascular origin, may result from prior infection or trauma, or may be related to therapy for renal cell carcinoma (RCC) such as partial nephrectomy or tumor ablation. Finally, the detection of either microscopic or macroscopic fat within renal masses affects the differential diagnosis, and so appropriate methods must be used to detect fat and interpret the resulting images. This article reviews these potential pitfalls in renal imaging.
Technical pitfalls
Technical pitfalls in renal imaging may be patient related, image acquisition related, or interpretation related ( Table 1 ). When patients move or fail to hold their breath during image acquisition, attenuation measurements may be spuriously increased or decreased, and image degradation and blurring may occur. These misregistration artifacts usually seem as shading or streaking in the reconstructed image.
| Element | Description |
|---|---|
| Motion | Spurious increased or decreased attenuation |
| Window level settings | Altered lesion detectability |
| Imaging plane with respect to lesion location | Decreased lesion visibility in some planes vs in others |
| Phase of contrast | Diminished detectability in corticomedullary phase |
| Pseudoenhancement | Spurious increased attenuation in contrast-enhanced phase vs in unenhanced phase |
Sometimes, renal abnormalities may be less well depicted or difficult to identify based on their position in the kidney with respect to the imaging plane. For example, a renal mass in the upper or lower pole may be easily scrolled past when viewed on the PACS workstation but may be more obvious to the reader when visualized in the coronal or sagittal plane ( Fig. 1 ). Multiplanar reformatted images can improve the reader’s confidence in the identification of small masses that more clearly deform the renal contour when viewed in one plane than in another. A study that assessed missed imaging findings by radiology residents found that 5.5% of missed findings on abdomen and pelvic computed tomographic (CT) images were cases of pyelonephritis and that residents believed that the use of coronal images would help to provide a thorough evaluation of the renal cortices.

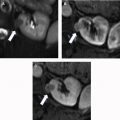
The phase of contrast during which imaging occurs can also greatly affect the detectability of renal masses. One study found that nephrographic phase images, when compared with medullary phase images, can show 1.3 times more masses in the renal cortex and 4 to 5 times more masses in the medulla , ( Fig. 2 ). Although the phases of renal enhancement may vary based on the rate of delivery of contrast material, generally speaking, the corticomedullary phase occurs approximately 30 to 40 seconds after the beginning of contrast administration and the nephrographic phase begins at 80 to 120 seconds. Because the speed of CT scanners has increased, the kidneys are now often visualized during the corticomedullary phase on single-phase, routine abdominal protocol CT scans. Small hyperenhancing clear cell RCCs (ccRCCs) can be particularly difficult to detect during this phase, as these lesions may be isoattenuating to normal parenchyma in the corticomedullary phase and may only be discernible based on subtle interruption of normal corticomedullary enhancement or heterogeneous tumor enhancement ( Fig. 3 ).


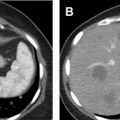
Another technical pitfall encountered in renal imaging is the phenomenon of pseudoenhancement, which involves mischaracterizing a renal cyst as an enhancing neoplasm because of a false attenuation change between unenhanced and enhanced images. Pseudoenhancement is thought to be the result of multidetector, spiral CT image reconstruction algorithms that adjust for beam-hardening effects. Several factors may affect the degree of pseudoenhancement, including lesion size or location, degree of renal parenchymal enhancement, number of CT detector rows, peak tube voltage, and reconstruction kernel. This phenomenon tends to occur most notably with small (<1 cm) and intraparenchymal lesions ( Fig. 4 ). If pseudoenhancement is suspected, ultrasound imaging or MR imaging can be used to determine whether the mass is truly cystic or solid.

Region-of-interest placement and interpretation
The placement and interpretation of ROI attenuation measurements for the evaluation of renal masses can also be problematic. The most fundamental pitfall is using visual inspection alone to assess the attenuation of a renal lesion. One’s eye can be tricked by homogeneous low-attenuation solid lesions mimicking cysts, so routine ROI use and proper placement is essential. Radiologists should ensure that the ROIs are placed well within the boundaries of the renal mass to avoid volume averaging with normal renal parenchyma. In addition, if the image slice thickness is less than one-half of the lesion diameter, normal parenchyma cephalad or caudad to the lesion can be volume averaged into the ROI, artificially altering it.
ROIs are placed on renal abnormalities to determine a lesion’s attenuation, to assess for attenuation change between unenhanced and enhanced images (enhancement), or to detect fat within a lesion. Heterogeneity of renal lesions and the impact on ROI measurements can affect interpretation, leading to erroneous conclusions in several ways. On unenhanced CT, if a focal lesion measures less than 20 HU, has no wall thickening, is homogeneous, has no or minimal calcifications, and has no or few septa, it can be considered benign. , Discernment of heterogeneity is important to detect the uncommon RCC that measures less than 20 HU ( Fig. 5 ). In one series, RCC was found in approximately 0.5% of more than 15,000 patients, and 37% of these lesions were missed on initial interpretation, especially when the lesions were smaller than 3 cm.

Typical papillary RCCs (pRCCs) are hyperattenuating to renal parenchyma on unenhanced scans, enhance only modestly, and tend to be homogeneous. Rarely those with lower unenhanced attenuation values can mimic renal cysts on unenhanced CT scans. One study found that of 114 pRCCs, 3 were homogeneous and measured less than 20 HU on unenhanced scans ( Fig. 6 ). In another series, 24 of 104 RCCs (both ccRCCs and pRCCs) measured less than 20 HU when an ROI encompassing most of the lesion was used. However, of these 24 lesions, 21 were heterogeneous, and small ROIs could be used to detect regions within these lesions measuring more than 20 HU in the 3 that were homogeneous.

If a lesion demonstrates high attenuation on an unenhanced CT image, assessment for homogeneity is again of paramount importance. The attenuation of hemorrhagic cysts and RCC can overlap on unenhanced CT images. However, if a lesion is both homogeneous and measures 70 HU or greater, it is almost certainly benign, representing a hemorrhagic cyst ( Fig. 7 ).

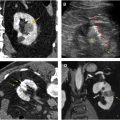
Detection of enhancement in pRCCs can be difficult, as these lesions tend to enhance only modestly. In one series, a substantial number of pRCCs showed no CT enhancement (17% [7/41]) or equivocal enhancement (9.8% [4/41]) ( Fig. 8 ). Another series found that 25% of malignant lesions characterized as Bosniak III cysts were pRCCs. This may, in part, be explained by the pathologic features of cystic change or necrosis in pRCC. , For such marginally enhancing tumors, the use of small ROIs rather than medium or large ROIs to detect enhancement has been shown to provide superior performance. More particularly, researchers found that in lesions lacking enhancement that could be identified by visual observation alone, small ROIs performed statistically significantly better than whole-lesion ROIs in distinguishing any RCC from a cyst (area under the receiver operating characteristic curve [AUC]: small ROI, 0.792; whole-lesion ROI, 0.602) and in distinguishing between pRCC and a cyst (AUC: small ROI, 0.883; whole lesion ROI, 0.642) ( Fig. 9 ).

Related posts:
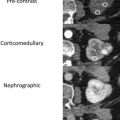 Image Interpretation
 Protocol Optimization for Renal Mass Detection and Characterization
 Radiomics and Artificial Intelligence for Renal Mass Characterization
 Percutaneous Thermal Ablation for Treatment of T1a Renal Cell Carcinomas
 Imaging of Renal Infections and Inflammatory Disease
 Use of Contrast Ultrasound for Renal Mass Evaluation
Stay updated, free articles. Join our Telegram channel

Full access? Get Clinical Tree


