At each joint, the extracellular matrix of cartilage is arranged in a complex and characteristic organization that is specific for that joint. This structure exerts a strong influence on the appearance of magnetic resonance (MR) images through orientation-related alterations in T2 decay. As a result, the MR appearance of cartilage at each joint is predictable and specific for that joint. The diagnostic utility of MR imaging for evaluating cartilage is enhanced when the acquisition and review of the images is informed by an understanding of this relationship between normal structure and the MR appearance of cartilage.
The ability of magnetic resonance (MR) imaging to identify injuries of articular cartilage continues to improve because of the development of new sequences and advances in coil and magnet technology. As demonstrated in studies of knee MR imaging, the technique can be highly reliable if the images are of adequate quality and optimized for the visualization of the joint surface in question. The interpretation must also be performed by a motivated and knowledgeable observer who is familiar with the appearance of normal articular cartilage on MR images.
Cartilage histology
Understanding the MR appearance of normal articular cartilage requires some appreciation of the underlying histology. Articular cartilage contains a relatively small number of chondrocytes. The bulk of this tissue consists of an extracellular matrix composed of water, collagen, and proteoglycans. Large proteoglycans are trapped in a compressed configuration within a collagen network. The negatively charged carboxyl and sulfate groups attached to the glycosaminoglycan side chains of proteoglycans create an osmotic gradient across the surface of cartilage that draws water into the tissue. Collagen provides the tensile resistance to the swelling pressure created by the trapped proteoglycans. Collagen fibers also anchor cartilage to the underling bone.
This description of cartilage histology is a useful model for understanding how the stiffness of cartilage is created and maintained. It is, however, an obviously simplistic model. With any connective tissue there is relationship between the structure and physical qualities, and the extraordinary physical properties of articular cartilage suggest that the structure of cartilage is likely equally remarkable. In the normal state, cartilage is capable of resisting substantial deforming forces over the course of a lifetime while also providing a nearly frictionless articular surface. One would therefore reasonably predict that the structure of the cartilage extracellular matrix is arranged in a fashion that is optimal for providing the required biomechanical properties. Moreover, the considerable variation in the typical deforming forces experienced at different joint surfaces and different regions of a given joint surface suggests that the typical structure of cartilage is likely to be different depending on which joint or even what part of the joint surface is considered.
The results of biomechanical studies of articular cartilage are consistent with this premise that a complex and variable organization of the extracellular matrix must be present. The stresses experienced at different joint surfaces vary considerably from one to another. This variation between joint surfaces is matched by corresponding variations in the measured stiffness of articular cartilage. As would be expected, the biomechanical properties of joint surfaces vary in accordance with variations in the physical demands placed on each joint. Moreover, variations in the stress experienced at different regions of a particular joint surface parallel regional variations in stiffness. These biomechanical properties of cartilage indicate that the structure of cartilage must be joint specific and organized such that specific areas of cartilage are ideally organized to resist the deforming forces routinely experienced at a particular location. For example, one would predict that the structure of the cartilage of the tibial plateau should be different from the structure of cartilage at the radial head. Moreover, the periphery of the tibial plateau should have a structure that is different from that of the central region of the joint surface.
Despite the smooth featureless appearance on gross inspection, cartilage is not uniform. Water concentration, chondrocyte size, orientation, density, proteoglycan concentration, and collagen size all vary with depth across the thickness of cartilage. These depth-dependent variations seen on histology studies are a further indication that the matrix of cartilage is structured. Unfortunately, traditional histology uses tissue sectioning, which cuts through the matrix. This approach compromises attempts to understand the 3-dimensional tissue organization of cartilage.
If instead of cutting through the extracellular matrix of cartilage, the tissue is studied by breaking it, causing it to cleave along planes of internal structure, an internal organization becomes more apparent. The earliest example of such a technique is the use of surface split lines. Hultkrantz, in 1896, punctured the surfaces of human articular cartilage with a round awl, creating linear defects in the surface of cartilage. Using this method, the fibrous surface structure of the cartilage is in effect fractured or teased apart. As shown in Fig. 1 , these split-line studies revealed characteristic patterns that were distinct and reproducible at each of the different joint surfaces he investigated. His study demonstrated that cartilage, at least at the surface, is organized in a joint-specific manner. Hultkrantz speculated that this structure was ideally suited to meet the biomechanical demands typically faced by a given joint.

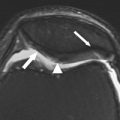
More recently, fracture sectioning of cartilage has proven to be a useful technique for directly visualizing internal matrix structure. This fracturing of cartilage is usually done after tissue freezing and in preparation for scanning electron microscopy. Low-magnification images of the fractured cartilage reveal a fibrous structure that radiates from the subchondral bone and curves through an arc of 90°, eventually curving into the plane of the joint surface. Higher-magnification images reveal that small collagen fibrils are organized into the much larger curving structure described by Jeffery and colleagues as parallel leaves of collagen and are also referred to as “fibers” by other investigators. This macroscopic structure revealed in the curved fracture plane is even apparent on gross inspection of osteochondral fractures, as shown in Fig. 2 . Jeffery and colleagues also found that the plane of matrix curvature is perpendicular to the orientation of surface split lines. This link between the surface organization described by Hultkrantz and the structure of cartilage at deeper levels strongly suggests that the organization or architecture of the extracellular matrix of cartilage is joint specific.

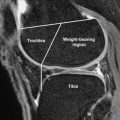
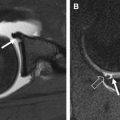
Further evidence that articular surfaces are joint specific and organized in a purposeful manner is apparent in the regional variation of cartilage structure. The structure of tibial plateau, as described through the use of scanning electron microscopy by Clark and illustrated in Fig. 3 , is an instructive example. At the central region of the tibial plateau, matrix is organized into prominent columns that radiate in parallel arrays from the subchondral bone and curve to become parallel with the joint surface only at very superficial levels. In the periphery or submeniscal region, however, a more complex and oblique curvature is present. This regional and joint-specific variation in structure is consistent with the presence of a typical extracellular matrix architecture at each joint surface. It is reasonable to assume that the matrix architecture of a given joint surface is characteristic in much the same way that trabecular bone is organized in distinctive and predictable patterns. For example, one would predict that the structure of the cartilage of the femoral head is just as characteristic as the trabecular bone organization of the femoral neck.

MR Imaging of Cartilage
On most spin-echo and fast spin-echo images, the signal intensity of cartilage is not uniform. Typically, when a joint surface is imaged with the surface perpendicular to the main magnetic field (B 0 ), 3 different layers are apparent. As seen in Fig. 4 , a low signal intensity deep or radial layer, a transitional layer of higher signal intensity, and a thin surface layer of lower signal intensity are present. These layers reflect the presence of depth-dependent variations in the T2 of cartilage. These variations in T2 are displayed in Fig. 5 . The boundaries between layers are not discreet or well defined and reflect gradual variation in T2. As a result, the relative thickness of each layer will change as the T2 weighting of the image is altered.


The second characteristic feature of MR images of cartilage is T2 anisotropy. Changes in tissue orientation relative to B 0 alter the appearance of the layers described previously. As demonstrated in Figs. 4 and 5 , the appearance of layers and T2 measurements will change depending on tissue orientation.
Both of the characteristic features of MR images of cartilage T2 decay—depth dependence and anisotropy—can be explained by the influence of the magic angle effect. Highly organized collagenous structures, such as articular cartilage, promote rapid T2 decay and low signal intensity. However, as the orientation of these fibrous structures is tilted away from the direction of B 0 , prolongation of the T2 occurs. Maximal T2 prolongation is observed at approximately 55°, the so-called magic angle. It is important to remember that this T2 prolongation is continuous and any tilt away from parallel will influence the T2. Although the effect is maximal at the magic angle, the effect is not limited to that one orientation. As a tissue curves, the T2 will lengthen and then shorten as it curves up to and past the 55° orientation. The bell-shaped curve of the T2 profile displayed on high-resolution T2 maps of cartilage is precisely what one would predict given this arc-shaped internal structure.
An interrelationship between cartilage structure and T2 has been shown on studies that correlate changes in signal intensity and T2 with the curvature of matrix structure as revealed by fracture sectioning, as displayed in Fig. 5 . This anisotropy of cartilage is apparent at all levels: there is no random or isotropic layer. It is frequently difficult to demonstrate T2 anisotropy within the transitional layer, as doing so requires aligning a curved structure with the magnetic field and avoiding the averaging of multiple orientations within a single voxel. Because the spatial resolution of MR imaging is limited, especially in the slice-thickness direction, it is extremely difficult to avoid this volume averaging at any orientation, especially on images and maps with high in-plane resolution. The result is that the T2 usually remains relatively long in the transitional layer. This difficulty in demonstrating anisotropy, however, should not be considered proof that this region is isotropic, as orientation effects can be documented across the entire depth of cartilage.
In addition to the well-described layers, there is an additional level of heterogeneity of cartilage signal intensity. On close inspection of the deepest layer of cartilage, vertically oriented striations caused by variations in cartilage T2 within the layer can be seen. Using freeze-fracture sectioning and scanning electron microscopy of the rabbit tibial plateau, ap Gwynn and colleagues described a tubular organization of the extracellular matrix. This tubular structure within the matrix may explain this additional degree of T2 heterogeneity. A columnlike organization within the deepest layer of cartilage in the tibial plateau is apparent on both the MR image and the fractured gross specimen, as displayed in Fig. 6 .

The normal appearance of cartilage on MR images is therefore a reflection of the characteristic matrix structure of the particular joint surface under consideration. The structure of cartilage determines the pattern of signal through the interrelationship between orientation to B 0 and alterations in T2 decay owing to the magic angle effect. As shown in Fig. 7 , the “layered” pattern of cartilage signal intensity is predictable but not constant, as any change in orientation will alter the appearance of the tissue.

Related posts:
 MRI of Cartilage
 Morphologic Imaging of Articular Cartilage
 Magnetic Resonance Imaging in Knee Osteoarthritis Research: Semiquantitative and Compositional Assessment
 MR Imaging of the Articular Cartilage of the Knee and Ankle
MR Imaging of Early Hip Joint Degeneration
MR Imaging of the Articular Cartilage of the Knee and Ankle
MR Imaging of Early Hip Joint Degeneration
 The Current State of Imaging the Articular Cartilage of the Upper Extremity
Stay updated, free articles. Join our Telegram channel

Full access? Get Clinical Tree


