Myopathies


  • Key Points


  • Cardiac CT’s ability to depict fine structural detail within the heart enables it to characterize the morphologic features of cardiomyopathies such as wall thickness, left ventricular mass, mass distribution, and chamber dimensions.


  • CCT’s inability of to provide functional data beyond ejection fraction limits the functional characterization of cardiomyopathies, which would need to include characterization of atrioventricular valve insufficiency, pulmonary pressures, and outflow obstruction.


  • CCT can contribute to the evaluation of undifferentiated dilated cardiomyopathy by identification or exclusion of underlying coronary artery disease.


  • CCT, unlike CMR, is able to image hearts with pacemakers and implantable cardioverter defibrillators.


Recent technical advances in cardiac CT (CCT) have been driven largely by the requirements for accurate noninvasive coronary angiography. As a consequence of improved image quality and temporal resolution, attention has also turned to the broader application of cardiac CT assessment to other disease entities. The role of CT in the assessment of cardiomyopathy has, to date, been largely restricted to the measurement of left ventricle (LV) size and function. Other modalities such as echocardiography, cardiac MR (CMR), and nuclear techniques usually are favored for work-up of these patients, with additional information often obtainable with regard to concurrent disturbances such as mitral insufficiency, pulmonary hypertension, and left ventricular outflow tract obstruction. However, disease-specific morphologic features and the potential for CT-derived tissue characterization are increasing opportunities for the assessment of nonischemic myocardial disease by this rapidly evolving modality.


Limitations of noncoronary CCT at this stage include challenges in temporal resolution for functional assessment and the significant radiation exposure often incurred with the use of retrospective reconstruction techniques. Subsequently, comparatively little has been published on the assessment of cardiomyopathies by CCT. Dose modulation can play a role in radiation reduction. For morphology and tissue characterization purposes, prospective ECG-gating, multisegment acquisition/reconstruction, and wide-range detector systems allow dynamic volume assessment with significantly reduced radiation exposures. Furthermore, the development of dual-source/spectral energy imaging holds significant potential for the refinement of tissue characterization techniques with CT.


Epidemiology in Clinical Practice


Nonatherosclerotic cardiovascular abnormalities of potential clinical relevance are seen in 4.4% of patients referred for suspected coronary artery disease (CAD). Of these, incidental hypertrophic cardiomyopathy is the most common myopathy identified (12%).


Dilated Cardiomyopathy


There is no established routine role yet for cardiac CT in the evaluation of dilated cardiomyopathies, and little role in the assessment of LV function in general, given the other means to establish it.


A potential role may arise for the negative predictive value of CCT in regard to the presence of coronary disease in cases of probable idiopathic dilated cardiomyopathy. Validation has begun in selected patients. In a single-center study, among 61 patients with dilated cardiomyopathy (DCM) and 139 patients undergoing coronary angiography, 16-slice CT yielded 99.8% negative predictive value for significant (>50%) coronary stenoses. Feasibility was 97%. The most common artifact observed in this series was a hypertrophied coronary venous system in proximity to the coronary arteries. Given the increased size of hearts with DCM and the greater spatial dispersion of the coronary tree, as well as frequent coexistence of atrial fibrillation, wide-detector CCT with the potential for single cardiac cycle acquisition may have an advantage over 64-slice CT.


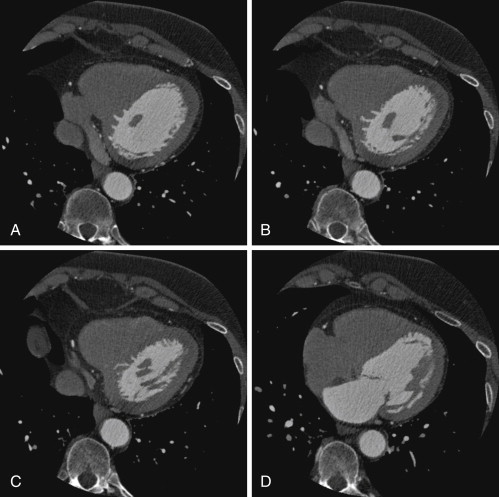
A further application may be the use of CCT before consideration of cardiac resynchronization therapy (CRT) as a single-modality assessment of cardiac function, coronary venous anatomy, regional wall motion, and scar. The presence of myocardial dyssynchrony has been assessed with CCT and shown to be reproducible and to correlate with two- and three-dimensional echocardiography measures. However, the clinical application of these techniques still must be prospectively evaluated ( Fig. 21-1 ; ).


Figure 21-1


Cardiac MRI and cardiac CT images in a 50-year-old woman with dilated cardiomyopathy and heart failure. A and B, Cardiac MRI cine steady-state free precession (SSFP) images in the four-chamber orientation with end-diastole ( A ) and end-systole ( B ). C and D, Four-chamber reconstructions from a helically acquired cardiac CT study, with end-systole ( C ) and end-diastole ( D ). Severe left ventricular dilatation is seen, with severe systolic left ventricular dysfunction. E and F, Cardiac MRI cine SSFP images in the short-axis projection with end-diastole ( E ) and end-systole ( F ). G and H, Short-axis reconstructions from a helically acquired cardiac CT study, with end-systole ( G ) and end-diastole ( H ). Severe left ventricular dilatation is seen, with severe systolic left ventricular dysfunction. The studies were obtained 2 weeks apart. There was no significant change in the patient’s medication between the two studies. Left ventricular indices are as follows: MR study: LVEDV: 272 mls, LVESV: 216 mls, LVEF: 20%; CT study: LVEDV: 274 mls, LVESV: 226 mls, LVEF: 17%. See


Hypertrophic Cardiomyopathy


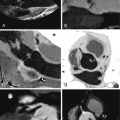
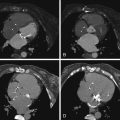
Cardiac CT is able to depict the distribution of hypertrophy in hypertrophic cardiomyopathy (HCM) and quantify it, as can CMR, although with the risk of radiation exposure, contrast allergy, and nephropathy. Validated by CMR, myocardial mass in HCM appears to be at least as good a predictor of cardiovascular mortality as wall thickness greater than 30 mm. Notably, 20% of phenotype HCM cases may have normal myocardial mass. Although echocardiography still is the mainstay of assessment of HCM and hypertrophic obstructive cardiomyopathy (HOCM), especially because of its versatile Doppler capabilities, some cases of HCM are difficult to image, especially at the apex, which is relevant when evaluating possible apical variant HCM. The excellent spatial resolution of CT also may facilitate the identification of myocardial crypts, which have been suggested as an early sign of underlying cardiomyopathy in patients who carry an HCM mutation. CMR or cardiac CT may thus complement echocardiographic assessment. The potential of CCT to plan and then assess the myocardial response to percutaneous transluminal septal ablation for HOCM also has been reported. Currently, myocardial fibrosis assessment by late gadolinium CMR is well documented and may play a role in risk stratification in the future. While its validation is currently limited to case reports, the potential for characterization of myocardial fibrosis by delayed contrast CT may demonstrate a similar utility.


Coronary CT angiography (CTA) in persons with HCM is likely to be relatively straightforward, because many are taking β-blockers to control their HCM. Feasibility of chest pain evaluation in HCM has been suggested ( Figs. 21-2 through 21-10 ;


Figure 21-2


A, Three-dimensional volume-rendered view from a left anterior oblique position in a patient with hypertrophic cardiomyopathy with a predominant apical distribution. From the outside, the heart is not remarkable. Contrast-enhanced four-chamber, short axis, three-chamber, and two-chamber views (in diastole) also are shown. The distribution of hypertrophy is predominantly apical and anterior, and notably spares the base of the septum/left ventricular outflow tract. Using automatic segmentation algorithms, the wall thickness in diastole is displayed, and is color-coded according to the severity of the thickening ( B ). The greatest thickening is apical. C, The automatic segmentation depiction of the left and right ventricular walls and cavities.


Figure 21-3


Composite images from a cardiac CT study demonstrate marked nonobstructive, predominantly apical hypertrophic cardiomyopathy. There is apical and mid-cavitary obliteration at end-systole with associated mild thinning of the left ventricular apex. Mild atherosclerotic coronary artery disease is seen. A mid-left anterior descending artery intramyocardial bridge also is present. See


Figure 21-4


Axial images from a cardiac CT demonstrate subtle asymmetric left ventricular hypertrophy of the left ventricular apex, as well as numerous crypt-like extensions of contrast into the basal inferior left ventricular wall. These findings are suspicious for hypertrophic cardiomyopathy.


Figure 21-5


Composite panel of cardiac CT and CMR images in a 64-year-old patient with an abnormal ECG and chest pain. A cardiac CT study ( A, D, G–I ) in this patient demonstrates marked asymmetric septal and anterior wall hypertrophy, very suggestive of hypertrophic cardiomyopathy (HCM). Coronary CTA ( G–I ) was normal. A corresponding follow-up CMR study confirms the diagnosis of HCM with asymmetric left ventricular hypertrophy ( B and E ). Note the punctuate foci of late gadolinium enhancement within the anterior wall ( C and F ), not seen on the single arterial phase CT study.


Figure 21-6


Composite panel of images from a cardiac CT ( A, C, and E ) and MRI ( B, D, and F ) in a patient with hypertrophic obstructive cardiomyopathy (HOCM). The patient had a history of ventricular tachycardia. A through D , Concentric left ventricular hypertrophy, more prominent in the septum, as well as right ventricular hypertrophy (CT). CT images also demonstrate a moderate-sized region of lower attenuation (likely hypoperfusion) in the mid- to inferior basal septum, with a moderate-sized focus of delayed enhancement of the inferoseptum/inferior wall. This correlates well with the late gadolinium MR image ( F ) and suggests a localized myocardial fibrosis.


Figure 21-7


Composite images in a patient with hypertrophic cardiomyopathy demonstrate a small-volume left ventricle and marked enlargement of the left atrium (diastole, A ; systole, B ) The patient has underlying atrial fibrillation, which may be related to associated diastolic dysfunction.


Figure 21-8


Composite images from cardiac CT and MRI studies in a patient with obstructive hypertrophic cardiomyopathy. CT images demonstrate systolic anterior motion (SAM) of the anterior mitral valve leaflet with SAM–septal contact. Left ventricular outflow tract CMR images demonstrate a moderate amount of intervoxel dephasing within the left ventricular outflow tract, extending into the ascending aorta and across the mitral valve plane into the left atrium . See


Figure 21-9


A and B, Two axial images from a cardiac CT data set demonstrate marked hypertrophy of the intraventricular septum. Note: right ventricular apical thickening is also present. Moderate left atrial enlargement also is present. The patient underwent subsequent myomectomy for relief of obstruction ( C ).


Figure 21-10


Alcohol septal ablation. Three septal arteries of the left anterior descending artery on septal plane maximum intensity projection images in diastole. Positions of the first ( A ), second ( B ), and third ( C ) septal branches are marked on the large image on the left. The upper (diastolic images) and lower (systolic images) show left ventricular short-axis maximum intensity projection images, corresponding to the first ( A ), second ( B ) and third ( C ) septal branches as seen in short-axis views ( arrows ). Each septal branch is wide and long in diastole, but narrow and short in systole. Diastolic images show the first septal branch arborized into two end-arteries in the myocardium and perfused entire hypertrophic myocardium at the basal interventricular septum (A).

(Reprinted with permission from Okayama S, Uemura S, Soeda T, et al. Role of cardiac computed tomography in planning and evaluating percutaneous transluminal septal myocardial ablation for hypertrophic obstructive cardiomyopathy. J Cardiovasc Comput Tomogr . 2010;4(1):62-65.)


Infiltrative Cardiomyopathy And Tissue Characterization


Tissue characterization previously has been possible only with CMR sequences to demonstrate the following:


  • Scar (late enhancement)


  • Inflammation (early relative enhancement)


  • Edema (increased T2 signal)


  • Intramyocardial fat (suppressible T1 signal)


  • Iron overload (short T2∗ time).


Cardiac CT late enhancement (5 to 10 minutes after contrast injection) techniques are beginning to evolve.


Using a definition of intramyocardial fat as attenuation of −30 to −190 Hounsfield units (without histologic validation), fat has been observed in both left and right normal healthy ventricles, as well as within areas of prior infarction. Dystrophic myocardial calcification diagnosed by CT in the absence of significant coronary disease also has been reported as a rare cause of congestive heart failure.
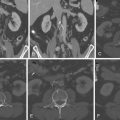


Sarcoidosis


Using 64-slice CT and scanning immediately and 10 minutes after contrast injection, delayed enhancement has been shown in a case of sarcoidosis, with a nonischemic pattern similar to that seen with CMR, and colocalizing to areas of myocardial chronic sarcoidosis thinning. Fusion single-photon emission CT (SPECT)/CT may improve diagnostic accuracy compared with SPECT alone ( Figs. 21-11 through 21-13 ; ).


Figure 21-11


First-pass CT angiographic and delayed enhancement images obtained by dual-source CT (DSCT) after injection of 100 mL contrast agent. First-pass images are reconstructed with a 0.75-mm slice thickness. Delayed images were acquired 10 minutes after contrast injection and are reconstructed as 3-mm thick multiplanar reconstruction to decrease image noise. A and B, Corresponding first-pass ( A ) and delayed ( B ) images in transaxial orientation. C and D, Corresponding short-axis reformats. In a pattern typical for cardiac sarcoidosis, thinning of the basal anterior septum with corresponding transmural enhancement in the delayed scan is clearly detectable ( large arrows ). Small arrows point to additional areas of late myocardial enhancement in the apical ( B ) and lateral ( D ) regions. The arrowheads point to the right ventricular implantable cardioverter defibrillator (ICD) electrode, which causes streak artifacts. In addition, sections of ICD electrodes are visible in the right atrium.

(Reprinted with permission from Muth G, Daniel WG, Achenbach S. Late enhancement on cardiac computed tomography in a patient with cardiac sarcoidosis. J Cardiovasc Comput Tomogr . 2008;2:272-273.)


Figure 21-12


A 39-year-old woman presented with heart block. A pacemaker was inserted. Echocardiography demonstrated moderate hypokinesis with regional variability and an apical aneurysm. As MRI was contraindicated, she came for a cardiac CT examination, which demonstrated multifocal areas of myocardial thickening associated with focal hypodensity and hypokinesis. A small inferoapical aneurysm also was noted. CT angiography demonstrated a normal left anterior descending artery and left circumflex coronary artery. The right coronary artery was partially obscured by moderate beam-hardening artifact from the pacemaker. No mediastinal lymphadenopathy was noted on the cardiac CT. The differential diagnoses based on the CT were sarcoid or myocarditis, or—less likely—myocardial metastases. A myocardial biopsy yielded a diagnosis of cardiac sarcoidosis.


Figure 21-13


Cardiac sarcoidosis. Contrast-enhanced axial ( A ) and short-axis oblique cardiac CT images ( B ). High attenuation/contrast enhancement is present in the mid-septum and the mid-anterior and lateral walls. C and D, CMR imaging reveals late gadolinium enhancement of the mid- and anterior septum and lateral walls. E and F, CMR steady-state free precession imaging demonstrates akinesis and local aneurysm of the dilation of the lateral wall segment that exhibits late enhancement. G and H, Coronary CTA demonstrates absence of coronary disease. See


Amyloidosis


In cases of amyloidosis, delayed phase scanning (10 minutes) has been shown to yield late enhancement patterns that correspond to those seen in CMR late enhancement scanning ( Fig. 21-14 ).


Figure 21-14


Composite illustration of cardiac CT in systemic amyloidosis. Multiplanar reconstructions of the early-phase CT scan using 5-mm-thick slices in a four-chamber view ( A ) show left ventricular hypertrophy. Delayed scan in a similar projection ( B ) shows late enhancement at multiple locations ( arrows ). The finding of cardiac amyloidosis was confirmed by right ventricular endomyocardial biopsy (Congo red stain, J ) showing green birefringence under polarized light ( K ). The delayed CT scan enhancement was confirmed by cardiac magnetic resonance late-enhancement imaging (inversion recovery turbo-FLASH; C, F ).

(Reprinted with permission from Marwan M, Pflederer T, Ropers D, et al. Cardiac amyloidosis imaged by dual-source computed tomography. J Cardiovasc Comput Tomogr . 2008;2(6):403-405.)


Fabry DIsease


Although Fabry disease, a disorder of α-galactosidase deficiency, is most commonly assessed with cardiac MRI and echocardiography, the characteristic findings of LV hypertrophy and associated delayed contrast enhancement patterns consistent with myocardial fibrosis have also been appreciated with CCT ( Figs. 21-15 through 21-17 ).


Figure 21-15


Axial source images of enhanced multislice CT acquired 30 seconds ( A ) and 8 minutes ( B ) after the injection of the contrast material. Images show extreme hypertrophy of the interventricular septum (IVS) and posterior wall compared with the apical and lateral walls of the left ventricle (LV). The apical and lateral portions revealed lower CT intensity than the IVS in the early phase ( arrows ). Conversely, in the late phase, the apical and lateral portions of the LV ( arrows ) were abnormally enhanced compared with the extremely hypertrophic IVS, suggesting more fibrotic changes in the apical and lateral myocardium. RV, right ventricle.

(Reprinted with permission from Funabashi N, Toyozaki T, Matsumoto Y, et al. Images in cardiovascular medicine. Myocardial fibrosis in Fabry disease demonstrated by multislice computed tomography: comparison with biopsy findings. Circulation . 2003;107(19):2519-2520.)


Figure 21-16


Cardiac CT and corresponding cardiac MRI images of a 42-year-old woman with chest pain. Four-chamber CCT ( A ), CMR SSFP ( B ), and CMR LGE ( C ), and short-axis oblique CCT ( D ), CMR SSFP ( E ), and CMR LGE ( F ) reformatted cardiac CT images through the heart. These images demonstrate concentric left and right ventricular hypertrophy. G and H, Volume-rendered images. The coronary arteries in this patient were normal, with no evidence of coronary artery disease. Given the diffuse ventricular hypertrophy, a cardiomyopathy process was considered in the differential. The patient subsequently underwent a cardiac MRI study. D F demonstrate a four-chamber and short-axis abscess at PMH through the heart confirming biventricular hypertrophy. The right most compatible demonstrates mid-wall late enhancement within the lateral wall of the left ventricle. The slight enhancement is in a nonischemic pattern. Given this pattern, one of the considerations for this patient was Fabry disease, which was confirmed by genetic testing.

Only gold members can continue reading. Log In or Register to continue

Stay updated, free articles. Join our Telegram channel

Apr 10, 2019 | Posted by in COMPUTERIZED TOMOGRAPHY | Comments Off on Myopathies

Full access? Get Clinical Tree

Get Clinical Tree app for offline access