NATURALLY OCCURRING PARAMAGNETIC SUBSTANCES INCLUDING BLOOD PRODUCTS.
KEY POINTS
- How to understand the effects of naturally occurring paramagnetic substances on computed tomography and magnetic resonance images.
- The location, origin, and evolution of abnormal blood products in the head and neck region have a significant impact on how they appear on computed tomography and magnetic resonance images.
- Paramagnetic effects on magnetic resonance images can create both very specific diagnoses as well as ambiguous and sometimes perplexing diagnostic situations.
- A thorough knowledge of paramagnetic effects and the physical principles that produce them is necessary for the accurate interpretation of images.
Paramagnetic substances shorten T1 and T2. Their visible effects vary with their concentration, location, field strength, and pulse sequences used. The most commonly encountered of these substances are the blood breakdown products also discussed elsewhere (Chapter 3). Heavy metals produced by fungi, and other metallic elements and possibly naturally occurring free radicals may produce significant effects on magnetic resonance (MR) images. These substances also have more marginal effects on computed tomography (CT) images in some normal and pathologic states.
BLOOD PRODUCTS
Bleeding occurs as part of the natural history of some head and neck lesions and will affect the imaging findings. Bleeding may be a prime clinical concern but more often is a secondary phenomenon that may aid or hinder differential diagnosis. Blood products may cause confusion during MR interpretation.
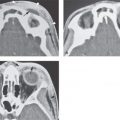
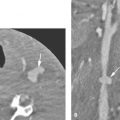
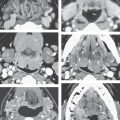
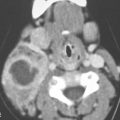
On CT examination of the extracranial head and neck, a fresh blood clot will generally appear more dense than skeletal muscle. However, fresh hemorrhage usually only is recognized following facial or neck trauma (Fig. 11.1) or an active vascular leak, where it is obviously more dense than the usual secretions and mucosal thickening seen in inflamed sinuses or the surrounding soft tissues, respectively (Fig. 11.2). It might also be recognized by the pattern of the bleed, as in the eye with a choroidal hemorrhage (Fig. 11.3). Foreign bodies can also be mistaken for blood, but the morphology of the presumed hematoma may a clue to avoid such error (Fig. 11.4).1 Increased CT density of blood is due to increased protein concentration within the clot (Fig. 11.5).2
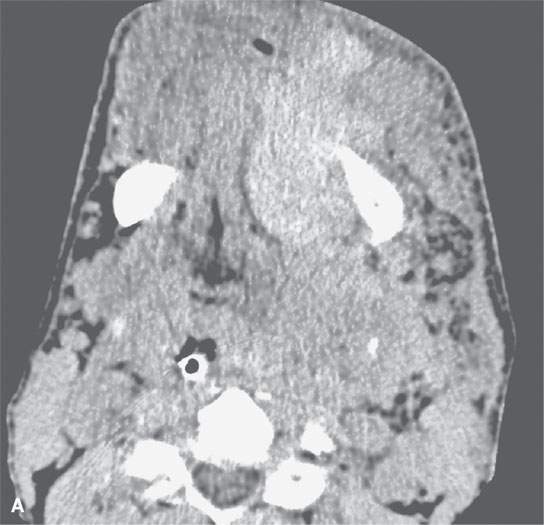
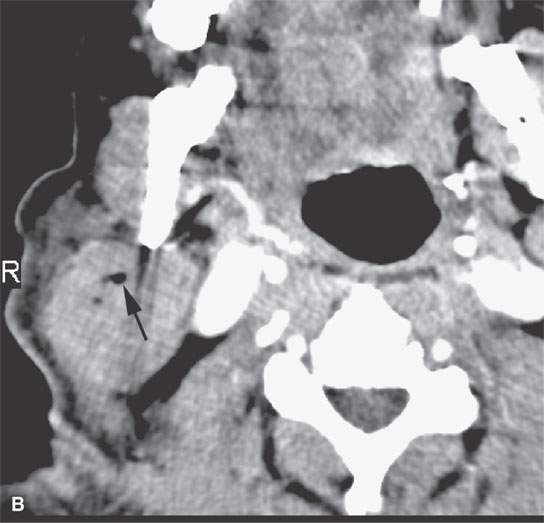
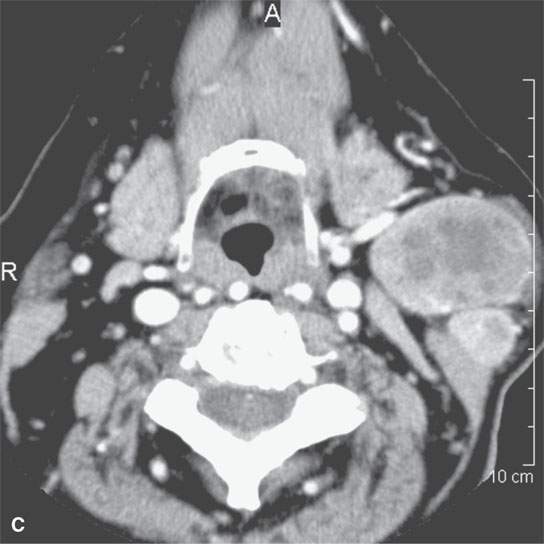
FIGURE 11.1. A: Non–contrast-enhanced computed tomography (NCCT) showing the density of the acute hematoma contributing to the airway obstruction in this trauma patient to be greater than that of muscle. B: NCCT showing gas (arrow) in a fluid collection that is of higher density than muscle. The gas is due to the needlestick; the high-density fluid collection is due to the acute hematoma. C: Contrast-enhanced computed tomography shows multiple Warthin tumors, which enlarge acutely due to hemorrhage. Based on this computed tomography, it is impossible to determine whether the densities seen within the tumors are related to the tumor or the bleed into the tumor.
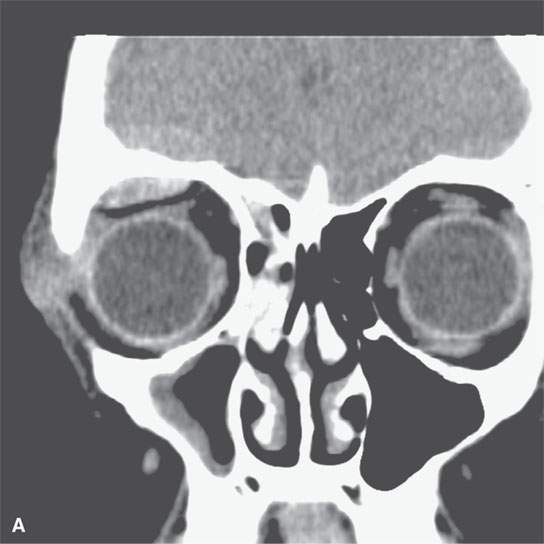
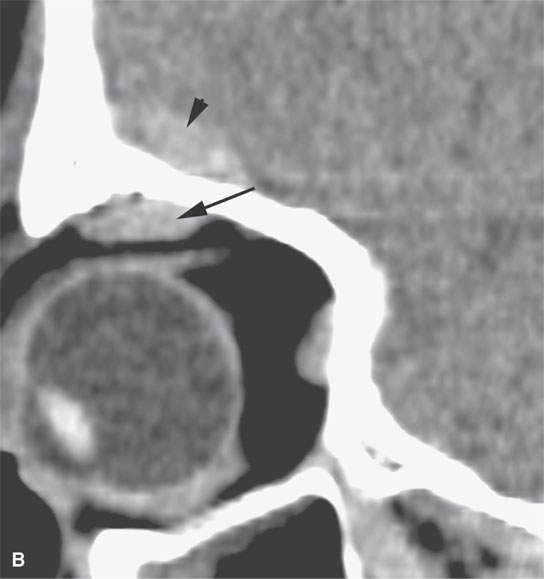
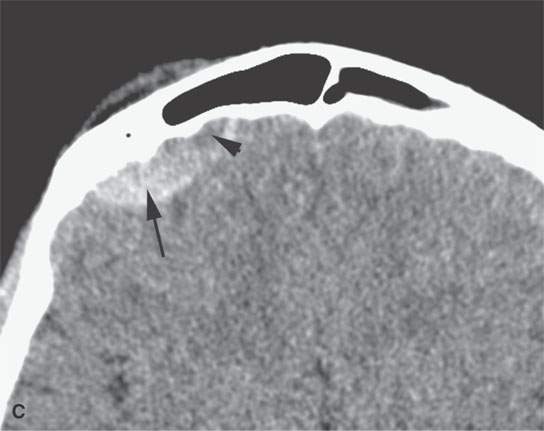
FIGURE 11.2. Non–contrast-enhanced computed tomography in a patient suffering acute cranial facial trauma. A, B: The subperiosteal (arrow) hematoma appears about the same density as the epidural hematoma (arrowhead), and both appear marginally denser than muscle. C: The epidural (arrow) is mainly denser than brain, but a small area of lesser density (arrowhead) is likely fresher clot or evidence of active bleeding. It remained stable on follow-up studies.
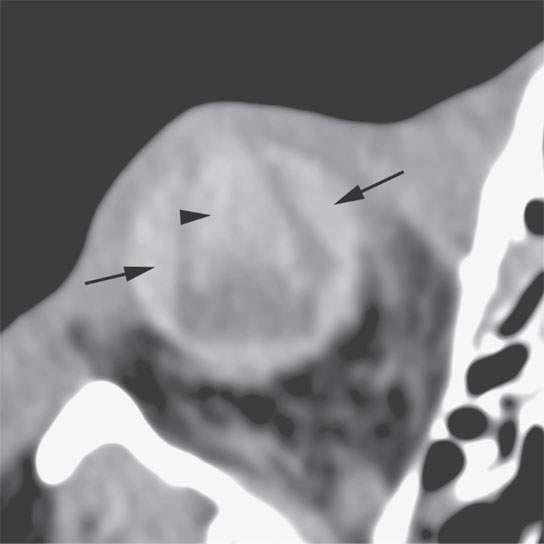
FIGURE 11.3. Non–contrast-enhanced computed tomography following penetrating trauma to the eye with what appears to be a central hemorrhage (arrowhead) through the anterior and posterior chambers and into the vitreous body, which is identified by its density, but a foreign body cannot be excluded (refer to Figure 11.4). The choroidal hemorrhage (arrows) is identified by its density and shape that conforms to the attachments of the choroid.
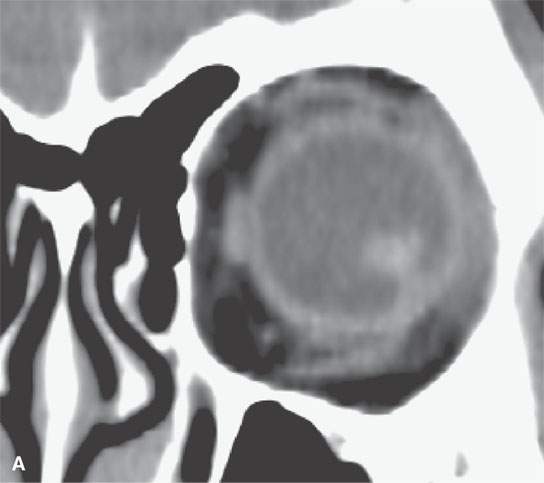
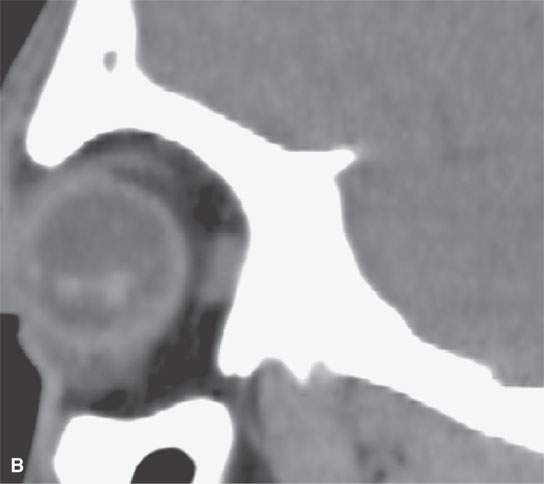
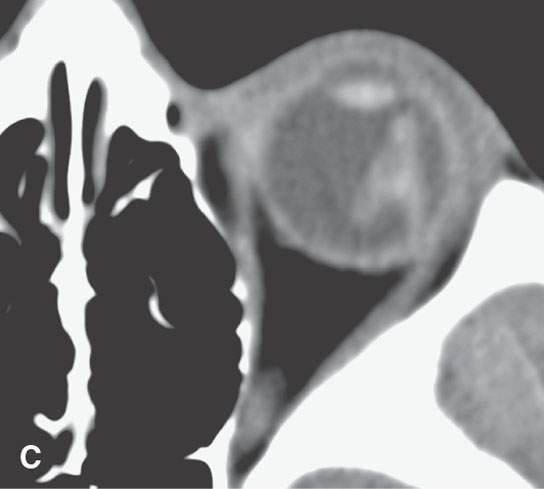
FIGURE 11.4. Non–contrast-enhanced computed tomography following penetrating trauma to the eye with what appears to be simply a vitreous hemorrhage on the coronal and sagittal and coronal images in (A) and (B). C: The highly geometric shape of the density suggests that this is a foreign body. It was a piece of wood (compare with Figure 11.3). Radiodense foreign bodies can mimic hemorrhage, especially in the eye. Recall that there are “few straight lines” or highly geometric appearing structures in the body that do not turn out to be foreign bodies.
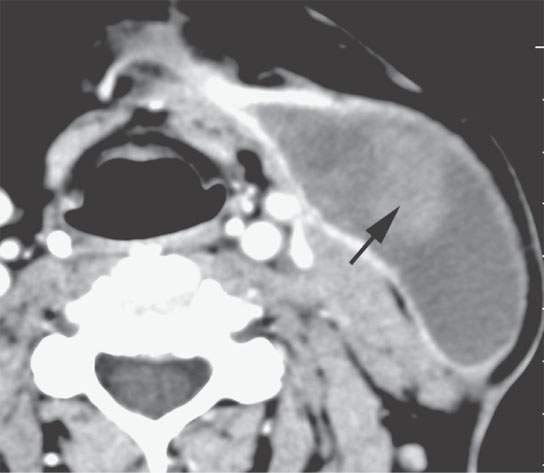
FIGURE 11.5. Contrast-enhanced computed tomography of a postoperative hematoma evolving to a seroma with organized clot is still visible (arrow) within what is otherwise a fluid collection consistent with a postoperative seroma.
Outside of the brain, this increased density is short-lived because clot lysis and resorption progress at a more rapid rate than within the brain and related intracranial spaces; thrombolytic substances have greater access to the clot in the absence of a blood–brain barrier and in a space with lesser contact with a vascular healing response (Fig. 11.2). An extracranial subacute hematoma often shows increased density relative to cerebrospinal fluid but really looks no different, based on its density, from any somewhat proteinaceous fluid collection.
On MR, the relative protein and water content and paramagnetic properties of degraded hemoglobin combine to produce often characteristic findings at the site of bleeding, especially in the brain.3 The appearance is linked to the rate of clot lysis with breakdown of the red cells and degradation of the hemoglobin molecule. These factors are further influenced by location and whether there have been repeated episodes of hemorrhage. Since the area of bleeding is usually sampled at one point in its evolution, a rigid approach that involves assigning specific time frames to certain MR findings may lead to confusion. It is essential to recognize that the findings are related to hemorrhage in order to construct an accurate diagnosis. The basic timetable that follows in the next paragraph is a useful outline for evaluating the approximate age of hemorrhage. The physical principles that explain the effect of blood on proton relaxation are discussed in conjunction with the basic physical principles of MR image formation (Chapters 1 and 3).
Acute or hyperacute hemorrhage, as seen within several hours to 24 hours, is basically a fluid collection. It will have low signal intensity on T1-weighted and high signal intensity on T2-weighted sequences (Fig. 11.6). However, hemorrhage is usually encountered in a subacute (24 to 72 hours) or early chronic phase (3 to 7 days to several weeks). The formation of clot results in a compacting of the cellular elements of blood that concentrates protein and accelerates relaxation on T1-weighted images. After 24 to 48 hours, blood will begin to brighten relative to brain or muscle on T1-weighted sequences and be isointense to brain and slightly hyperintense to muscle on T2-weighted images (Fig. 11.7). The brightness may be even more obvious on fat-suppressed images. Over several days to weeks, the T2-weighted images will show the clot becoming brighter on both T1- and T2-weighted images as red cells lyse and fluid content increases. At the same time, a zone of darkening may appear within the hematoma or at its periphery (Figs. 11.8–11.11). The changes at the periphery are related to hemosiderin deposition—a common pattern in the evolution of parenchymal brain hematomas (Fig. 11.8).4,5 The relative conspicuity of these findings is, to some extent, field strength dependent.
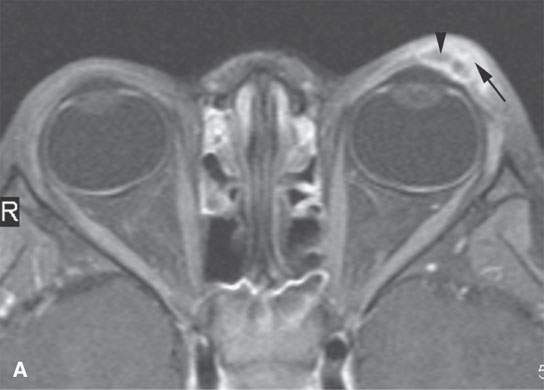
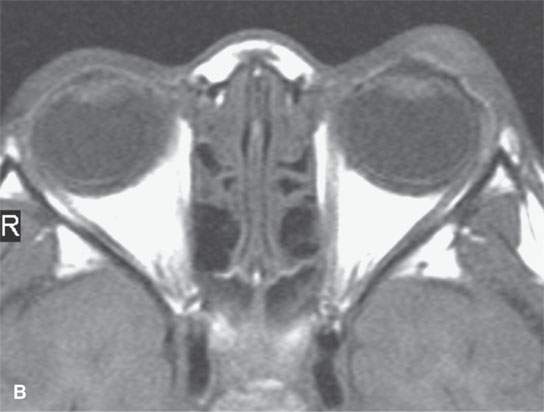
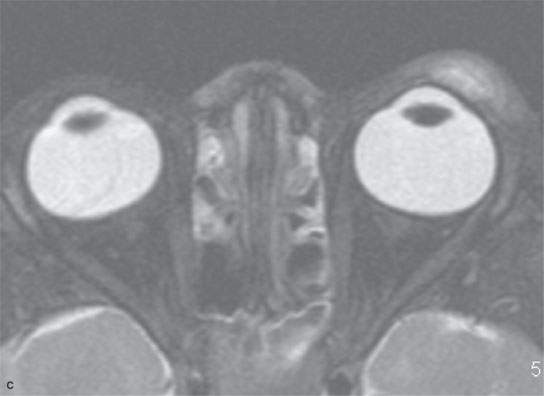
FIGURE 11.6. Acute hemorrhage into the left eyelid due to a vascular malformation. A: T1-weighted fat-suppressed contrast enhanced image shows the enhancing vascular malformation (arrow) and the nonenhancing (arrowhead)hematoma. B: The T1-weighted image without contrast cannot discern the bleed from the malformation. C: The T2-weighted image cannot discern the hemorrhage from the malformation.
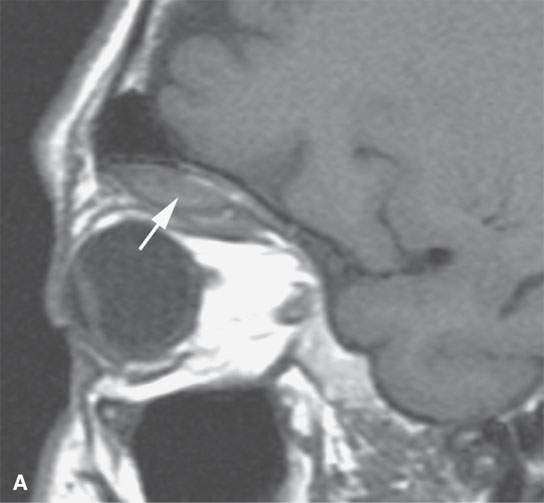
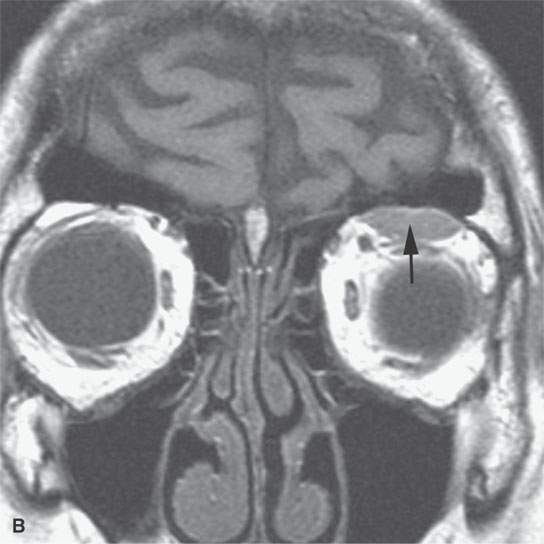
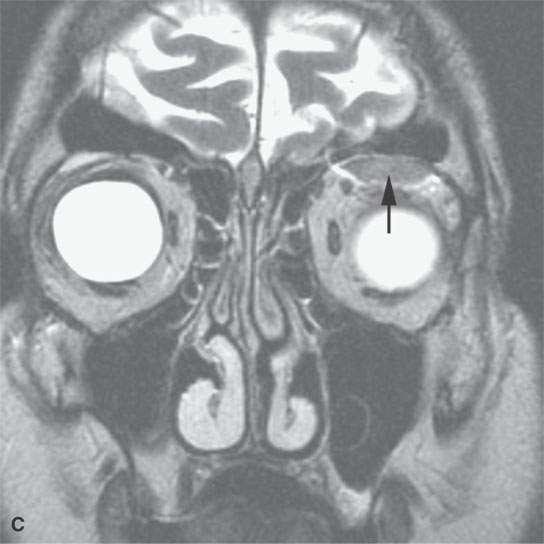
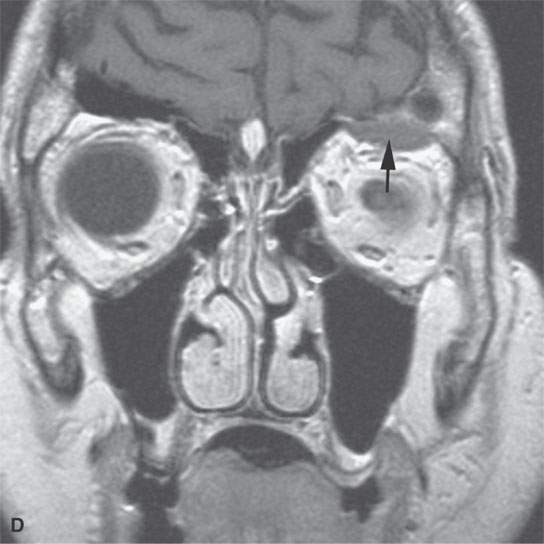
FIGURE 11.7. Magnetic resonance imaging of a patient with a subacute orbital subperiosteal hematoma induced by straining. A, B: T1-weighted non–contrast enhanced sagittal and coronal image shows the collection of blood (arrow) displacing the orbital periosteum and being isointense to brain. C: T2W image shows that the collection (arrow) is still relatively isointense to brain. D: There is no change on the T1-weighted contrast-enhanced image (arrow). The combination of findings is consistent with an organized, subacute clot not yet having undergone significant clot lysis or conversion of hemoglobin to methemoglobin.
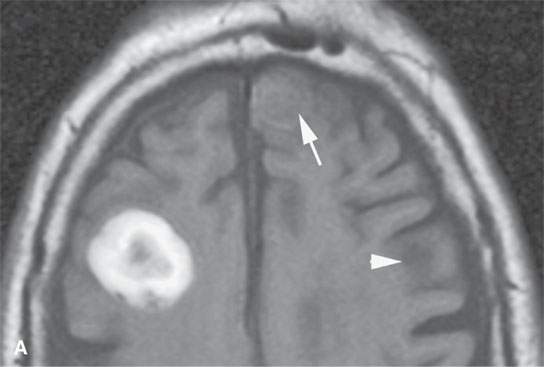
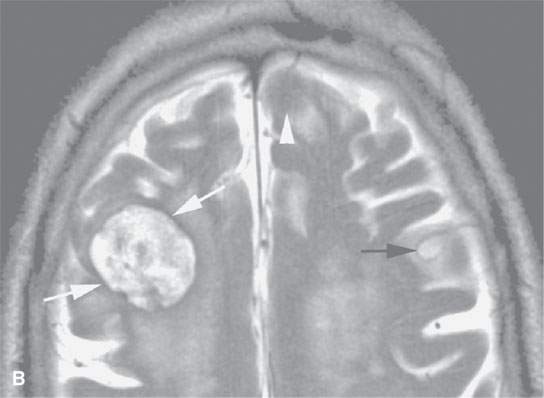
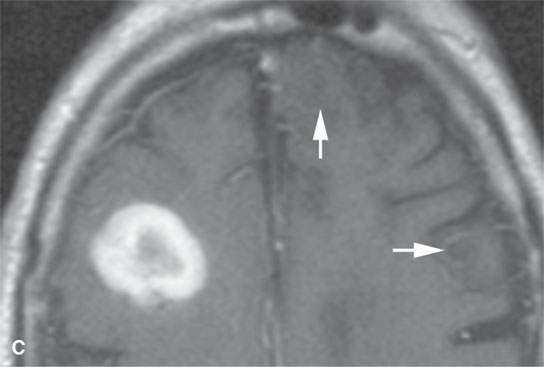
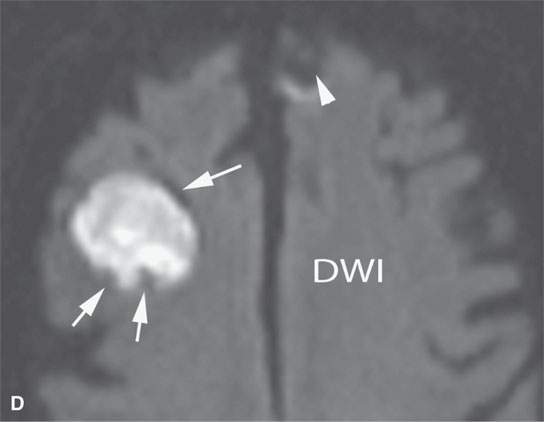
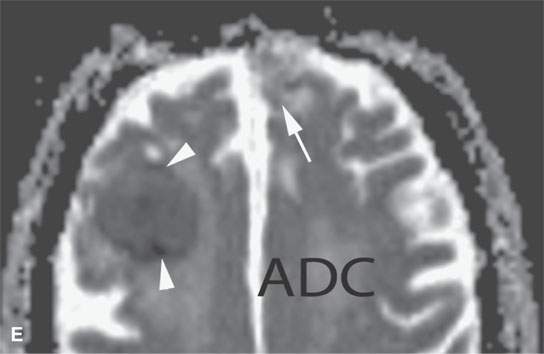
FIGURE 11.8. Magnetic resonance imaging of a patient with three melanoma metastases to the brain. A: T1-weighted non–contrast-enhanced image shows the hemorrhagic metastasis as bright due to methemoglobin-induced T1 shortening. Two not obviously hemorrhagic lesions are seen (arrow and arrowhead) with some T1 shortening possibly due to melanin effect. B: T2-weighted image shows a dark rim (white arrows) around the large lesion, likely due to hemosiderin deposition. One of the other lesions shows central T2 shortening (arrowhead) and the third (black arrow) peripheral T2 shortening possibly a melanin effect. C: T1-weighted contrast-enhanced image showing little significance in any of the metastases. D: Diffusion-weighted image suggests blood products at the periphery of the larger lesion (white arrows) and no restricted diffusion and possibly blood products (arrowhead) in another. E: Apparent diffusion coefficient (ADC) map image suggests blood products at the periphery of the larger lesion (white arrowheads) and no restriction and possibly blood products (arrow) in another. In the presence of paramagnetic effects, findings related to possible restricted diffusion are often ambiguous and unreliable, such as in this case, where the diffusion imaging suggests restricted diffusion in the larger lesion but the dominant effects are more likely paramagnetic, the findings are clearly ambiguous in the smaller lesion, and the third and smallest of the lesions could not be confidently identified.
Stay updated, free articles. Join our Telegram channel

Full access? Get Clinical Tree


