Fig. 9.1
Orbital hemangioma in a 4-month-old infant. (a) Color Doppler US shows a hypervascular solid mass in the right orbit. (b, c) Axial fat-saturated T1- and T2-weighted MR images show a soft tissue mass of homogeneous iso- and high signal intensities relative to the muscle on T1-weighted (b) and T2-weighted (c) images, respectively. Prominent high-flow vascular flow voids (arrow) are seen. (d) Axial contrast-enhanced T1-weighted fat-suppressed MR image shows intense homogeneous enhancement of the mass. Note proptosis and the compressed optic nerve (arrow)
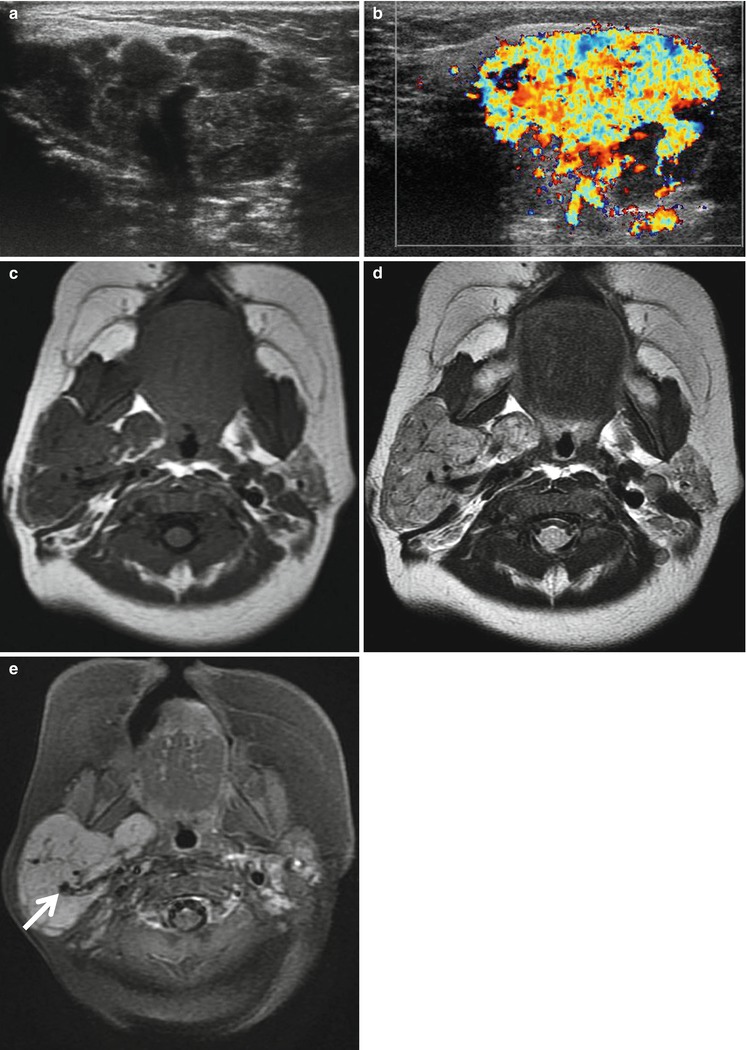
Fig. 9.2
Parotid hemangioma in a 4-month-old girl. (a, b) Gray and color Doppler US scans show a lobulating, heterogeneous solid mass with extensive hypervascularity in the right parotid gland. (c) Axial T1-weighted MR image shows a homogeneous iso-signal intensity of the mass relative to the muscle involving the entire right parotid gland. (d) Axial T2-weighted MR image shows a slightly high signal intensity of the mass with multiple flow voids (arrow). (e) Axial contrast-enhanced T1-weighted fat-suppressed MR image shows intense homogeneous enhancement of the mass occupying the entire right parotid gland. Prominent high-flow vascular flow voids (arrow) are seen
9.5.2 Teratoma
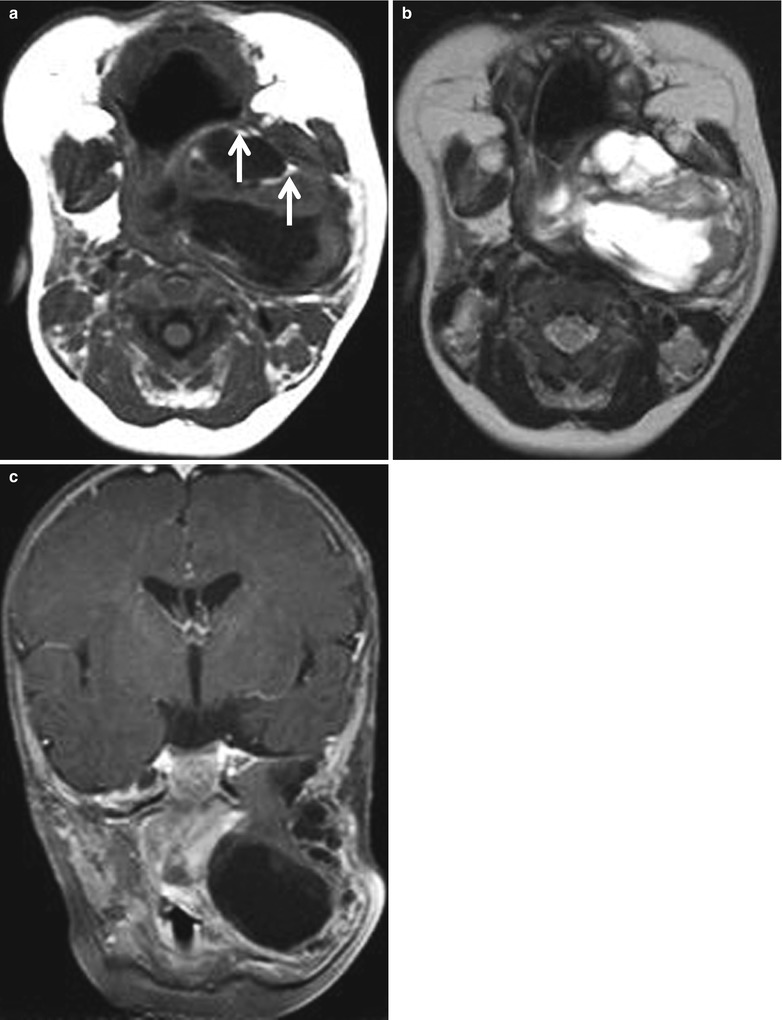
Fig. 9.3
Teratoma in a 3-month-old infant. (a) Axial T1-weighted MR image shows a large lobulating, complex mass in the left infratemporal fossa. The mass contains small foci of fatty tissues with high signal intensities (arrows). (b) Axial T2-weighted MR image shows peripheral solid and central cystic portions. (c) Contrast-enhanced T1-weighted fat-suppressed coronal MR image shows the mass extending superiorly to the middle cranial fossa, medially to the parapharyngeal space, inferiorly to the submandibular space, and laterally to the parotid space. Note the severe displacement of the upper airway
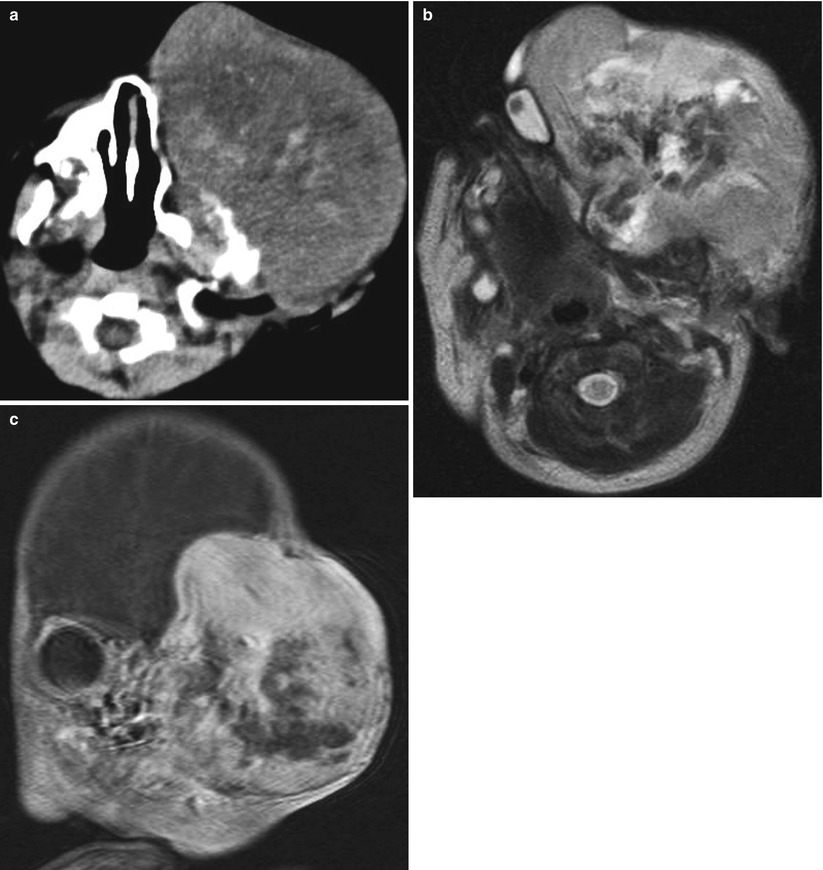
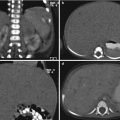
Fig. 9.4
Teratoma in a 2-day-old neonate. (a) Precontrast-enhanced CT scan shows heterogeneous attenuation of the mass with several calcific foci. Note destruction of the left frontal and temporal bones. (b) Axial T2-weighted MR image shows markedly heterogeneous high signal intensity mass involving the entire left face and neck. Note inferomedially displaced left orbit. (c) Contrast-enhanced T1-weighted fat-suppressed coronal MR image shows intracranial extension of the tumor with heterogeneous enhancement
9.5.3 Nasopharyngeal Angiofibroma
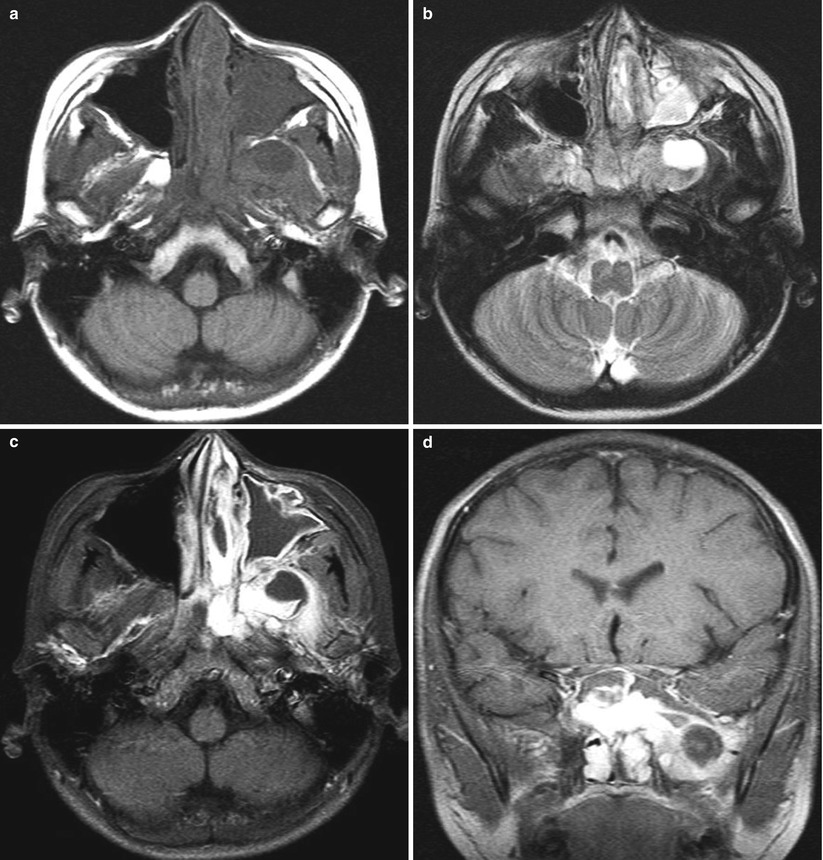
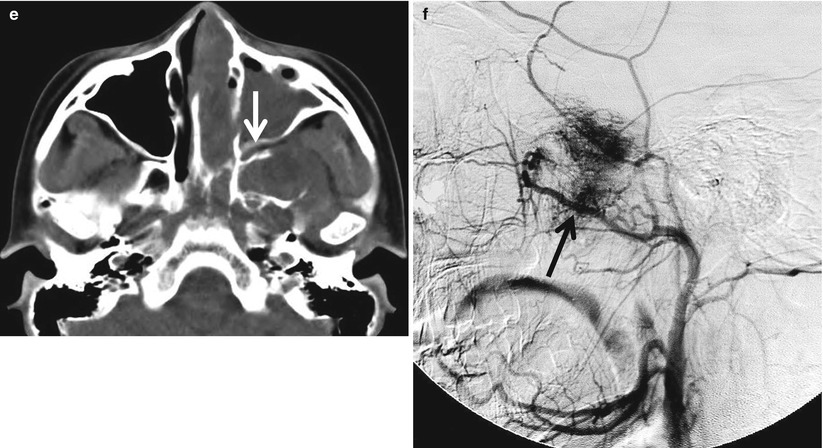
Fig. 9.5
Nasopharyngeal angiofibroma in a 10-year-old boy. (a) Axial T1-weighted MR image shows an ill-defined heterogeneous soft tissue mass of iso- to low signal intensity relative to muscle involving the left nasal cavity and nasopharynx. (b) Axial T2-weighted MR image shows heterogeneous iso- to high signal intensity of the mass with internal cystic portion. (c, d) Contrast-enhanced T1-weighted fat-suppressed axial and coronal MR images show a large, intensely enhancing tumor obstructing the left nasal cavity and nasopharynx and extending into the pterygopalatine fossa, infratemporal fossa, and sphenoid sinus. (e) CT scan clearly demonstrates widening of the left pterygopalatine fossa (arrow) and destruction of the left pterygoid and sphenoid bones. (f) Carotid angiography with selective injection of the left external carotid artery shows arterial supply from the internal maxillary artery branches (black arrow) with an intense tumor blush
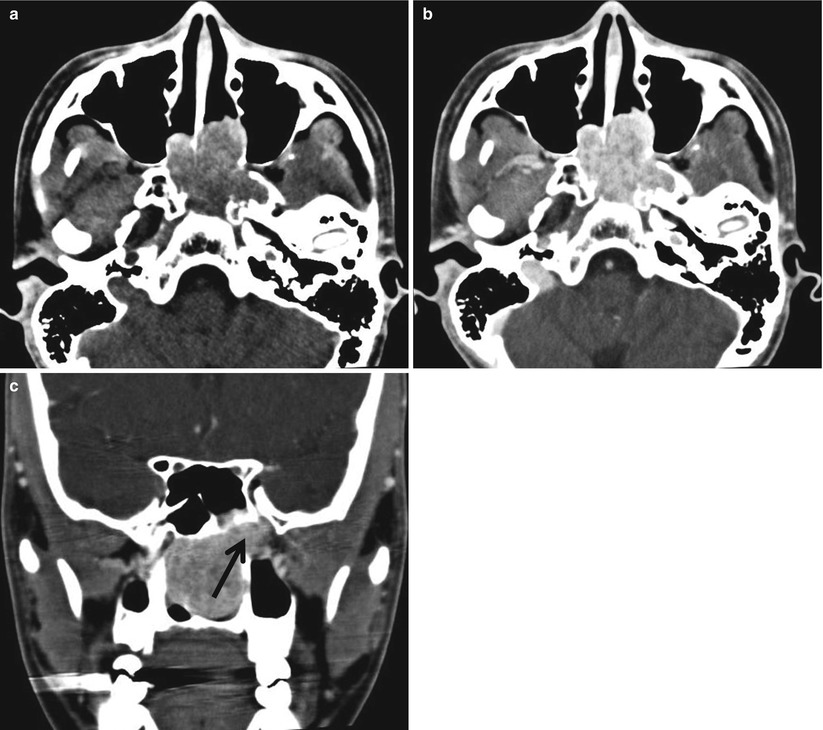
Fig. 9.6
Nasopharyngeal angiofibroma in an 18-year-old boy. (a) Nonenhanced axial CT scan shows iso- to high-attenuated soft tissue tumor obstructing the nasopharynx. (b, c) Contrast-enhanced axial and coronal reformatted CT scans show an avidly enhancing tumor obstructing the nasopharynx extending into the left pterygopalatine fossa (arrow) and sphenoid sinus. Note widening of the left pterygopalatine foramen (arrow)
9.5.4 Langerhans Cell Histiocytosis
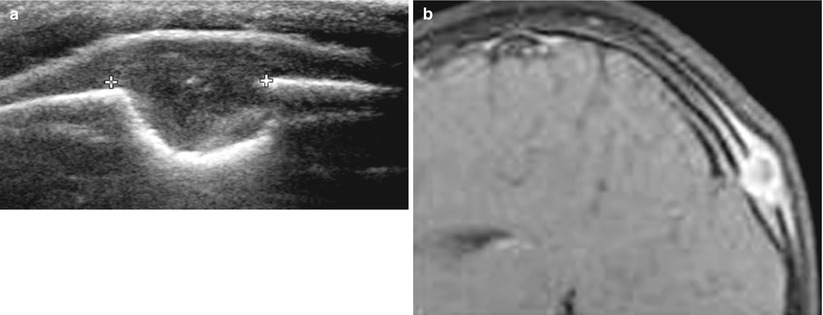
Fig. 9.7
LCH of the skull in a 2-year-old girl. (a) US shows an osteolytic lesion of a “beveled edge” with asymmetric destruction of the inner and outer tables of the skull. (b) Contrast-enhanced axial T1-weighted fat-suppressed MR image also shows a rim-enhancing osteolytic lesion with wider destruction of the outer table than the inner table of the calvarium
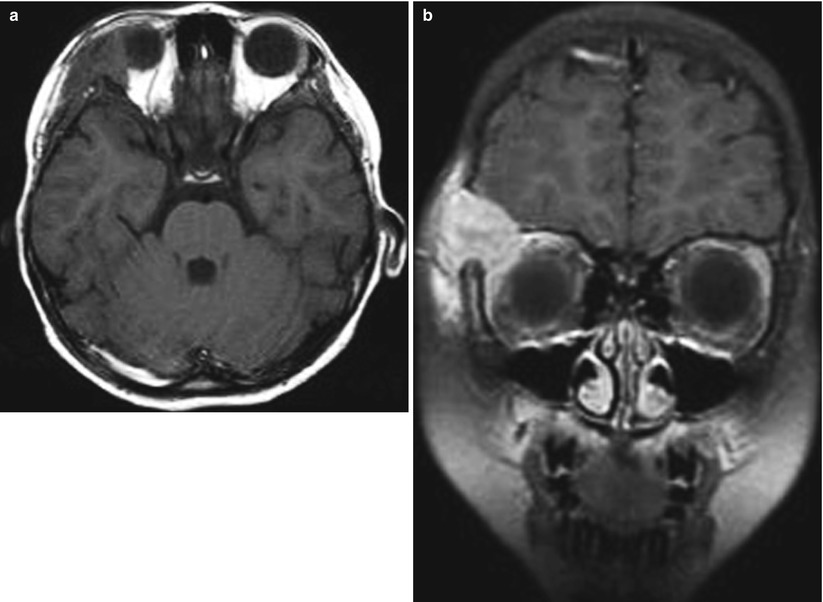
Fig. 9.8
Orbital LCH in an 8-year-old girl. (a) Axial T1-weighted MR image shows a soft tissue mass of iso-signal intensity relative to normal brain tissue in the superolateral aspect of the right orbit. (b) Contrast-enhanced coronal T1-weighted fat-suppressed MR image shows avid enhancement of the mass extending into the epidural space and soft tissue of the frontal scalp
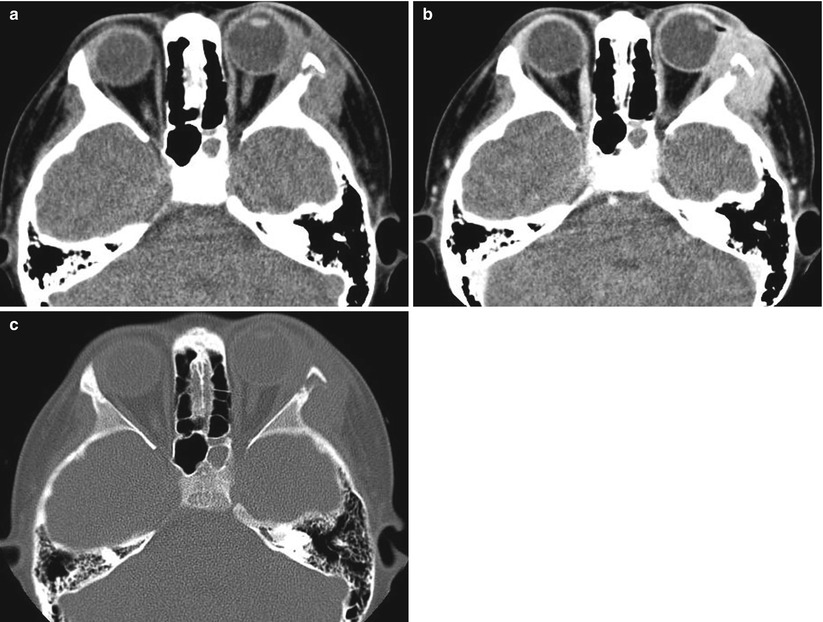
Fig. 9.9
Orbital LCH in a 7-year-old boy. (a) Nonenhanced CT shows an isoattenuated soft tissue mass in the superolateral wall of the left orbit. (b) Contrast-enhanced CT shows homogeneous enhancement of the mass. Note proptosis of the left orbit (c) CT scan with a bone window shows destruction of superolateral wall of the left orbit
9.5.5 Fibromatosis Colli
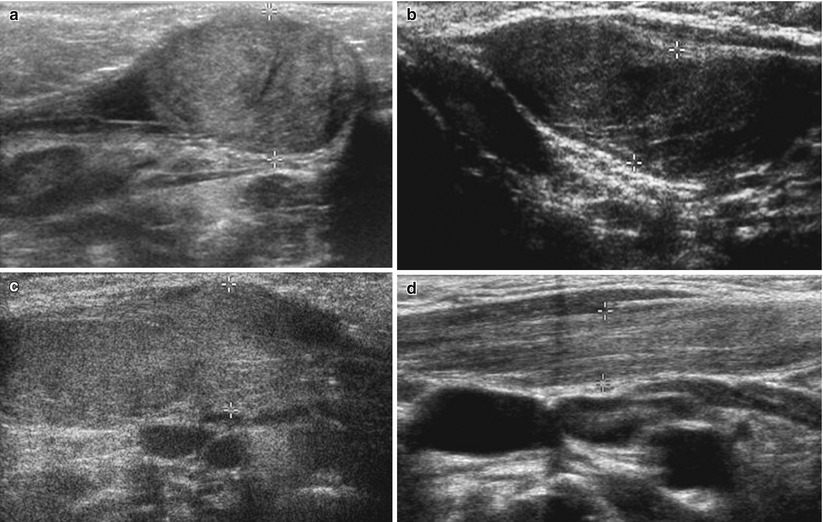
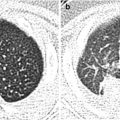
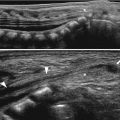
Fig. 9.10
Fibromatosis colli in infants. Various US findings of fibromatosis colli include a focal heterogeneous mass with a spindle shape (a), diffuse echogenic dot and lines against the hypoechoic background (b), diffuse hyperechogenicity along the entire muscle (c), and hyperechoic band in the muscle (d)
9.5.6 Lipoblastoma
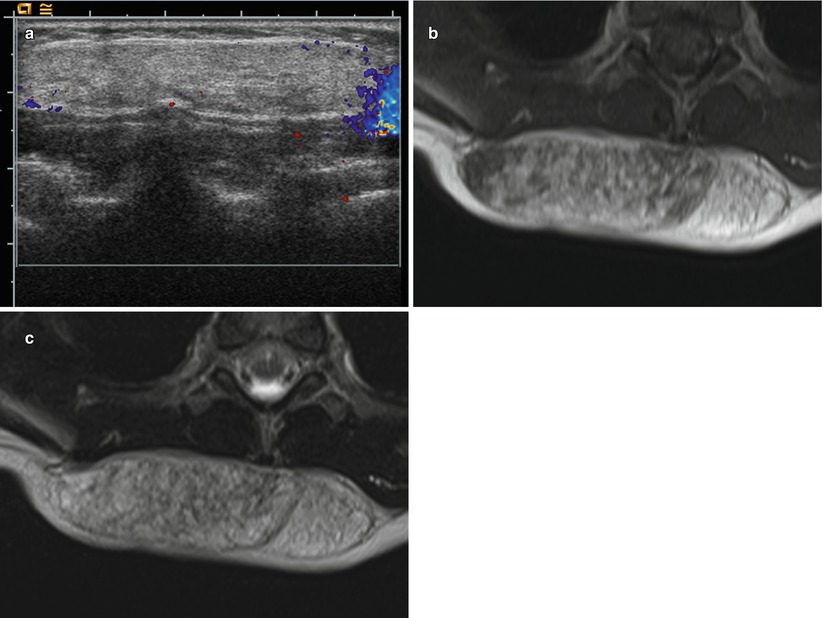
Fig. 9.11
Lipoblastoma in a 2-year-old girl. (a) Color Doppler US shows a hypovascular, echogenic solid mass in the right lower posterior neck extending to the back. (b) Axial T1-weighted image shows a well-defined mass of mixed high and iso signal intensities. (c) Axial T2-weighted image reveals the mass of iso signal intensity to the subcutaneous fat. Multiple tiny lesions of high signal intensity in the mass suggest myxoid stroma
9.5.7 Plexiform Neurofibromas
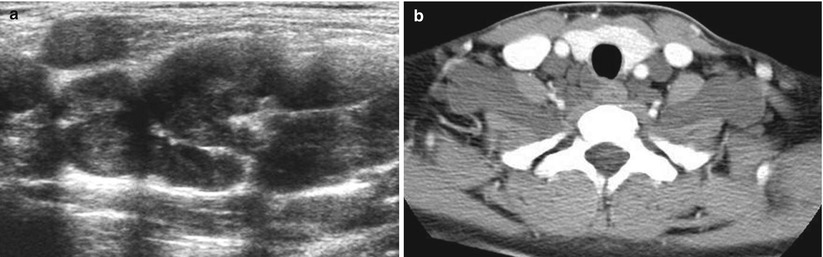
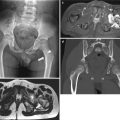
Fig. 9.12
Plexiform neurofibromatosis in an 18-year-old boy with type 1 neurofibromatosis. (a) US shows multiple nodules of neurofibromas with a “bag of worms” appearance. (b) Contrast-enhanced CT scan shows multiple, bilateral neurofibromas along the cervical nerve roots
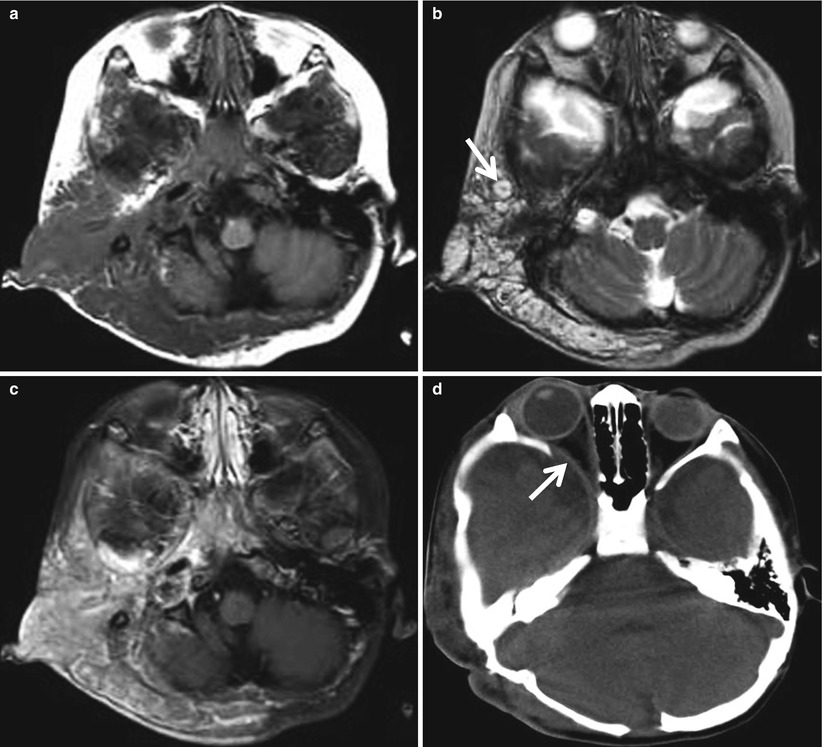
Fig. 9.13


Plexiform neurofibromatosis in a 3-year-old boy with type 1 neurofibromatosis. (a) Axial T1-weighted MR image shows an infiltrating plexiform neurofibromatosis of iso-signal intensity relative to the muscle. (b) Axial T2-weighted MR image shows heterogeneous high signal intensity of the masses with “target sign” (arrow) in some neurofibromas. (c) Contrast-enhanced T1-weighted fat-suppressed MR image shows the tumor that extends into the retropharyngeal space, infratemporal fossa, and right parotid gland with transspatial infiltration. (d) Axial CT scan with a bone window shows bony dysplasia of the right orbit with widening of the right superior orbital fissure and proptosis
Related posts:
Stay updated, free articles. Join our Telegram channel
Full access? Get Clinical Tree
