Chapter Outline
Imaging Anatomy, 377
Vascular Disease, 387
Trauma, 399
Neoplasm, 403
General, 403
Gliomas, 405
Meningeal and Mesenchymal Tumors, 408
Neuronal and Mixed Glial/Neuronal Tumors, 410
Nerve Sheath Tumors, 411
Pineal Region Tumors, 413
Tumor Like Lesions, 413
Hematopoietic Tumors, 414
Metastases, 415
Cystic Lesions, 416
Degenerative and White Matter Disease, 417
Hydrocephalus, 424
Infection, 426
General, 426
Bacterial Infections, 426
Fungal Infections, 428
Parasitic Infections, 428
Viral Infections, 429
Congenital Disease, 431
General, 431
Neural Tube Closure Defects, 432
Cerebral Hemisphere Defects, 433
Malformations of Cortical Development, 435
Posterior Fossa Malformations, 435
Phakomatoses, 436
Sellar and Juxtasellar Regions, 439
Spine, 441
Tumors, 446
Approach, 446
Differential Diagnosis, 448
Tumors, 448
Abnormal Enhancement, 452
Basal Ganglia Signal Abnormalities, 453
Neurodegenerative Diseases, 454
Congenital Abnormalities, 454
Spine, 455
Imaging Anatomy
Parenchymal Anatomy
Lobar Anatomy ( Fig. 6.1 )
- •
Frontal lobe: anterior to central sulcus (CS) (Rolando)
- •
Parietal lobe: posterior to CS
- •
Temporal lobe: inferior to lateral sulcus (Sylvius)
- •
Occipital lobe: posterior
- •
Limbic lobe
- •
Central (insular lobe)

Basal Ganglia ( Fig. 6.2 )
- •
Lentiform nucleus: putamen + globus pallidus
- •
Striatum: putamen + caudate nucleus
- •
Claustrum
- •
Caudate nucleus consists of:
Head (anterior)
Body
Tail (inferior)
- •
Subthalamic nucleus

Thalamus ( Fig. 6.3 )
Contains over 25 separate nuclei and serves as a synaptic relay station. Organization:
Thalamus
- •
Lateral nuclei
- •
Medial nuclei
- •
Anterior nuclei
- •
Subthalamus
- •
Subthalamic nucleus
- •
Substantia nigra
- •
Hypothalamus

Central Sulcus ( Fig. 6.4 )
- 1.
Superior frontal sulcus/pre-CS sign (85% specific)
- •
The posterior end of the superior frontal sulcus joins the pre-CS.
- •
- 2.
Sigmoidal hook sign (89%–98%)
- •
Hook like configuration of the CS corresponding to the motor hand area
- •
- 3.
Pars bracket sign (96%)
- •
Paired pars marginalis at or behind the CS
- •
- 4.
Bifid post-CS sign (85%)
- 5.
Thin postcentral gyrus sign (98%)
- 6.
Intraparietal sulcus intersects the post-CS (99%)
- 7.
Midline sulcus sign (70%)
- •
Most prominent convexity sulcus that reaches the midline is the CS.
- •

Inferior Frontal Gyrus Anatomy ( Fig. 6.5 )
The inferior frontal lobe contains three subsections (forming an “M”):
- •
Pars orbitalis (1)
- •
Pars triangularis (2)
- •
Pars opercularis (3)
- •
Pars triangularis and pars opercularis together form Broca area
- •
Wernicke area (4)—superior posterior temporal lobe

Brain Myelination ( Fig. 6.6 )
Neonatal and pediatric brains have different computed tomography (CT) and magnetic resonance imaging (MRI) appearances because of:
- •
Increased water content (changes best seen with T2-weighted [T2W] sequences)
- •
Decreased myelination (changes best seen with T1-weighted [T1W] sequences)
- •
Low iron (Fe) deposits

Brain maturation begins in the brainstem and progresses to the cerebellum and then to the cerebrum.
Characteristic MRI Appearance
Premature
- •
Smooth cortical surface, lacking cortical folding
- •
Gray-white matter (GWM) signal intensity reversal on T1W
- •
Cortex is hyperintense.
Basal ganglia are hyperintense.
Neonate: myelination of different structures depends on age.
Myelination progresses from inferior to superior, central to peripheral, and posterior to anterior.
T1 hyperintensity precedes T2 hypointensity in myelinated white matter (WM).
Terminal zones of myelination: Symmetric T2 hyperintensity in the periatrial WM representing incompletely myelinated parietooccipital association fibers; a normal finding that can persist into the second and third decades of life
| Region | T1 hyperintense | T2 hypointense |
|---|---|---|
| Posterior limb internal capsule Cerebellum | Birth 3 months | 3 months |
| Anterior limb internal capsule | 3 months | 6 months |
| Corpus callosum | 5 months | 7 months |
| Frontal white matter | 14 months | |
| Adult pattern | 18 months |
Ventricular System
Anatomy ( Fig. 6.7 )
Left and right lateral ventricles connect to third ventricle via a single Y-shaped interventricular foramen (Monro). Anatomic aspects:
- •
Frontal horn
- •
Temporal (inferior) horn
- •
Occipital (posterior) horn
- •
Body
- •
Atrium

Third ventricle connects to fourth ventricle via cerebral aqueduct of Sylvius. Anatomic aspects:
- •
Optic recess
- •
Infundibular recess
- •
Pineal recess
- •
Suprapineal recess
- •
Interthalamic adhesion (massa intermedia)
Fourth ventricle connects:
- •
Laterally to cerebrospinal fluid (CSF) via foramen of Luschka
- •
Posteriorly to CSF via foramen of Magendie
- •
Inferiorly to form obex before becoming central canal of spinal cord
Cavum Variants
Cavum Septum Pellucidum
- •
Separates frontal horns of lateral ventricles (anterior to foramen of Monro)
- •
80% of term nenonates; 15% of adults
- •
May dilate; rare cause of obstructive hydrocephalus
Cavum Vergae
- •
Posterior continuation of cavum septum pellucidum; never exists without cavum septum pellucidum.
Cavum Velum Interpositum
- •
Extension of quadrigeminal plate cistern to foramen of Monro
Pineal Region Anatomy ( Fig. 6.8 )
Location
- •
Posterior to third ventricle
- •
Adjacent to thalamus
- •
Normal pineal calcification
- •
10% are calcified at 10 years of age.
- •
50% are calcified at 20 years of age.
- •
Calcification should be approximately the size of the normal pineal gland.
- •
Normal size of pineal calcification is <1 cm.
- •

Sella Turcica
Pituitary Gland ( Fig. 6.9 A–B )
| Lobe | Origin | Hormones | MRI Features |
|---|---|---|---|
| Anterior (adenohypophysis) | Rathke pouch a | PRL, ACTH, others | Intermediate signal |
| Intermediate | Rathke pouch | Intermediate signal | |
| Posterior (neurohypophysis) | Floor of third ventricle | Oxytocin, vasopressin | Usually T1W hyperintense |
Normal height measurements (coronal MRI)
- •
3–8 mm in adults
- •
Up to 10 mm during puberty; may be >10 mm during pregnancy
- •
Stalk
- •
2–5 mm in diameter
- •
Connects to hypothalamus
- •
Passes behind optic chiasm
- •
Enhances with contrast
- •
Strong contrast enhancement of normal gland (no blood-brain barrier [BBB])


Suprasellar Cistern
Located above the diaphragma sella. Shape on axial sections:
- •
5-pointed star shape (pontine level)
- •
6-pointed star shape (midbrain level)
- •
Contents of cistern:
- •
Circle of Willis
- •
Optic chiasm, optic tracts
- •
Cranial nerves (CN) (III, IV, V)
- •
Pituitary stalk
- •
Cistern may herniate into sella: empty sella syndrome (usually asymptomatic with no consequence).
Cavernous Sinus ( Fig. 6.10 )
Dura-enclosed venous channel containing:
- •
Internal carotid artery (ICA) and sympathetic plexus
- •
CNs: III, IV, V1, V2, VI
- •
Connections of sinus:
- •
Ophthalmic veins
- •
Retinal veins
- •
Middle meningeal veins
- •
Pterygoid vein
- •
Petrosal sinuses
- •
Sphenoparietal sinus
- •

Meckel Cave (Trigeminal Cave)
Abuts the most posterior portion of the cavernous sinus (separate from cavernous sinus). Contains:
- •
Trigeminal nerve roots
- •
Trigeminal ganglion (gasserian ganglion)
- •
CSF
Vascular System
External Carotid Artery (ECA) ( Fig. 6.11 )
Eight main branches. Mnemonic: SALFOPSM :
- •
S uperior thyroid artery
- •
A scending pharyngeal artery
- •
L ingual artery
- •
F acial artery
- •
O ccipital artery
- •
P osterior auricular artery
- •
S uperficial temporal artery
- •
M axillary artery
- •
Middle meningeal artery through foramen spinosum
- •
Accessory middle meningeal artery through foramen ovale
- •
Descending palatine artery (greater palatine)
- •
Facial, sinus, and nasoorbital branches
- •
Sphenopalatine, infraorbital, posterior superior alveolar, artery of the vidian canal
ICA
- •
Inferolateral trunk (ILT)
- •
Meningohypophyseal trunk
- •
Ophthalmic branches
- •
ECA
- •
Middle meningeal artery
- •
Accessory meningeal artery
- •
Sphenopalatine artery
- •
Branches of ascending pharyngeal artery
- •
Branches of occipital artery
- •
Vertebral artery (VA)
- •
Posterior meningeal artery
- •

Internal Carotid Artery ( Fig. 6.12 )
Four segments:
Cervical segment
- •
Usually no branches
- •
Petrous segment
- •
Branches are rarely seen on angiograms.
- •
Caroticotympanic artery
- •
Vidian artery (inconstant)
- •
Cavernous segment
- •
Meningohypophyseal trunk
- •
ILT
- •
Supraclinoid segment (cavernous and supraclinoid segments = carotid siphon). Mnemonic: SOPA :
- •
S uperior hypophyseal artery (not routinely visualized)
- •
O phthalmic artery
- •
P osterior communicating artery (PCOM)
- •
A nterior choroidal artery

Vertebrobasilar System ( Fig. 6.13 )
The VAs are the first branches of the subclavian arteries (95%). The left vertebral artery (LVA) arises directly from the aortic arch (AA) (between left subclavian and common carotid) in 5%. The left artery is dominant in 50%; in 25% the VAs are codominant; in 25% the right artery is dominant. VAs usually course through the C6–C1 vertebral foramina (but may start at C4) and then the foramen magnum.

Segments and Branches of VAs ( Fig. 6.14 )
Cervical segment (extradural)
- •
Muscular branches
- •
Spinal branches
- •
Posterior meningeal artery
- •
Intracranial segment (intradural)
- •
Anterior spinal artery (ASA)
- •
Posterior inferior cerebellar artery (PICA)
- •
Basilar artery
- •
Anterior inferior cerebellar artery (AICA)
- •
Superior cerebellar artery (SCA)
- •
Brainstem perforating arteries
- •
Posterior cerebral artery (PCA)
- •

Circle of Willis ( Fig. 6.15 )
The circle is complete in 25% and incomplete in 75%.

It consists of:
- •
Supraclinoid ICAs
- •
A1 segment of anterior cerebral arteries
- •
Anterior communicating arteries (ACOMs)
- •
PCOMs
- •
P1 segment of PCAs
Cerebral Arteries
Anterior Cerebral Artery (ACA) ( Fig. 6.16 )
Represents one of the two ICA terminal branches
- •
A1 segment:
Origin to ACOM
Medial lenticulostriates
- •
A2 segment:
From ACOM
Recurrent artery of Heubner
Frontal branches
- •
Terminal bifurcation
Pericallosal artery
Callosomarginal artery


Middle Cerebral Artery (MCA) (see Fig. 6.16 )
Represents the larger of the two terminal ICA branches
- •
M1 segment:
Origin to MCA bifurcation
Lateral lenticulostriates
- •
M2 segment:
Insular branches
- •
M3 segment:
Opercular branches
- •
M4 segment:
Cortical branches
Posterior Cerebral Artery (PCA)
- •
P1 segment:
Origin to PCOM
Posterior thalamoperforators
- •
P2 segment:
Distal to the PCOM
Thalamogeniculates
Posterior choroidal arteries
- •
Terminal cortical branches
Normal Variants of Vascular Anatomy
Internal Carotid Artery (ICA) ( Fig. 6.17 )
Mnemonic: HOT Pepper :
- •
H ypoglossal artery: ICA (C1–C2) to basilar artery via hypoglossal canal
- •
O tic artery: petrous ICA to replace middle meningeal artery via middle ear (foramen spinosum may be absent)
- •
T rigeminal artery: cavernous ICA to basilar artery (most common), Neptune’s trident sign on angiography
- •
P roatlantal intersegmental artery: cervical ICA to vertebrobasilar system

External Carotid Artery (ECA)
- •
Middle meningeal artery arises from ophthalmic artery
- •
Variation in order of branching
Circle of Willis
- •
Hypoplasia of PCOM
- •
Hypoplasia or absence of A1 segment
- •
Fetal PCA (originates from ICA) with atretic P1
- •
Hypoplastic ACOM
- •
Infundibulum of PCOM: take-off of PCOM from ICA is from apex of a triangular- or funnel-shaped origin measuring <3 mm; do not mistake for aneurysm
Anastomoses Between Arteries
Between ICA and ECA via:
- •
Maxillary artery branches to ophthalmic artery
- •
Facial artery to ophthalmic artery
- •
Dural collaterals (occipital, ascending pharyngeal, middle meningeal)
- •
ECA → contralateral ECA → ICA
- •
Between ECA and cerebral arteries
- •
ECA → middle meningeal artery → transdural → pial branches → ACA, MCA
- •
ECA → meningeal branches → vertebrobasilar artery
- •
Between cerebral arteries
- •
Left ICA → ACOM → right ICA (circle of Willis)
- •
ICA → PCOM → basilar (circle of Willis)
- •
ICA → anterior choroidal → posterior choroidal → basilar
- •
Leptomeningeal anastomoses: ACA → MCA → PCA → ACA
- •
Between ICA and posterior fossa (primitive embryonic connections; mnemonic: HOT Pepper ; see earlier)
Meninges and Venous Sinuses ( Fig. 6.18 )
Meningeal Spaces
- •
Epidural space: potential space between dura mater (two layers) and bone
- •
Subdural space: space between dura and arachnoid
- •
Subarachnoid space: space between arachnoid and pia mater

Sinuses ( Fig. 6.19 )
- •
Superior sagittal sinus: in root of falx
- •
Inferior sagittal sinus: in free edge of falx
- •
Straight sinus
- •
Great vein of Galen: drains into straight sinus
- •
Occipital sinus
- •
Confluence of sinuses (torcular Herophili)
- •
Left and right transverse sinus: drain from confluence
- •
Sigmoid sinus: drains into internal jugular vein (IJV)
- •
Superior petrosal sinus: enters into transverse sinus
- •
Inferior petrosal sinus

Vascular Territories ( Fig. 6.20 )
ACA
- •
Hemispheric
- •
Callosal
- •
Medial lenticulostriate (Heubner)
Caudate head
Anterior limb of internal capsule
Septum pellucidum
- •
MCA
- •
Hemispheric
- •
Lateral lenticulostriate
Lentiform nucleus
Caudate nucleus
Internal capsule
- •
PCA
- •
Hemispheric
- •
Callosal
- •
Thalamic and midbrain perforators
- •
Mesial inferior temporal lobe, occipital lobe
- •
SCA
- •
Superior cerebellum
- •
AICA
- •
Inferolateral pons
- •
Middle cerebellar peduncle
- •
Anterior cerebellum
- •
PICA
- •
Medulla
- •
Posterior and inferior cerebellum
- •

Ultrasound (US) of Carotid Arteries
B-Mode Imaging ( Fig. 6.21 )
Delineate common carotid artery (CCA), ECA, ICA, bulb
Vessel wall thickness
- •
>1.0 mm is abnormal.
- •
All focal plaques are abnormal.
- •
Plaque characterization
- •
Determine extent and location
- •
Plaque texture
Homogeneous (dense fibrous connective tissue)
Heterogeneous (intraplaque hemorrhage: echogenic center; unstable)
Calcified (stable)
- •
Plaque surface
Irregular surface may represent ulceration
- •
Evaluation of stenosis
- •
Measure visible stenosis in transverse and longitudinal planes. Use Doppler measurements for degree of stenosis
- •
Focal versus segmental stenosis
- •

Doppler Imaging (Flow) ( Fig. 6.22 )
Doppler imaging displays velocity profile. Analysis of spectra:
- 1.
Analysis of waveform
Components of curve
- •
Peak diastolic flow
- •
Peak systolic flow
- •
Peak broadness
- •
Flow direction
- •
Shape of curves
- •
High-resistance vessels (e.g., ECA)
- •
Low-resistance vessels (e.g., ICA)
- •
Intermediate-resistance vessels (e.g., CCA)
- •
US DIFFERENTIATION BETWEEN ICA AND ECA
ECA , External carotid artery; ICA , internal carotid artery.
- 2.
Spectral broadening ( Fig. 6.23 )
When normal laminar blood flow is disturbed (by plaques and/or stenoses), blood has a wider range of velocities = spectral broadening.
Two ways to detect spectral broadening:
- •
The spectral window is obliterated.
- •
Automated determination of bandwidth = spread of maximum and minimum velocities
- •

FIG. 6.23
- 3.
Peak velocities ( Fig. 6.24 )
Flow velocities increase proportionally with the degree of a stenosis: flow of >250 cm/s indicates a >70% stenosis.
Carotid stent:
50%–79% stenosis: >220 cm/s and ICA/CCA ratio ≥2.7
80%–99% stenosis: >340 cm/s and ICA/CCA ratio ≥4.15

FIG. 6.24


Color Doppler US
Color Doppler imaging (CDI) displays real-time velocity information in stationary soft tissues. The color assignment is arbitrary but conventionally displayed in the following manner:
- •
Red: toward transducer
- •
Blue: away from transducer
- •
Green: high-velocity flow
- •
Color saturation indicates speed.
Deep shades: slow flow
Light shades: fast flow
Pearls
- •
Perform CDI only with optimal gain and flow sensitivity settings.
Ideally the vessel lumen should be filled with color.
Color should not spill over to stationary tissues.
- •
Frame rates vary as a function of the area selected for CDI: the larger the area, the slower the frame rate.
- •
Laminar flow is disrupted at bifurcations.
- •
Do not equate color saturation with velocity: green-tagged flow in a vessel may represent abnormally high flow or simply a region in the vessel where flow is directed at a more acute angle relative to the transducer.
- •
When color flow is not present in the expected vessel, increase pulse Doppler frequency, decrease filters, and apply Doppler imaging within the vessel to detect blood flow in slow flow states such as pseudoocclusion or no flow in an occluded vessel.
- •
The angle of insonation should be within 0–60 degrees.
Transcranial Doppler (TCD)
TCD measures the velocity of blood flow through the intracranial arteries. Commonly performed using the following windows:
Transtemporal—circle of Willis
Transorbital—carotid siphon and ophthalmic artery
Suboccipital or transforaminal—vertebral and basilar arteries
Indications
Vasospasm (especially related to subarachnoid hemorrhage [SAH])
Stenosis/occlusion
Vasomotor reserve
Brain death
Monitoring of blood flow during surgery
Identification of feeder arteries in arteriovenous malformations (AVM)s
| Stenosis | Velocity (cm/s) | |
|---|---|---|
| Anterior | Vertebral and Basilar | |
| Mild | 120–160 | 100–150 |
| Moderate | 160–200 | 150–180 |
| Severe | >200 | >180 |
Spine
Spinal Canal ( Fig. 6.25 )
Vertebral elements:
- •
Body
- •
Posterior elements
Neural ring
- •
Posterior margin of vertebral body
- •
Pedicles
- •
Laminae
Articular facets
Transverse process
- •
Recesses
- •
Subarticular recess
- •
Lateral recess
- •
Disks
- •
Components:
Nucleus pulposus (notochordal origin)
Annulus fibrosus with peripheral Sharpey fibers
- •
CT density (60–120 Hounsfield unit [HU])
Disk periphery is slightly denser than its center (Sharpey fibers calcify).
Disk is much denser than thecal sac (0–30 HU).
- •
MRI signal intensity
T1W: hypointense relative to marrow
Proton density weighted (PDW), T2W: hyperintense relative to marrow with hypointense intranuclear cleft
- •
Ligaments
- •
Ligamentum flavum: attaches to lamina and facets
- •
Posterior longitudinal ligament: rarely seen by MRI except in herniations
- •
Thecal sac
- •
Lined by dura and surrounded by epidural fat
- •
Normal anteroposterior (AP) diameter of thecal sac
Cervical >7 mm
Lumbar >10 mm
- •
MRI frequently shows CSF flow artifacts in thecal sac.
- •

Neural Structures
Spinal cord
- •
AP diameter 7 mm
- •
Conus medullaris: 8 mm (tip at L1–L2)
- •
Filum terminale extends from L1–S1.
- •
Nerve roots ( Fig. 6.26 )
- •
Ventral root, dorsal root, dorsal root ganglion
- •
The dorsal and ventral nerve roots join in the spinal canal to form the spinal nerve. The nerve splits into ventral and dorsal rami a short distance after exiting the neural foramen.
Below T1: spinal nerve courses under the pedicle for which it is named (e.g., L4 goes under L4 pedicle).
Above T1: spinal nerve courses above the pedicle for which it is named.
- •
Nerve roots lie in the superior portion of the intervertebral neural foramen.

FIG. 6.26
- •
Vascular Disease
Intracranial Hemorrhage ( Fig. 6.27 )
CT Appearance of Intracranial Hemorrhage
Acute hemorrhage (<3 days)
- •
Hyperdense (80–100 HU) relative to brain (40–50 HU)
- •
High density caused by protein-hemoglobin (Hb) component (clot retraction)
- •
Acute hemorrhage is not hyperdense if the hematocrit is low (Hb <8 g/dL).
- •
Subacute hemorrhage (3–14 days)
- •
Hyperintense, isointense, or hypointense relative to brain
- •
Degradation of protein-Hb product evolves from peripheral to central
- •
Peripheral enhancement may be present.
- •
Chronic hemorrhage (>2 weeks)
- •
Hypodense
- •
Active extravasation of contrast
- •
Swirl sign (noncontrast CT): actively extravasating hypodense unclotted blood mixes with hyperdense clotted blood
- •
Spot sign (computed tomographic angiography [CTA], angiography): enhancing focus in acute hematoma on delayed phase CTA is associated with hematoma expansion; predictive of poor patient outcome. Size and density criteria: at least 1.5 mm and HUs at least double that of background hematoma.
- •
Distinguishing hemorrhage from IV contrast and calcium
- •
Dual-energy CT (DECT) uses high- and low-peak voltage acquisitions (e.g., 80 vs. 140 kVp) to analyze the energy-dependent photon attenuation of different elements and allow for material decomposition. Creates virtual iodine/noniodine and calcium/noncalcium images to distinguish blood products from iodine and calcium.
- •
Can be applied to differentiate iodine and hemorrhage in hyperdense lesions after administration of intravenous (IV) contrast and after intraarterial (IA) therapy in stroke patients
- •
Can also be used to distinguish calcium and hemorrhage in hyperdense lesions such as cavernous malformations or hemorrhagic tumors

MRI Appearance of Intracranial Hemorrhage ( Fig. 6.28 )
Different Fe-containing substances have different magnetic effects (diamagnetic, paramagnetic, superparamagnetic) on surrounding brain tissue. In the circulating form, Hb alternates between oxy-Hb and deoxy-Hb as O 2 is exchanged. To bind O 2 , the Fe must be in the reduced Fe(II) (ferrous) state. When Hb is removed from the circulation, the metabolic pathways fail to reduce Fe and Hb begins denaturation. The appearance of blood depends on the magnetic properties of blood products and compartmentalization.

Mnemonic: I Be ID BD BaBy Doo Doo :
- •
I = Isointense
- •
B = Bright
- •
D = Dark
Note: Gradient-echo (“susceptibility”) imaging exaggerates the T2W appearance of blood, and thus follows the same pattern as T2W (i.e., hypointense for acute, early subacute, and chronic hemorrhages). Susceptibility-weighted imaging (SWI) enhances contrast based on differences in magnetic susceptibility in tissues. Combines magnitude and phase information in gradient-echo image to distinguish paramagnetic substances (e.g., Fe) from diamagnetic substances (e.g., calcium), which generate phase shifts of opposing sign in MRI data. On phase images, paramagnetic substances (i.e., hemorrhage, deoxyhemoglobin in veins) will appear dark, and diamagnetic substances (i.e., calcium) will appear bright.


Hypertensive Hemorrhage
Occurs most commonly in areas of penetrating arteries that come off the MCA and/or basilar artery. Depending on size and location of hemorrhage, the mortality rate is high. Poor prognostic factors:
- •
Large size
- •
Brainstem location
- •
Intraventricular extension
Location
- •
Basal ganglia (putamen > thalamus), 80%
- •
Pons, 10%
- •
Deep GM, 5%
- •
Cerebellum, 5%
Imaging Features
- •
Typical location of hemorrhage (basal ganglia) in hypertensive patient
- •
Mass effect from hemorrhage and edema may cause herniation of brain.
- •
If the patient survives, the hemorrhage heals and leaves a residual cavity that is best demonstrated by MRI.
Tumor Hemorrhage
Tumor-related intracranial hemorrhage may be due to coagulopathy (leukemia, anticoagulation) or spontaneous bleeding into a tumor. Most clinicians cite that the incidence of hemorrhage into tumors is 5%–10%. Tumors that commonly hemorrhage include:
- •
Pituitary adenoma
- •
Glioblastoma multiforme, anaplastic astrocytoma
- •
Oligodendroglioma
- •
Ependymoma
- •
Primitive neuroectodermal tumors (PNETs)
- •
Epidermoid
- •
Metastases
Aneurysm
Types
Saccular aneurysm (“berry aneurysm”), 80%
- •
Developmental or degenerative aneurysm (most common)
- •
Traumatic aneurysm
- •
Infectious (mycotic) aneurysm, 3%
- •
Neoplastic (oncotic) aneurysm
- •
Flow-related aneurysm
- •
Vasculopathies (systemic lupus erythematosus [SLE], Takayasu arteritis, fibromuscular dysplasia [FMD])
- •
Fusiform aneurysm
Dissecting aneurysm
Saccular Aneurysm
Berry-like outpouchings predominantly at arterial bifurcation points. Saccular aneurysm is a true aneurysm in which the sac consists of intima and adventitia. Causes: degenerative vascular injury (previously thought to be congenital) > trauma, infection, tumor, vasculopathies. Present in approximately 2% of population; multiple in 20%; 25% are giant aneurysms (>25 mm). Increased incidence of aneurysm in:
- •
Adult dominant polycystic kidney disease (ADPKD)
- •
Aortic coarctation
- •
FMD
- •
Structural collagen disorders (Marfan syndrome, Ehlers-Danlos syndrome)
- •
Neurofibromatosis type I (NF1)
- •
Spontaneous dissections
Imaging Features ( Fig. 6.29 )
Interpretation of conventional angiography
- •
Number of aneurysms: multiple in 20%
- •
Location, 90% in anterior circulation
- •
Most commonly anterior communicating artery, ICA–PCA junction, and MCA bifurcation
- •
Also basilar tip
- •
- •
Size
- •
Relation to parent vessel
- •
Presence and size of aneurysm neck
- •
CTA
- •
>95% sensitive for aneurysms >2 mm
- •
Magnetic resonance angiography (MRA)
- •
Usually combined with conventional MRI
- •
Used to screen patients with risk factors (e.g., adult polycystic kidney disease [APKD])
- •
Low sensitivity for aneurysms <4 mm
- •
Need to verify presence of aneurysm by reviewing single-slice raw images
- •

Complications
Rupture
- •
SAH
- •
Parenchymal hematoma
- •
Hydrocephalus
- •
Vasospasm
- •
Occurs 4–5 days after rupture
- •
Causes secondary infarctions
- •
Leading cause of death/morbidity from rupture
- •
Mass effect
- •
CN palsies (e.g., CN III palsy from ruptured posterior communicating artery aneurysm)
- •
Headache
- •
Death, 30%
Rebleeding
- •
50% rebleed within 6 months
- •
50% mortality
- •
In the presence of multiple aneurysms, one may identify the bleeding aneurysm using the following criteria:
- •
Location of SAH or hematoma adjacent to or around bleeding aneurysm
Anterior communicating aneurysm → interhemispheric fissure
MCA bifurcation aneurysm → Sylvian fissure
ICA–posterior communicating artery junction aneurysm → suprasellar cistern
Vertebrobasilar aneurysm → fourth ventricle, prepontine cistern
- •
Largest aneurysm is the one most likely to bleed
- •
Most irregular aneurysm is the one most likely to bleed
- •
Extravasation of contrast (rarely seen)
- •
Vasospasm adjacent to bleeding aneurysm
Giant Aneurysm
Aneurysm >25 mm in diameter
Clinical Findings
- •
Mass effect (CN palsies, retroorbital pain)
- •
Hemorrhage
Imaging Features
- •
Large mass lesion with internal blood degradation products
- •
Signet sign: eccentric vessel lumen with surrounding thrombus
- •
Curvilinear peripheral calcification
- •
Ring enhancement: fibrous outer wall enhances after complete thrombosis
- •
Mass effect on adjacent parenchyma
- •
Slow erosion of bone
Sloping of sellar floor
Undercutting of anterior clinoid
Enlarged superior orbital fissure
Infectious (Mycotic) Aneurysm
Causes
- •
Bacterial endocarditis, intravenous drug abuse (IVDA), 80%
- •
Meningitis, 10%
- •
Septic thrombophlebitis, 10%
Imaging Features
- •
Aneurysm itself is rarely visualized by CT.
- •
Most often located peripherally and multiple (differential diagnosis [DDx]: tumor emboli from atrial myxoma)
- •
Intense enhancement adjacent to vessel
- •
Conventional angiography is the imaging study of choice.
Fusiform (Atherosclerotic) Aneurysm
Elongated aneurysm caused by atherosclerotic disease. Most located in the vertebrobasilar system. Often associated with dolichoectasia (elongation and distention of the vertebrobasilar system).
Imaging Features
- •
Vertebrobasilar arteries are elongated, tortuous, and dilated.
- •
Tip of basilar artery may indent third ventricle.
- •
Aneurysm may be thrombosed.
CT: hyperdense
T1W: hyperintense
- •
Bizarre flow voids on MRI because of turbulent flow
Complications
- •
Brainstem infarction because of thrombosis
- •
Mass effect (CN palsies)
Dissecting Aneurysm
Following a dissection, an intramural hematoma may organize and result in a sac-like outpouching. Causes: trauma > vasculopathy (SLE, FMD) > spontaneous dissection.
Location: extracranial ICA > VA
Imaging Features
- •
Elongated contrast collections extending beyond the vessel lumen
- •
MRA is a useful screening modality.
- •
CTA may be used for diagnosis and follow-up.
- •
Angiography is sometimes required for imaging of vascular detail (dissection site).
Subarachnoid Hemorrhage (SAH)
Blood is present in the subarachnoid space and sometimes also within ventricles. Secondary vasospasm and brain infarction are the leading causes of death in SAH.
Causes
- •
Trauma
- •
Aneurysm (most common cause after trauma), 90%
- •
AVM/dural AV fistula
- •
Coagulopathy
- •
Extension of intraparenchymal hemorrhage (hypertension [HTN], tumor)
- •
Amyloid angiopathy
- •
Reversible cerebral vasoconstriction syndrome (RCVS)
- •
Idiopathic (e.g., perimesencephalic nonaneurysmal SAH)
- •
Spinal AVM
Imaging Features ( Fig. 6.30 )
- •
CT is the first imaging study of choice.
- •
Hyperdense CSF usually in basal cisterns, sylvian fissure (because of aneurysm location), and subarachnoid space
- •
Hematocrit effect in intraventricular hemorrhage
- •
MRI less sensitive than CT early on (deoxy-Hb and brain are isointense)
- •
MRI more sensitive than CT for detecting subacute (fluid-attenuated inversion recovery [FLAIR] bright)/chronic SAH (T2W/susceptibility dark)

Complications
- •
Hemorrhage-induced hydrocephalus is due to early ventricular obstruction and/or arachnoiditis.
- •
Vasospasm several days after SAH may lead to secondary infarctions.
- •
Leptomeningeal “superficial” siderosis (dark meninges on T2W): Fe deposition in meninges secondary to chronic recurrent SAH. The location of siderosis corresponds to the extent of central myelin. CNs I, II, and VIII are preferentially affected because these have peripheral myelin envelope. Other CNs have their transition points closer to the brainstem. If no cause is identified, MRI of the spine should be performed to exclude a chronically bleeding spinal neoplasm such as an ependymoma or a paraganglioma.
- •
Perimesencephalic SAH: angiography negative SAH; likely from venous bleed
Vascular Malformation
Types of Vascular Malformations
There are four types of malformation:
- •
AVM
Parenchymal (pial) malformations
Dural AVM and fistula
Mixed pial/dural AVM
- •
Capillary telangiectasia
- •
Cavernous malformation
- •
Venous malformations
Venous anomaly
Vein of Galen malformation
Venous varix
Arteriovenous Malformation (AVM)
Abnormal network of arteries and veins with no intervening capillary bed. 98% of AVMs are solitary. Peak age is 20–40 years.
Types
- •
Parenchymal, 80% (ICA and VA supply; congenital lesions)
- •
Dural, 10% (ECA supply; mostly acquired lesions)
- •
Mixed, 10%
Imaging Features ( Fig. 6.31 )
- •
MRI is imaging study of choice for detection of AVM; arteriography is superior for characterization and treatment planning.
- •
Serpiginous high and low signal (depending on flow rates) within feeding and draining vessels best seen by MRI/MRA.
- •
AVM replaces but does not displace brain tissue (i.e., mass effect is uncommon) unless complicated by hemorrhage and edema.
- •
Edema occurs only if there is recent hemorrhage or venous thrombosis with infarction.
- •
Flow-related aneurysm, 10%
- •
Adjacent parenchymal atrophy is common as a result of vascular steal and ischemia.
- •
Calcification, 25%
- •
Susceptibility artifacts on MRI if old hemorrhage is present.

Spetzler Criteria
| 0 | 1 | 2 | 3 | |
|---|---|---|---|---|
| Eloquence | No | Yes | — | — |
| Draining vein | Superficial | Deep | — | — |
| Size | — | <3 cm | 3–6 cm | <6 cm |
- •
Higher score is associated with higher chance of hemorrhage
- •
Other factors associated with poorer prognosis/higher risk of hemorrhage:
Intranidal aneurysm
Aneurysm in the circle of Willis
Aneurysm in arterial feeder
Venous stasis
Complications
- •
Hemorrhage (parenchymal > SAH > intraventricular)
- •
Seizures
- •
Cumulative risk of hemorrhage is approximately 3% per year.
Capillary Telangiectasia
Nests of dilated capillaries with normal brain interspersed between dilated capillaries. Commonly coexist with cavernous malformation. Location: pons > cerebral cortex, spinal cord > other locations.
Imaging Features
- •
CT is often normal.
- •
MRI:
Foci of increased signal intensity on contrast-enhanced studies
T2W hypointense foci if hemorrhage has occurred
- •
Angiography is often normal but may show faint vascular stain.
Cavernous Malformation ( Fig. 6.32 )
Dilated endothelial cell-lined spaces with no normal brain within lesion. Usually detectable because cavernous malformation contains blood degradation products of different stages. Location: 80% supratentorial, 60%–80% multiple. All age groups.

Clinical Findings
- •
Seizures
- •
Focal deficits
- •
Headache secondary to occult hemorrhage
Imaging Features ( Fig. 6.33 )
- •
MRI is the imaging study of choice.
- •
Complex signal intensities because of blood products of varying age
- •
“Popcorn” lesion: bright lobulated center with complete black (hemosiderin) rim
- •
Always obtain susceptibility sequences to detect coexistent smaller lesions.
- •
May be calcified
- •
Variable contrast enhancement
- •
Angiography is usually normal.
- •
Multiple cavernous malformations may be acquired (e.g., after radiation) or hereditary (autosomal dominant [AD] inheritance, more common in Hispanics)

Developmental Venous Anomaly (Anomalous Vein)
Multiple small veins converge into a large transcortical draining vein. Typically discovered incidentally. Venous angiomas per se do not hemorrhage but are associated with cavernous malformations (30%), which do bleed.
Imaging Features ( Fig. 6.34 )
Angiography
- •
Medusa head seen on venous phase (hallmark)
- •
Dilated medullary veins draining into a large transcortical vein
- •
MRI
- •
Medusa head or large transcortical vein best seen on spin-echo images or after administration of gadolinium (Gd)
- •
Location in deep cerebellar WM or deep cerebral WM
- •
Adjacent to the frontal horn (most common site)
- •
Hemorrhage best detectable with MR susceptibility sequences, 10%.

Vein of Galen AVM
Complex group of vascular anomalies that consist of a central AVM and resultant varix of the vein of Galen (incorrectly referred to as vein of Galen “aneurysm”). Two main types exist with the common feature of a dilated midline venous structure:
Vein of Galen AVM
- •
Primary malformation in development of vein of Galen
- •
Direct AV shunts involving embryologic venous precursor of the vein of Galen (median prosencephalic vein of Markowski)
- •
Choroidal arteriovenous fistula (AVF) with no nidus
- •
Absence of normal vein of Galen
- •
Median prosencephalic vein does not drain normal brain tissue.
- •
Manifests as high-output congestive heart failure (CHF) in infants and hydrocephalus in older children
- •
Vein of Galen varix
- •
Primary parenchymal AVM drains into vein of Galen, which secondarily enlarges.
- •
Thalamic AVM with nidus is usually the primary AVM.
- •
Uncommon in neonates
- •
Higher risk of hemorrhage than the vein of Galen AVM
- •
Imaging Features
US
- •
First-choice imaging modality
- •
Sonolucent midline structure superior/posterior to third ventricle
- •
Color Doppler US to exclude arachnoid/developmental cyst
- •
Angiography
- •
Used to determine type and therapy
- •
Endovascular embolization: therapy of choice
- •
MRI
- •
Indicated to assess extent of brain damage that influences therapy
- •
Chest radiography
- •
High-output CHF, large heart
- •
Stroke
Stroke is a term that describes an acute episode of neurologic deficit. 80% of strokes are due to cerebral ischemia (embolic or thrombotic). Transient ischemic attacks (TIAs) are focal neurologic events that resolve within 24 hours; those that resolve after 24 hours are called reversible ischemic neurologic deficits (RINDs).
Causes
Cerebral infarction, 80%
- •
Atherosclerosis-related occlusion of vessels, 45%
- •
Small vessel disease, 15%
- •
Cardioembolic, 15%
- •
Other, 5%
- •
Intracranial hemorrhage, 15%
Nontraumatic SAH, 5%
Venous occlusion, 1%
| Older Patient | Younger Patient | Child |
|---|---|---|
| Atherosclerosis | Emboli | Emboli from congenital heart disease |
| Cardioembolic | Arterial dissections | Venous thrombosis |
| Vasculopathy (FMD, vasculitis) | Blood dyscrasias (i.e., sickle cell disease) | |
| Drug abuse |
Atherosclerotic Disease
Atherosclerosis represents the most common cause of cerebral ischemia/infarction. Carotid atherosclerosis causes embolic ischemia; intracranial atherosclerosis causes in situ thrombotic or distal embolic ischemia. Location: carotid bifurcation (ICA origin) > carotid siphon, MCA > distal basilar.
Patients with symptomatic carotid stenosis of >70% in luminal diameter and symptoms have an increased risk of stroke and benefit from carotid endarterectomy. Patients with stenosis <70% or who are asymptomatic are usually treated medically.
Imaging Features
Gray-scale imaging (B-scan) of carotid arteries
- •
Evaluate plaque morphology/extent
- •
Determine severity of stenosis (residual lumen)
- •
Other features
Slim sign: collapse of ICA above stenosis
Collateral circulation
- •
Doppler imaging of carotid arteries
- •
Severity of stenosis determined by measuring peak systolic velocity
50%–70%: velocity 125–250 cm/s
70%–90%: velocity 250–400 cm/s
>90%: velocity >400 cm/s
- •
Stenoses >95% may result in decreased velocity (<25 cm/s)
- •
90% accuracy for >50% stenoses
- •
Other measures used for quantifying stenoses
End-diastolic velocity (severe stenosis: >100 cm/s)
ICA/CCA peak systolic velocity ratio (severe stenosis: >4)
ICA/CCA peak end-diastolic velocity ratio
- •
Innominate artery stenosis may cause right CCA/ICA parvus tardus
- •
CCA occlusion may result in reversal of flow in ECA
- •
Color Doppler flow imaging of carotid arteries
- •
High-grade stenosis with minimal flow (string sign in angiography) is detected more reliably than with conventional Doppler US.
- •
CT and MR angiography are used for confirmation of US diagnosis of carotid stenosis.
- •
On CTA, 1.0–1.5-mm residual lumen corresponds to 70%–90% stenosis.
- •
To determine complete occlusion versus a string sign (near but not complete occlusion), delayed images must be obtained immediately after the initial contrast images.
- •
At some institutions, carotid endarterectomy is performed on the basis of US and CTA/MRA if the results are concordant.
- •
Pitfalls of US and MRA in the diagnosis of carotid stenosis:
Near occlusions (may be overdiagnosed as occluded)
Postendarterectomy (complex flow, clip artifacts)
Ulcerated plaques (suboptimal detection)
Tandem lesions (easily missed)
- •
Carotid arteriography (gold standard) is primarily used for:
- •
Discordant MRA/CTA and US results
- •
Postendarterectomy patient
- •
Accurate evaluation of tandem lesions and collateral circulation
- •
Evaluation of aortic arch (AA) and great vessels
- •
Cerebral Ischemia and Infarction
Cerebral ischemia refers to a diminished blood supply to the brain. Infarction refers to brain damage, being the result of ischemia.
Causes
Large vessel occlusion, 50%
Small vessel occlusion (lacunar infarcts), 20%
Emboli
- •
Cardiac, 15%
Arrhythmia, atrial fibrillation
Endocarditis
Atrial myxoma
Myocardial infarction (anterior infarction)
Left ventricular aneurysm
- •
Noncardiac
Atherosclerosis
Fat, air embolism
- •
Vasculitis
- •
SLE
- •
Polyarteritis nodosa
- •
Other
- •
Hypoperfusion (border zone or watershed infarcts)
- •
Vasospasm: ruptured aneurysm, SAH
- •
Hematologic abnormalities
Hypercoagulable states
Hb abnormalities (carbon monoxide [CO] poisoning, sickle cell)
- •
Venous occlusion
- •
Moyamoya disease
- •
Imaging Features
Angiographic signs of cerebral infarction
- •
Vessel occlusion, 50%
- •
Slow antegrade flow, delayed arterial emptying, 15%
- •
Collateral filling, 20%
- •
Nonperfused areas, 5%
- •
Vascular blush (luxury perfusion), 20%
- •
AV shunting, 10%
- •
Mass effect, 40%
- •
- •
CT is the first study of choice in acute stroke in order to:
Exclude intracranial hemorrhage
Exclude underlying mass/AVM
- •
Most CT examinations are normal in early stroke.
- •
Early CT signs of cerebral infarction include:
Loss of gray–white interfaces (insular ribbon sign)
Sulcal effacement
Hyperdense clot in artery on noncontrast CT (dense MCA sign)
- •
Edema (maximum edema occurs 3–5 days after infarction)
Cytotoxic edema develops within 6 hours (detectable by MRI).
Vasogenic edema develops later (first detectable by CT at 12–24 hours).
- •
Characteristic differences between distributions of infarcts:
Embolic: periphery, wedge shaped
Hypoperfusion in watershed areas of ACA/MCA and MCA/PCA—border zone infarcts
Basal ganglia infarcts
Generalized cortical laminar necrosis
- •
Reperfusion hemorrhage is not uncommon after 48 hours.
MRI much more sensitive than CT in detection
Most hemorrhages are petechial or gyral.
CT AND MRI APPEARANCE OF INFARCTS
Factor
1st Day
1st Week
1st Month
>1 Month
Stage
Acute
Early subacute
Late subacute
Chronic
CT density a
Subtle decrease
Decrease
Hypodense
Hypodense
MRI
T2W: edema
T2W: edema
Varied
T1W dark, T2W bright
Mass effect
Mild
Maximum
Resolving
Encephalomalacia
Hemorrhage
No
Most likely here
Variable
MRI detectable
Enhancement
No
Yes; maximum at 2–3 weeks
Decreasing
No
CT , Computed tomography; MRI , magnetic resonance image; T1W , T1-weighted; T2W , T2-weighted.
- •
Mass effect in acute infarction
Sulcal effacement
Ventricular compression
- •
Subacute infarcts
Hemorrhagic component, 40%
Gyral or patchy contrast enhancement (1–3 weeks)
GWM edema
- •
Chronic infarcts
Focal tissue loss: atrophy, porencephaly, cavitation, focal ventricular dilatation
Wallerian degeneration: distal axonal breakdown along white matter tracks
Pearls
- •
Cerebral infarcts cannot be excluded on the basis of a negative CT. MRI with diffusion-weighted imaging (DWI) and perfusion-weighted imaging (PWI) (see later discussion) should be performed immediately if an acute infarct is suspected.
- •
Contrast administration is reserved for clinical problem cases and should not be routinely given, particularly on the first examination.
- •
Luxury perfusion refers to hyperemia of an ischemic area. The increased blood flow is thought to be due to compensatory vasodilatation secondary to parenchymal lactic acidosis.
- •
Cerebral infarcts have a peripheral rim of viable but ischemic tissue (penumbra).
- •
Thrombotic and embolic infarcts occur in vascular distributions (i.e., MCA, ACA, PCA, etc.).
- •
MR perfusion/diffusion studies are imaging studies of choice in acute stroke.
DWI detects reduced diffusion coefficient in acute infarction, which is thought to reflect cytotoxic edema.
In patients with multiple T2W signal abnormalities from a variety of causes, DWI can identify those signal abnormalities that arise from acute infarction.
- •
50% of patients with TIA have DWI abnormality.
Diffusion and Perfusion Imaging in Stroke
Standard diffusion protocol includes a DWI and an apparent diffusion coefficient (ADC) image. These are usually interpreted side by side. DWI: summation of diffusion and T2 effects, abnormalities appear as high signal. ADC: diffusion effects only; abnormalities appear as low signal. DWI lesion volume is considered to be the most accurate measure of infarct core.
Perfusion imaging is performed using the susceptibility effects of a rapid bolus injection of Gd administered intravenously. Rapid continuous scanning during this injection allows the signal changes associated with the Gd to be plotted over time for a selected brain volume. These time–signal plots can be processed to yield several possible parameters relating to cerebral perfusion. Vascular parameters: mean transit time (MTT) is measured in seconds and is a measure of how long it takes blood to reach the particular region of the brain. Cerebral blood volume (CBV) is measured in relative units and correlates to the total volume of circulating blood in the voxel. Cerebral blood flow (CBF) is measured in relative units and correlates to the flow of blood in the voxel.
Similar to computed tomographic perfusion (CTP), magnetic resonance (MR) perfusion has not been shown to have a role in selecting patients for endovascular therapy.
Interpretation
| Sequence | Hyperacute (<6 hr) | Acute (>6 hr) | Subacute (Days to Weeks) | Chronic |
|---|---|---|---|---|
| DWI | High | High | High (decrease with time) | Isointense to bright |
| ADC | Low | Low | Low to isointense | Isointense to bright |
| T2W/FLAIR | Isointense | Slightly bright to bright | Bright | Bright |
- •
A typical infarct is DWI bright and ADC dark. Gliosis appears DWI bright because of T2 shine-through but is also bright on ADC.
- •
DWI is very sensitive for detecting disease (will pick up infarcts from about 30 min onward but is nonspecific and will also detect nonischemic disease).
- •
ADC is less sensitive than DWI, but dark signal is fairly specific for restricted diffusion, which usually means ischemia.
- •
Significance of a DWI-bright, ADC-dark lesion: this tissue will almost certainly go on to infarct and full necrosis. Rare instances of reversible lesions have been reported (venous thrombosis, seizures, hemiplegic migraine, hyperacute arterial thrombosis).
- •
EXP (exponential) is the map that “subtracts” the T2 effect. In equivocal cases, use EXP map as a problem solver (if it stays bright on the EXP map, then it is true restricted diffusion).
- •
MTT is highly sensitive for disturbances in perfusion but not good for prediction of later events. For example, an asymptomatic carotid occlusion would have a dramatically abnormal MTT, without the patient being distressed.
- •
CBV is a parameter that changes late in the ischemic cascade, and, usually, reduced CBV is also accompanied by restricted diffusion. Reduced CBV (and restricted diffusion) correlates well with tissue that goes on to infarction.
- •
CBF in the experimental setting can be used to predict the likelihood of brain tissue infarcting. In current clinical practice, a CBF abnormality exceeding the DWI abnormality (diffusion–perfusion mismatch) implies that there is brain at risk that has not infarcted yet. This brain at risk is the target of therapeutic interventions.
Role of CT/CTA in Acute Stroke
Important in early stages of stroke evaluation to facilitate thrombolytic therapy. CTA demonstrates the anatomic details of the neurovasculature from the great vessel origins at the AA to their intracranial termination. Highly accurate in the identification of proximal large vessel circle of Willis occlusions and therefore in the rapid triage of patients to IA or IV thrombolytic therapy.
Technique
- •
Noncontrast CT is performed initially to exclude hemorrhage; an absolute contraindication to thrombolytic therapy. Large parenchymal hypodensity (> one-third of a vascular territory), typically indicating irreversible “core” of infarction, is a relative contraindication to thrombolysis.
- •
CTA/CTP imaging is performed on a multislice scanner, which enables acquisition of imaging data from entire vascular territories in <1 min.
- •
The initial CT scan is performed at 140 kV, 170 mA, pitch = “high quality” (3 : 1), and a table speed of 7.5 mm/s.
- •
Images are obtained from the skull base to the vertex. Slice thickness can be set at 2.5 mm, at 5 mm, or at both.
- •
Initial image review is in “real time,” directly at the CT console. The use of narrow window-width settings, with a center level of about 30 HU (width of 5–30 HU), facilitates the detection of early, subtle, ischemic changes contiguous with normal parenchyma.
- •
Blood volume CTP is performed without repositioning the patient.
- •
Approximately 90–120 mL of nonionic, isoosmolar contrast is used for CTA from the skull base to the vertex, with a 25-s scan delay. A longer delay may be needed for patients with compromised cardiac function and atrial fibrillation.
- •
Initial scan parameters are as per the noncontrast CT scan described earlier. A second phase of scanning is performed immediately, with minimal possible delay, from the AA to the skull base, with similar scan parameters except for an increase in the table speed to 15 mm/s. Major advantages of first scanning the intracranial circulation include (1) obtaining the most important data first, which can be reviewed during subsequent acquisition; and (2) allowing time for clearance of dense IV contrast from the subclavian, axillary, and other veins at the thoracic inlet, reducing streak artifact.
- •
On a >16-slice scanner, CTA may be performed from the vertex to the AA in one pass, with triggering of imaging when the contrast bolus reaches the arch (“smart prep”). This gets rid of the loss of contrast enhancement in the neck CTA usually seen with a two-stack protocol.
- •
Concerns related to radiation dose and variability in estimating infarct core have limited the utility of CTP in selecting acute stroke patients for IV thrombolysis or endovascular therapy.
Therapeutic Options
- •
To date, the only US Food and Drug Administration (FDA)-approved treatment for acute stroke is IV thrombolysis with recombinant tissue plasminogen activator (r-tPA), administered within 3 hours of stroke onset. If thrombolysis is applied beyond this time window, the increased probability of intracranial hemorrhage is considered unacceptable.
- •
The time window for treatment with IA agents is twice as long for the anterior circulation and indefinite for the posterior circulation (depending on risk-to-benefit ratio); however, IA treatments, including IA thrombolysis and clot retrieval or thrombectomy with mechanical devices, have not yet received FDA approval. Recent trials (e.g., MR CLEAN) have demonstrated the safety and efficacy of IA therapy administered within 6 hours in patients with acute ischemic stroke caused by proximal occlusion of the anterior circulation. For thrombosis localized to the posterior circulation, the time window for treatment may be extended beyond 6 hours due to the extreme consequences of loss of blood flow to the brainstem, despite the risk of hemorrhage.
- •
CTA in acute stroke has the potential to not only help exclude patients at high risk for hemorrhage from thrombolysis but also identify those patients most likely to benefit from thrombolysis. Even without hemorrhage, treatment failure with thrombolytics is not uncommon.
- •
The choice between IA and IV thrombolysis depends on a variety of factors, including the time post-ictus, the clinical status of the patient, and whether the clot is proximal (IA) or distal (IV). When typical findings of occlusive thrombus on CTA are not present, the DDxs include lacunar infarct, early small distal embolic infarct, TIA, complex migraine headaches, and seizure.
Lacunar Infarcts
Lacunar infarcts account for 20% of all strokes. The term refers to the occlusion of penetrating cerebral arterioles, most often caused by arteriolar lipohyalinosis (hypertensive vasculopathy). Commonly affected are:
- •
Thalamoperforators (thalamus)
- •
Lenticulostriates (caudate, putamen, internal capsule)
- •
Brainstem perforator (pons)
Lacunar infarcts usually cause characteristic clinical syndromes: pure motor hemiparesis, pure hemisensory deficit, hemiparetic ataxia, or dysarthria-hand deficit.
Imaging Features
- •
MRI is the imaging study of choice.
- •
Small ovoid lesion (<1 cm): hyperintense on T2W and proton density–weighted (PDW) image.
- •
Location of lesions is very helpful in DDx:
Dilated perivascular or Virchow-Robin (VR) space
- •
Typically located in the basal ganglia along the anterior commissure
- •
Can be large (giant VR space), can cause mass effect, and can have surrounding gliosis
- •
More elongated appearance on coronal images
- •
Basilar Artery Thromboembolic Occlusion
Risk Factors
- •
Atherosclerosis
- •
Cardiac arrhythmias
- •
VA dissection
- •
Cocaine use
- •
Oral contraceptives (OCs)
Top of Basilar Artery Syndrome
- •
Oculomotor dysfunction
- •
Third nerve and vertical gaze palsies
- •
Hemiataxia
- •
Altered consciousness
Imaging Features
- •
Unlike anterior circulation infarction, the duration of symptoms before treatment, age of patient, and neurologic status at initiation of treatment do not predict the outcome of thrombolytic therapy.
- •
Basilar artery appears abnormally dense by CT.
- •
T2W hyperintensity is present in thalami, midbrain, pons, cerebellum, and occipital lobes.
- •
Absence of normal flow void in basilar artery and VA
- •
T1W with fat saturation may be useful, to look for associated dissection.
Central Nervous System (CNS) Vasculitis
CNS vasculitis may be caused by a large variety of underlying diseases.
Differentiation may be possible by correlating systemic findings and clinical history, but a biopsy is often required for diagnosis.
Causes
Infectious vasculitis
- •
Bacterial, viral, fungal, tuberculosis (TB), syphilis
- •
Human immunodeficiency virus (HIV)-related
- •
Systemic vasculitis
- •
Polyarteritis nodosa
- •
Giant-cell arteritis/temporal arteritis
- •
Takayasu arteritis
- •
Kawasaki syndrome
- •
Behçet disease
- •
Collagen vascular diseases
- •
Serum sickness
- •
Allergic angiitis
- •
Granulomatous vasculitis
- •
Sarcoidosis
- •
Wegener granulomatosis
- •
Granulomatous angiitis (primary and secondary)
- •
Drug-related vasculitis
- •
Cocaine
- •
Amphetamines
- •
Ergots
- •
Heroin
- •
Imaging Features
MRI
- •
Most MRI findings are nonspecific.
- •
T2W hyperintensities that progress rapidly are highly suggestive.
- •
Infarctions
- •
Hemorrhage
- •
Angiography
- •
CTA may also show areas of focal narrowing, similar to catheter angiography.
- •
Catheter angiography is the more definitive imaging study, but findings are often also nonspecific.
- •
Other imaging findings
- •
Vessel occlusions
- •
Stenoses
- •
Aneurysms
- •
Moyamoya Disease
Idiopathic progressive vascular occlusive disease. Common in Japanese (moyamoya = puff of smoke). Most commonly there is occlusion of supraclinoid ICA and numerous meningeal, lenticulostriate, thalamoperforate collaterals; occasionally the posterior circulation is involved.
Imaging Features
- •
“Puff of smoke” on angiography: numerous collaterals supplying ACA and MCA
- •
Stenosis or occlusion of supraclinoid ICA
- •
MRI: multiple tiny flow voids on T2W images, which are collaterals; engorged collaterals may produce FLAIR bright sulci (Ivy sign)
- •
Similar radiographic findings can be seen in (mnemonic: RAINS ):
R adiation vasculopathy
A therosclerosis
I diopathic (moyamoya)
N eurofibromatosis type 1
S ickle cell disease
Amyloid Angiopathy
Amyloid deposition in walls of small vessels. Common in older adult normotensive patients.
Imaging Features
- •
Usually multiple areas of hemorrhage sparing the basal ganglia
- •
Foci of hemorrhage at corticomedullary junction
- •
MRI is the imaging study of choice (susceptibility sequences).
Reversible Cerebral Vasoconstriction Syndrome (RCVS)
Vasoconstriction syndrome commonly associated with convexity SAH. Typical presentation: middle-aged woman, severe “thunderclap” headache, and HTN. Other complications: seizure, infarction, and posterior reversible leukencephalopathy (PRES). Imaging findings: multifocal segmental arterial stenosis that resolves within 12 weeks of presentation.
Cadasil
- •
Cerebral AD arteriopathy with subcortical infarcts and leukoencephalopathy
- •
Hereditary stroke disorder, commonly presents with migraine headaches and TIA/strokes. Age: 40–50, though imaging features may be detected earlier.
MRI Features
- •
Confluent T2 hyperintensities around periventricular WM, pons, and basal ganglia
- •
Predilection for the anterior temporal lobes
Venoocclusive Disease
Spectrum cerebral venous occlusion involving the following venous territories:
- •
Venous sinuses
- •
Cortical veins
- •
Deep cerebral veins (internal cerebral veins, basal vein of Rosenthal, vein of Galen)
- •
Unusual forms of venous stasis/occlusion (e.g., high-flow angiopathy associated with AVM)
Venous Sinus Thrombosis
Nonspecific clinical presentation. High mortality because of secondary infarction/hemorrhage.
Causes
- •
Pregnancy/puerperium
- •
Dehydration (particularly in children)
- •
Infection (mastoiditis, otitis, meningitis)
- •
Tumors with dural invasion
- •
l -Asparaginase treatment
- •
Any hypercoagulable state
- •
Trauma
- •
OCs
- •
Blood dyscrasias and coagulopathies
Imaging Features ( Fig. 6.35 )
General
- •
CTV is the imaging method of choice, followed by magnetic resonance venography (MRV)
- •
Location: superior sagittal sinus > transverse sinus > sigmoid sinus > cavernous sinus
- •
Primary (sinus occlusion)
- •
Clot in sinus is hyperdense on noncontrast CT and hypodense on contrast-enhanced CT.
- •
Dural enhancement of sinus margin: delta sign
- •
MRI
Bright sinus on T1W and T2W (depending on stage)
Absence of flow void
- •
Pearl: if bilateral thalamic infarcts or infarcts do not conform to an arterial territory, suspect venous thrombosis.
- •
Secondary (effects of venous infarction)
- •
Subcortical infarctions, which may not follow arterial distribution
- •
Corticomedullary hemorrhage is common.
- •

Trauma
General
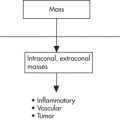
Classification of Injury
Primary lesions ( Fig. 6.36 )
- •
Extraaxial hemorrhage
SAH
Subdural hematoma (SDH)
Epidural hematoma (EDH)
- •
Intraaxial lesions
Diffuse axonal injury
Cortical contusion
Deep cerebral GM injury
Brainstem injury
Intraventricular hemorrhage
- •
Fractures

FIG. 6.36
- •
Secondary lesions
- •
Brain herniations
- •
Traumatic ischemia
- •
Diffuse cerebral edema
- •
Hypoxic brain injury
- •
Mechanism of Traumatic Brain Injury (TBI)
Projectile (missile) injury
- •
Gunshot wounds
- •
Spear injury
- •
Blunt injury (sudden deceleration or rotation)
- •
Automobile accident
- •
Fall from heights
- •
Direct blow
- •
Glasgow Coma Scale
Minor head injury: score 13–15; moderate head injury: score 9–12; severe head injury: score ≤8.
Score
Eye opening
- •
Spontaneous = 4
- •
To sound = 3
- •
To pain = 2
- •
None = 1
- •
Best motor response
- •
Obeys command = 6
- •
Localizes pain = 5
- •
Normal flexion = 4
- •
Abnormal flexion = 3
- •
Extension = 2
- •
None = 1
- •
Best verbal response
- •
Oriented = 5
- •
Confused = 4
- •
Inappropriate words = 3
- •
Incomprehensible = 2
- •
None = 1
- •
Primary Brain Injury
Epidural Hematoma (EDH) ( Fig. 6.37 )
Types
- •
Arterial EDH, 90% (middle meningeal artery)
- •
Venous EDH, 10% (sinus laceration, meningeal vein)
Posterior fossa: transverse or sigmoid sinus laceration (common)
Parasagittal: tear of superior sagittal sinus

Large EDHs are neurosurgical emergencies. Small (<5-mm thick) EDHs adjacent to fractures are common and do not represent a clinical emergency. 95% of all EDHs are associated with fractures.
Imaging Features
Arterial EDH
- •
95% are unilateral, temporoparietal
- •
Biconvex, lenticular shape
- •
Does not cross suture lines
- •
May cross dural reflections (falx tentorium), in contradistinction to SDH
- •
Commonly associated with skull fractures
- •
Heterogeneity predicts rapid expansion of EDH, with areas of low density representing active bleeding.
- •
Venous EDH
- •
More variable in shape (low-pressure bleed)
- •
Often requires delayed imaging because of delayed onset of bleed after trauma
- •
Subdural Hematoma (SDH) ( Fig. 6.38 )
Caused by traumatic tear of bridging veins (rarely arteries). In contradistinction to EDH, there is no consistent relationship to the presence of skull fractures. Common in infants (child abuse; 80% are bilateral or interhemispheric) and older adult patients (20% are bilateral).

Imaging Features
Morphology of hematoma
- •
95% supratentorial
- •
Crescentic shape along brain surface
- •
Crosses suture lines
- •
Does not cross dural reflections (falx, tentorium)
- •
MRI > CT particularly for:
Bilateral hematomas
Interhemispheric hematomas
Hematomas along tentorium
Subacute SDH
- •
Other imaging findings
- •
Hematocrit level in subacute and early chronic hematomas
- •
Mass effect is present if SDH is large.
- •
Acute SDH
- •
Hyperdense or mixed density
- •
Subacute SDH (beyond 1 week)
- •
May be isointense and difficult to detect on CT
- •
Enhancing membrane and displaced cortical vessels (contrast administration is helpful)
- •
Chronic SDH (beyond several weeks)
- •
Hypodense
- •
Mixed density with rebleeding
- •
Calcification, 1%
- •
| Epidural Hematoma | Subdural Hematoma | |
|---|---|---|
| Incidence | In <5% of TBIs | In 10%–20% of TBIs |
| Cause | Fracture | Tear of cortical veins |
| Location | Between skull and dura | Between dura and arachnoid |
| Shape | Biconvex | Crescentic |
| CT | 70% hyperintense, 30% isointense | Variable depending on age |
| T1W MRI | Isointense |
Subdural Hygroma
Accumulation of CSF in subdural space after traumatic arachnoid tear.
Imaging Features
- •
CSF density
- •
Does not extend into sulci
- •
Vessels cross through lesion.
- •
Main considerations in DDx:
Chronic SDH
Focal atrophy with widened subarachnoid space
Diffuse Axonal Injury (DAI)
DAI is due to axonal disruption from shearing forces of acceleration/deceleration. It is most commonly seen in severe head injury. Loss of consciousness occurs at time of injury.
Imaging Features ( Fig. 6.39 )
- •
Characteristic location of lesions:
Lobar GM/WM junction
Corpus callosum
Dorsolateral brainstem
- •
Initial CT is often normal.
- •
Petechial hemorrhage develops later.
- •
Multifocal T2W bright lesions
- •
May show restricted diffusion, especially in the corpus callosum
- •
Susceptibility-sensitive gradient-echo sequences are most sensitive in detecting hemorrhagic shear injuries (acute or chronic) and can be helpful to document the extent of parenchymal injury (medicolegal implications) and to assess long-term prognosis (cognitive function) for patient and family.

Cortical Contusion ( Fig. 6.40 )
Focal hemorrhage/edema in gyri secondary to brain impacting (or rotational forces) on bone or dura.

Imaging Features
- •
Characteristic location of lesions
Anterior temporal lobes, 50%
Inferior frontal lobes, 30%
Parasagittal hemisphere
Brainstem
- •
Lesions evolve with time; delayed hemorrhage in 20%
- •
Initial CT is often normal; later on, low-density lesions with or without blood in them develop.
- •
Late: encephalomalacia
Secondary Brain Injury
Cerebral Herniation ( Fig. 6.41 )
Mechanical displacement of brain secondary to mass effect. Herniation causes brain compression with neurologic dysfunction and vascular compromise (ischemia).

Types
- •
Subfalcine herniation
- •
Transtentorial (uncal) herniation
Descending
Ascending
- •
Tonsillar herniation
Imaging Features ( Fig. 6.42 )
Subfalcine herniation
- •
Cingulate gyrus slips under free margin of falx cerebri.
- •
Compression of ipsilateral ventricle
- •
Entrapment and enlargement of contralateral ventricle
- •
May result in ACA ischemia
- •
Descending transtentorial herniation (uncal) ( Fig. 6.43 )
- •
Uncus/parahippocampal gyrus displaced medially over tentorium
- •
Effacement of ipsilateral suprasellar cistern
- •
Enlargement of ipsilateral cerebellopontine angle (CPA) cistern
- •
Displaced midbrain impacts on contralateral tentorium.
Duret hemorrhage (anterior midbrain)
Kernohan notch (mass effect on peduncle)
- •
PCA ischemia: occipital lobe, thalami, midbrain

FIG. 6.43
- •
Ascending transtentorial herniation
- •
Posterior fossa mass (i.e., hemorrhage) pushes cerebellum up through incisura.
- •
Loss of quadrigeminal cistern
- •
Tonsillar herniation
- •
Cerebellar tonsils pushed inferiorly
- •

Diffuse Cerebral Edema
Massive brain swelling and intracranial HTN secondary to dysfunction of cerebrovascular autoregulation and alterations of the BBB. Underlying causes include ischemia and severe trauma. Ischemia may be primary (e.g., anoxic, drowning) or secondary to other brain injuries (e.g., large SDH) and may be followed by infarction. More common in children. High morbidity/mortality rates.
Imaging Features
- •
Findings develop 24–48 hours after injury.
- •
Effacement of sulci and basilar cisterns
Hint: the sulci near the vertex should always be present no matter how young the patient is, unless there is edema.
- •
Loss of perimesencephalic cisterns (hallmark)
- •
Loss of GM/WM interface (cerebral edema)
- •
White cerebellum sign: sparing of brainstem and cerebellum in comparison with the cerebral hemispheres
- •
Pseudosubarachnoid hemorrhage sign: apparent hyperdensity in the sulci and basal cisterns due to diffuse hypoattenuation of the brain parenchyma
Arterial Dissection
Blood splits the media, creating a false lumen that dissects the arterial wall. Precise pathogenesis is unclear. Location: cervical ICA (starts 2 cm distal to bulb and spares bulb) > intracranial ICA (petrous canal) > VA > others.
Underlying Causes
- •
Spontaneous or with minimal trauma (strain, sports)
- •
Trauma
- •
HTN
- •
Vasculopathy (FMD, Marfan syndrome)
- •
Migraine headache
- •
Drug abuse
Imaging Features
- •
CTA is preferred first study of choice—see intimal flap and caliber change
- •
MRI/MRA can also be performed.
T1W bright hematoma in vessel wall (sequence: T1W with fat saturation): must be interpreted in conjunction with MRA
MRA string sign
- •
Conventional angiography may establish the diagnosis and fully elucidate abnormal flow patterns.
- •
Long-segment fusiform narrowing of affected artery
Complications
- •
Thrombosis
- •
Emboli and infarction
- •
Intramural hemorrhage
- •
False aneurysm
Carotid-Cavernous Sinus Fistula (CCF)
Abnormal connection between carotid artery and venous cavernous sinus. Ocular bruit.
Types
- •
Traumatic CCF (high flow)
- •
Spontaneous CCF
Rupture of aneurysm in its cavernous segment (less common; high flow)
Dural fistula (AVM) of the cavernous sinus (low flow); usually associated with venous thrombosis in older patients
Imaging Features
- •
Enlargement of ipsilateral cavernous sinus
- •
Enlargement of superior ophthalmic vein
- •
Proptosis
- •
Enlargement of extraocular muscles
- •
Angiographic embolization with detachable balloons (traumatic fistulas)
Related posts:
Stay updated, free articles. Join our Telegram channel

Full access? Get Clinical Tree


