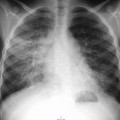
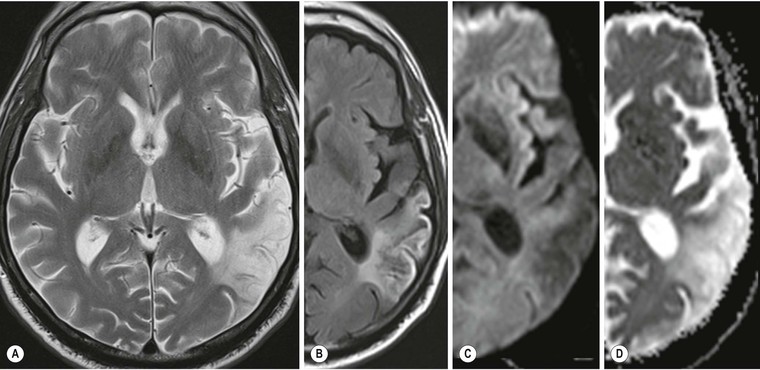
Amrish Mehta, Brynmor P. Jones Stroke is the third leading cause of death in Western populations and is the largest single cause of adult disability. It has a tremendous medical, social and economic impact. Over 130,000 cases develop in the UK every year. The annual cost to the NHS, UK families, businesses and public sector exceeds £7 billion.1 ‘Stroke’ is an imprecise term used to describe the sudden onset of a persistent neurological deficit caused by partial or complete blockage (ischaemic stroke) or rupture of a cerebral blood vessel (haemorrhage). Ischaemic stroke, which constitutes the great majority of cases (~ 85%),2 will be discussed in this section. An account of intracranial haemorrhage will follow in the next section. A transient ischaemic attack (TIA) by definition resolves within 24 h. This includes amaurosis fugax, a transient loss of vision in one eye. The risk of stroke following a TIA is higher than previously thought, maybe up to 8% in the first week and 12% within a month,3 and even more in those awaiting endarterectomy for a symptomatic carotid stenosis.4 Indeed, up to 44% of clinical TIAs have recently been shown to actually represent small completed brain infarcts on imaging,5 and in this situation, the risk of a persistent neurological deficit from a subsequent event is further increased.6 Whilst still essential for the exclusion of non-ischaemic causes of the fixed deficit and to identify surgical remedial lesions, imaging is now pivotal in modern acute stroke management and the strategies to recanalise the occluded artery. Normal cerebral blood flow (CBF) is 50–55 mL/100 g brain tissue/min. Cerebral autoregulation responds to a fall in cerebral perfusion pressure (CPP) with vasodilatation and recruitment of collateral vessels, thus increasing cerebral blood volume (CBV) and reducing resistance, in order to maintain CBF. The average time a blood cell remains with a particular volume of tissue rises due to vasodilatation and collateral flow, resulting in a prolonged mean transit time (MTT) and thereby allowing improved oxygen delivery. After the vessels are fully dilated the autoregulatory system cannot properly respond to any further reduction in CPP and therefore CBF starts to decline. Oxygen extraction goes up to compensate, but once this is maximal any further fall in CBF causes cellular dysfunction. The loss of normal neuronal electrical function occurs when CBF falls to 15–20 mL/100 g/min. This may, however, be reversible, depending on the severity and duration of the ischaemia, such that irreversible infarction is likely to occur within minutes if the CBF <10, but moderate ischaemia (10–20) may be reversible for a few hours. At levels of CBF <10, hypoxaemia leads to failure of the ATP-driven cell integrity systems (glutamate, NMDA, Na+/K+), resulting in cell depolarisation and influx of Na+ and water. Cellular swelling and cell death occurs (cytotoxic oedema). In time, structural breakdown of the blood–brain barrier occurs due to ischaemic damage to capillary endothelium. Leakage of intravascular fluid and protein into the extracellular space and later net influx of water to the infarcted area cause vasogenic oedema.7–9 It is important to note that CBV generally remains preserved in infarction, unless there is a profound reduction in CPP, where it has been postulated that microvascular collapse due to inability of the vessels to remain patent may eventually result in a reduction in CBV.10 Following recanalisation of the occluded vessel, either spontaneously (33% within 48 h)11 or following treatment, the ischaemic region becomes reperfused. This will occur with both viable and non-viable tissue.12 Indeed, a state of ‘post-ischaemic hyperperfusion’ ensues where persistently vasodilated vessels result in an elevated CBV.13 CBF is also elevated. Following a thromboembolic cerebral arterial occlusion, the decline in regional CBF in the affected brain parenchyma is not uniform. The accepted model, validated in animals and humans, is centred upon an infarct core with very low CBF and cell depolarisation. A peripheral zone—the penumbra—has moderately diminished CBF, resulting in loss of electrical function but preserved cell integrity. The duration of ischaemia in the penumbra is critical, and strategies to recanalise the vessel and restore normal CBF are likely to convey the greatest benefit here. Failure or, more crucially, a delay in achieving this, however, may lead to progression to infarction, especially as this tissue is poorly autoregulated and more vulnerable. Surrounding the penumbra is a zone of benign oligaemia. Here CBF is only mildly impaired and tissue is likely to survive. The most commonly used classification system of ischaemic stroke (TOAST)14 discriminates between large vessel thromboembolic, cardioembolic, small vessel and ‘other’ aetiologies. Precise allocation into these subtypes is sometimes difficult and strokes are not infrequently undetermined. A few points to consider are: • Small peripheral infarcts in a vascular territory are usually embolic but the source is not always clear (i.e. cardiac vs carotid vs MCA) (Fig. 62-1). • The basilar artery supplies the posterior cerebral arteries (PCAs) unless the posterior communicating artery(s) is/are large, in which case emboli from the carotid circulation may enter their territory. Brainstem infarcts are commonly result from occlusion of short perforating vessels. A combination of infratentorial, thalamic and occipital infarcts suggests an occlusion of distal basilar artery, or ‘top of the basilar’ syndrome (Fig. 62-2).15 Also known as watershed ischaemia, this occurs at the boundaries of the major vessel territories—superficially between the leptomeningeal collaterals of the MCA and ACA which also extend into the corona radiata deep to the superior frontal sulcus, and those of the MCA and PCA. In the deep white matter of the inferior corona radiata and external capsules lies the deep borderzone between the cortical branches and deep M1 perforators of the MCA (Fig. 62-3). Postulated mechanisms include local (e.g. carotid stenosis) and global (e.g. cardiac insufficiency) hypoperfusion, but embolic infarcts at these sites can also occur. Borderzone ischaemia in the posterior fossa is uncommon but usually occurs between the superior cerebellar artery (SCA) and posterior inferior cerebellar artery (PICA) territories, and occasionally between the SCA, PICA and anterior inferior cerebellar artery (AICA) territories. Inadequate oxygen supply to the entire brain can be the consequence of severe hypotension or impaired blood oxygenation. Global hypoperfusion can result in watershed infarcts as described above, but profound hypoxia can also cause symmetric ischaemia in the basal ganglia, thalami and hippocampal formations. Anoxia due to defective blood oxygenation such as in carbon monoxide poisoning tends to cause infarcts in sensitive regions, typically, as in this case within the globus pallidus (Fig. 62-4). Brain imaging must be incorporated into the management paradigm of acute stroke. Currently, the only licensed therapy for vessel recanalisation in the acute period involves the administration of intravenous thrombolytic agents—mainly tissue plasminogen activator (tPA). This was derived from key studies (NINDS, ECASS-3 and SITS-MOST)16–18 which demonstrated significant improvements in the degree of disability at 3 months in patients with ischaemic stroke treated with iv tPA provided they were within 4.5 h of onset, had sustained infarcts of less than one-third of the MCA territory and were less than 80 years old. Traditionally, imaging has been directed at these criteria, employing non-enhanced cranial computed tomography (NECT). Within the past 3 years in the UK following government-initiated restructuring of metropolitan stroke services and considerable investment, thrombolysis rates have risen dramatically from <1% to around 15% in most major hyperacute stroke units (HASUs)—with improvements in outcomes already becoming apparent.19 In most of these centres, NECT continues to form the mainstay of acute stroke imaging. • To exclude haemorrhage and allow administration of aspirin therapy20 • To exclude an alternative cause of the fixed neurological deficit. Around 30% of patients presenting with a stroke-like episode have a non-vascular cause21 • To exclude infarcts > 1/3 MCA territory A dense artery is the earliest detectable change on computed tomography (CT). As it is caused by fresh thrombus occluding the vessel it can be seen at the onset of the ictus. Thrombus may rapidly disperse, so this sign is not always present. When found in the proximal MCA or terminal ICA, it correlates with large infarcts and very poor outcomes22 although it has a better prognosis if limited to an MCA branch within the sylvian fissure (the sylvian fissure ‘dot’ sign) (Fig. 62-5).23 MCA calcification can mimic this sign but is often bilateral. The basilar artery may also appear dense in the case of posterior circulation infarcts, particularly the ‘top of basilar’ syndrome. The early parenchymal signs on CT are reduced grey matter density and brain swelling, manifest as effacement of sulci (Fig. 62-6). These changes are traditionally thought to reflect cytotoxic oedema, which reduces the Hounsfield number of grey matter so it is indistinguishable from adjacent white matter. In early MCA infarcts this causes a reduction in clarity of the margins of the lentiform nucleus and cortex, particularly in the insula. Hypodensity on early CT examinations affecting more than 50% of the MCA territory is associated with a high mortality rate,24 and intravenous thrombolysis is contraindicated when more than one-third of the MCA territory is involved. However, infarct size evaluation is notoriously difficult in the acute phase, due to the lack of convincing parenchymal changes in 50–60% of NECT within 2 h. The sensitivity of CT for infarcts has been reported to be only 30% at 3 h25 and 60% at 24 h. These difficulties have led to the development of the Alberta Stroke Program Early CT Score (ASPECTS).26 ASPECTS can be used to predict outcome and risk of post-thrombolysis haemorrhage. It correlates well with diffusion weighted imaging (DWI) findings at presentation27 and facilitates more accurate interpretation of emergency CT by nonexperts.28 Even in patients not suitable for thrombolysis it seems intuitive that a methodical approach such as ASPECTS is likely to increase accuracy and reliability of CT interpretation, at least for supratentorial events (Fig. 62-7). The sensitivity to subtle grey matter low attenuation is enhanced using the ‘stroke window’ setting when reviewing images (window width = 35/window level = 35). • Ten regions are identified (four deep and six cortical) • Starting with a score of 10, 1 point is deducted for each of these areas that is involved. • If the score is <7, the infarct is considered >1/3 of an MCA territory The key advantages of NECT are that it is very rapid, accessible, simple and safe. Speed is essential as the therapeutic window is closing all the time. On magnetic resonance imaging (MRI), thrombus may cause loss of a normal arterial flow void. However, arterial high signal may be seen in a patent vessel on fluid-attenuated inversion recovery (FLAIR) MRI due to altered flow, a useful qualitative sign of reduced perfusion when the parenchyma usually still appears normal.29 Intravascular enhancement due to sluggish flow in affected vessels—probably veins—may be seen on contrast-enhanced CT and MRI acutely.30 Parenchymal MRI changes include cortical swelling and T1/T2 prolongation, more obvious on T2 sequences, particularly FLAIR. Parenchymal hyperintensity is often absent or very subtle in infarcts prior to 3 h,31,32 suggesting that early parenchymal low density on CT may be due to abnormal perfusion (reduced CBV) rather than oedema.33 Furthermore, brain swelling on CT without accompanying low density does not always progress to infarction. Such cases may also be due to abnormal perfusion, but a compensatory increase in CBV rather than a reduction.34 Thus, whilst it is generally accepted that swelling with obvious low density on CT is an indication of infarction, perhaps subtle low density or swelling without low density are sometimes signs of compromised perfusion that may be reversible, particularly the latter. Diffusion-weighted imaging (DWI) has a pre-eminent role in acute stroke imaging due to its extremely high sensitivity and specificity,35 with parenchymal hyperintensity as early as 5 min following the onset of infarction. DWI should be interpreted in conjunction with an apparent diffusion coefficient (ADC) map, which is derived from the DWI data and in the clinical environment is displayed as a grey scale ‘image’ for ease of use. ‘Restricted diffusion’ in acute infarcts returns high signal on DWI and appears dark on the ADC map (Figs. 62-8 and 62-9). Whilst DWI hyperintense areas (with appropriate ADC hypointensity) are considered to and almost always do represent areas of irreversible ischaemia, recently investigators have reported that following early recanalisation with either intravenous agents or mechanical embolectomy, DWI-positive areas may not progress to infarction. This phenomenon does not occur commonly and the proportion of the overall insult which appears to reverse is relatively small. Moreover, the effect is reduced in tissue with more profoundly reduced ADC. Nevertheless it does suggest that DWI-defined early ischemic injury physiologically represents the combination of irreversible ischemic core and a small potentially reversible surrounding area (Fig. 62-10).36–38 Whilst NECT has a much higher sensitivity than spin-echo MRI for the detection of acute haemorrhage, T2*-weighted gradient-echo imaging (GRE) has equivalent or superior sensitivity compared with CT.39–41 The sensitivity for detection of deoxygenated haemoglobin—the key moiety in acute haemorrhage—is further enhanced with the susceptibility-weighted imaging (SWI) sequence.42 The availability of neuroradiological expertise, multislice CT technology and improved access to MRI in some, typically neuroscience, units allows the delivery of advanced imaging techniques. These include ‘penumbral imaging’ which attempts to establish the relationship of the irreversible core infarct with any potentially salvageable but ischaemic penumbra; angiographic imaging to identify the site of vascular compromise and additional techniques such as permeability imaging and SWI. In the setting of hyperacute stroke, the challenge is to deliver this information rapidly. • To more accurately delineate the size of the core infarct • To establish whether a penumbra of salvageable tissue is present • To evaluate the size and severity of ischaemia of the penumbra The following should be considered in this analysis: • Large core infarcts have a poorer outcome, regardless of penumbra size or severity. Specifically, core volumes greater than 70 mL are associated with adverse outcomes regardless of recanalisation therapy.43 • Large areas of salvageable tissue, known as ‘mismatch,’ are likely to benefit most from recanalisation therapy.44–46 • Areas of mildly ischaemic penumbra may reperfuse spontaneously—known as ‘benign oligaemia’. • Appropriate patient selection using penumbral imaging may extend the therapeutic time window beyond 4.5 h.47–49 In the context of stroke, perfusion imaging with CT (CTP) and perfusion weighted MRI (PWI) is most often performed using a first-pass intravenous contrast technique. In PWI, this is achieved using dynamic susceptibility contrast enhancement (DSE-MRI), which relies on the long-range susceptibility effects of gadolinium resulting in a reduction in signal intensity as it transits through brain tissue. By mathematical deconvolution of the time-density (CT) or time-negative signal intensity (MRI) curves which are generated, 3 parameters are usually studied: • relative cerebral blood volume (rCBV)—essentially the area under the curve • relative cerebral blood flow (rCBF)—related to the gradient of the curve at contrast arrival • mean transit time (MTT)—calculated from the Central Volume Principle: MTT = CBV/CBF These are typically depicted as colour maps. However, there is considerable debate in the literature as to which of the parameters is the most reliable surrogate marker of core and of penumbra. Earlier studies employed first-generation perfusion scanning protocols with shorter acquisition times of 40–50 s which resulted in potential underestimation of both CBV and MTT due to failure to image the whole of the time–density or time signal–intensity curves, Furthermore, standard post-processing algorithms with no correction for the delay in contrast arrival—such as due to a stenosis or haemodynamic instability—exposed the interpretation to underestimation of CBF and overestimation of MTT.50–54 Whilst new protocols allow for longer acquisition times (60–70 s), and many of the latest-generation post-processing platforms now correct for delay, there is still considerable variability and lack of standardisation in the parameters generated from scanning machines and platforms (or even different versions of the same platform) from different vendors.55–59 This is particularly true with CT perfusion. Recent reports suggest that newer techniques do allow more accurate and reliable characterisation of the core and penumbra on imaging.60–62 These are given in Table 62-1. TABLE 62-1 Thresholds for Determining Infarct Core and Penumbra With CT and MR Perfusion Imaging As alluded to earlier, the size of the infarct core is the single most important imaging parameter in determining whether recanalisation therapy would be appropriate. Whilst fluorodeoxyglucose (FDG) positron emission tomography (PET) is considered the most accurate, it is clearly not the most practical for clinical use. In descending order, DWI, thresholded CT-CBF, CT-CBV (both from CT perfusion) and CTA-source data are more sensitive and precise than NECT.63 Unfortunately, for CT perfusion, the threshold at which the CBF should be set to establish the core varies between platforms but is generally 70–85% reduction compared with the normal contralateral side.61 It remains unclear as to why perfusion imaging derived CBV approximates to the DWI-defined core, when experimentally, CBV rarely falls in an infarct. Additionally, a volume of tissue which has infarcted but then becomes rapidly reperfused may become masked and appear normal on CBV.64 Delay-corrected MTT is considered the most reliable biomarker of the penumbra in CT perfusion when appropriately thresholded, at 150% relative to the contralateral normal side.62 This threshold discriminates between the genuinely ‘at-risk’ tissue and the region of benign oligaemia. Simultaneous evaluation of CBF should corroborate this as CBF will generally be preserved or only mildly reduced in benign oligaemia, but more significantly diminished in at-risk tissue (Fig. 62-11). Tmax is an additional parameter generated by perfusion imaging—at the time of the CBF calculation—and has been used as a penumbra biomarker.48 Mismatch is usually accepted as the volume of penumbra, being at least 20% larger than the core. Improvements in endovascular device design and the availability of fast, non-invasive angiographic techniques to rapidly identify the site of the occluded vessel are driving a revolution towards intra-arterial thrombolysis and probably, more effectively, endovascular mechanical embolectomy in acute stroke treatment. In comparison with iv tPA therapy, these strategies are not only more successful in recanalising occluded cerebral vessels65–67 but also are likely to deliver more favourable outcomes in the treatment of strokes from occluded major vessels such as the distal ICA and proximal MCA, and may well prolong the therapeutic window significantly beyond 4.5 h in selected patients. Furthermore, endovascular procedures to recanalise an occluded basilar artery are considered appropriate even up to 18 h. In addition, mechanical embolectomy can be employed when there is a contraindication to tPA, most notably anticoagulant therapy and recent surgery. In the US, the MERCITM device has been approved for use up to 8 h post onset.66 Current technology primarily involves a stent-clot retriever device. However, procedure-related complication rates are high and there is a paucity of Level 1 data demonstrating a clear overall benefit. Indeed, only one randomised controlled trial has been conducted, evaluating intra-arterial therapy—in this case intra-arterial thrombolysis. This did demonstrate a significant improvement in outcomes compared with intravenous heparin.68 In several non-randomised control trial open label trials, functional outcomes were poorer than with iv tPA. Longer times to recanalisation (relating to anaesthesia, endovascular access and device deployment) and the selection bias of more severe strokes likely account for much of this.69 Nevertheless these techniques are set to become a more common therapeutic option for strokes where the thrombus is in the distal ICA or proximal MCA, or in the basilar artery.70 Therefore, initial angiographic imaging to identify an appropriate endovascular target is a necessity. As shown above, this can be most effectively achieved using CT, as part of a multimodal examination also delivering penumbral information with CT perfusion. However, data sets are large (typically >200 slices from the aortic arch to the circle of Willis) and reviewing these can take time. By contrast, interpretation of the maximum intensity projection (MIP) images of an MRA is rapid (Figs. 62-12–62-14). Useful information regarding the extracranial neck arteries is also provided with CT angiography (CTA) or magnetic resonance angiography (MRA). In particular, possible embolic sources in the aortic arch and carotid bifurcation are well demonstrated, as are alternative aetiologies such as vessel dissection. When acquired correctly (i.e. with saline chase following the iv contrast injection), the thin-slice CT angiographic images of the head (known as the CTA-source data) approximate to relative cerebral blood volume maps. When reviewed on a 35 window width/35 window level setting (‘stroke window’), low density on the CTA-source data depicts the infarct core and correlates well with CBV maps from perfusion CT.63 The importance of perfusion to ischaemic brain tissue via an alternate route is becoming increasingly recognised. This ‘collateral’ flow—chiefly via leptomeningeal vessels—if adequate is likely to sustain ischaemic tissue for hours or even days after a vessel occlusion. In these areas, CBF and CBV are likely to be preserved whilst the MTT is prolonged. Improved collateral supply is associated with milder deficits, smaller final infarcts and improved outcomes after major vessel occlusions.71 Imaging the collateral supply is challenging and a number of studies have employed a variety of techniques, from catheter angiography72 to CTA,73 MRA74 and transcranial Doppler ultrasound.75 CTA is likely to be the most accessible method, as part of the multimodal approach to acute stroke imaging. Perfusion imaging, including PET, is also used for elective assessment of haemodynamic reserve and stroke risk. For example, perfusion may be normal at rest despite a significant carotid stenosis but show reduced blood flow following acetazolamide challenge, which is the reverse of normal.76,77 Single-photon emission computed tomography (SPECT) with 99mTc-HMPAO will show a perfusion defect as soon as vascular occlusion occurs, although care must be taken in interpretation of HMPAO SPECT studies 10 days or more after the onset of stroke due to hyperfixation of the radiopharmaceutical in infarcted tissue.78 Quantification of the degree of ischaemia using HMPAO SPECT will predict risk of intracranial haemorrhage following intra-arterial thrombolysis79 but there is currently no practical use for isotope studies in the acute setting. In addition to the increased sensitivity for acute haemorrhage, SWI also depicts the acutely thrombosed segment of a major intracranial vessel as a prominent, markedly hypointense, expanded, serpiginous structure due to the exaggerated ‘blooming’ effect.42 Furthermore, early studies suggest that the ischaemic but potentially salvageable brain tissue may be shown on SWI as tissue with prominent hypointense parenchymal and pial vessels due to engorgement of veins with deoxygenated blood (Figs. 62-15C and 62-15E).80 Permeability imaging, which provides imaging biomarkers of the integrity of the blood–brain barrier, can be performed using longer-acquisition CT perfusion or dynamic contrast-enhanced perfusion MRI (DCE-MRI), which is also a first-pass contrast-enhanced perfusion study but evaluates the T1 effects of contrast passage, as opposed to the T2* (susceptibility) effects of DSE described earlier. There is some evidence that increased permeability in infarcted/ischaemic brain tissue is predictive of subsequent haemorrhage following recanalisation therapy in both animal and human experiments.81–87 Penumbral imaging can be achieved effectively on both CT and MR platforms, using perfusion techniques. Despite the superior characterisation of the acute infarct with DWI, whole brain coverage with PWI, rapid visual assessment of vessel occlusion on MRA and at least comparable ability (to NECT) of GRE T2* or SWI to identify acute haemorrhage (Fig. 62-15), multimodal CT appears to have maintained its foothold in most UK neuroscience units. This is largely due to the near-whole head coverage of perfusion CT in machines with 128 slices or more, the rapid acquisition times, much greater access, the reliability of CT angiography (to be discussed later) and rapid more often automated post-processing. Logistical issues regarding immediate access to MRI, prolonged imaging times (not just acquisition, but safety and patient transfers) and post-processing has hampered the role of MRI—particularly evident in the poor recruitment to MRI-based multicentre stroke trials. CT perfusion techniques also appear to afford more quantitative capability than standard dynamic susceptibility MR perfusion imaging. This permits the utilisation of thresholds for cerebral blood flow and mean transit time to attempt to identify at-risk tissue as discussed earlier. However, there is variability between CT machines, processing platforms and software versions, which precludes the application of this uniformly. Arterial spin labelling MR perfusion (ASL) provides an assessment of cerebral blood flow without the need for a contrast injection.88 It is less sensitive to susceptibility and motion effects but is affected by delay phenomena (as with contrast). It is currently a specialised technique, beginning its translation from research environments into clinical practice (Table 62-2). TABLE 62-2 Multimodal Stroke Imaging Platforms NECT = non-contrast-enhanced CT; CTA = CT angiography; CTP = CT perfusion; DWI = diffusion-weighted imaging; PWI = perfusion-weighted MRI; SWI = susceptibility-weighted imaging (for acute haemorrhage); CEMRA = contrast-enhanced MRA. Multimodal CT can therefore be more easily incorporated into the management of acute stroke patients without substantial detriment to the therapeutic opportunity. The main clinical application of penumbral imaging in hyperacute stroke is for the assessment of suitability for thrombolytic therapy in: • Cases presenting 3–6 hours after onset. • Cases with an unclear time of onset, for example ‘wake-up’ strokes. That is, where the onset was whilst the patient was asleep and no precise time of onset is known. FLAIR imaging can also be helpful here. The degree of mismatch between the DWI and FLAIR hyperintensity may allow assessment of the volume of infarcted tissue within 6 hours of onset. Tissue infarcted for less than 3 hours is likely to be negative or only very subtly abnormal on FLAIR, whilst tissue infarcted for more than 4.5 h is most likely to be hyperintense on FLAIR (Fig. 62-16).31,32 • And when considering mechanical thrombectomy as a rescue therapy when iv treatment has failed. In the subacute phase there is structural breakdown and blood–brain barrier disruption. Fluid leaks into the extracellular space, causing well-demarcated low attenuation on CT and T2 hyperintensity on MRI that involves both grey and white matter in large infarcts. The severity and duration of brain swelling depends on infarct size. It usually increases during the first week, persists during the second week and then regresses. Other diagnoses such as tumour or infection should be considered if there is extensive white matter oedema without cortical involvement or prolonged brain swelling. Contrast enhancement on CT and MR due to blood–brain barrier disruption is common in the subacute stage; indeed on MRI it occurs in almost all cases by the end of the first week89 and persists for several months. The pattern is variable and therefore not always specific; however, gyriform enhancement, if present, is most characteristic of a cortical infarct (Fig. 62-17F). Lack of enhancement of large cortical lesions on MRI suggests alternative diagnoses such as low-grade glioma. Haemorrhagic transformation due to secondary bleeding into reperfused ischaemic tissue occurs during the first 2 weeks. It is shown in up to 80% of infarcts on MRI,90 appearing hyperintense on T1 and hypointense on T2 images, and particularly GRE and SWI images (Fig. 62-18). It is often seen in the basal ganglia and cortex, where it can assume a gyriform pattern. The occurrence and severity of haemorrhagic transformation correlates with the size of the infarct and degree of contrast enhancement in the early stage91 and its risk is also increased with cardioembolic infarcts, and in the setting of diabetes and thrombolysis treatment. It is worth noting that gyriform cortical T1 shortening (hyperintensity) in the subacute and indeed chronic phases more often represents cortical laminar necrosis—due to the migration and congregation of lipid-laden macrophages—than haemorrhagic transformation. Furthermore, this effect is also observed following other cortical insults such as encephalitis. Chronically, encephalomalacia and volume loss develop, causing enlargement of adjacent sulci and ventricles. The density on CT and signal intensity on MRI, including FLAIR, approaches that of CSF (Fig. 62-17). Occasionally, and mostly in children, this enecephalomalacia may be cystic in nature, acquiring paradoxical mass effect. Wallerian degeneration is sometimes visible as faint T2 hyperintensity in the ipsilateral corticospinal tract with related asymmetrical brainstem atrophy. With large middle cerebellar artery infarcts, contralateral cerebellar volume loss is also occasionally observed. Rarely, dystrophic calcification occurs in the very late phase. On DWI, normalisation of the DWI and ADC signal occurs within 5–10 days (‘pseudonormalisation’) during which small infarcts can be masked. Larger lesions will still be obvious on structural images. Prolonged restriction of diffusion in small white matter infarcts lasting several weeks has been reported, the explanation for which is not entirely clear.92 Beyond this period, loss of structural integrity results in increased water mobility and the imaging appearance reverses to low signal on DWI and bright on the ADC map.93,94 This state is described as ‘free diffusion’ (Fig. 62-19). In mature infarcts, tissue with very long T2 relaxation times (markedly T2 hyperintense) may appear as high signal on DWI due to T2 effects dominating the signal—the so-called ‘T2 shine through’ effect. Such areas are easily distinguished from genuinely acutely infarcted tissue as they will also be hyperintense on the ADC map. Another potential pitfall of DWI is acute haemorrhage, which can return a high signal resembling an infarct. However, there is often also a low signal margin produced by susceptibility effects.95 Analysis of other sequences should indicate the correct diagnosis.
Neurovascular Diseases
Stroke
Pathophysiology
The Penumbra Model
Stroke Classification
Causes
Large Vessel Thromboembolic Stroke (40%)
Small Vessel or Lacunar Stroke (15–30%)
Borderzone Infarction
Global Hypoxic–Ischaemic Injury
Imaging Strategies and Goals in Acute Stroke
Standard Imaging
Objectives of NECT in Acute Stroke
Hyperacute Infarct Imaging Signs
ASPECTS Infarct Size Scoring System
Advanced Imaging
Objectives of Penumbral Imaging
Perfusion Imaging.
CTP
PWI-MRI
Infarct core
Thresholded CBF (nominally better than CBV)
DWI
Ischaemic penumbra
Thresholded MTT (probably better than CBF)
Thresholded MTT and CBF
Angiographic Imaging.
Assessment of Collateral Flow.
Additional Advanced Imaging Techniques.
CT or MRI?
CT
MRI
Multimodal technique
NECT + CTA + CTP
DWI + PWI + SWI + FLAIR + T1W + CEMRA
Times
Acquisition
3–5 min
11–13 min
Total imaging time
8–12 min
20–40 min
Post-processing
5 min
5–10 min
Total
13–17 min
25–50 min
Subacute and Chronic Infarct Imaging Signs
Related posts:
![]()
Stay updated, free articles. Join our Telegram channel

Full access? Get Clinical Tree


Neurovascular Diseases
Chapter 62
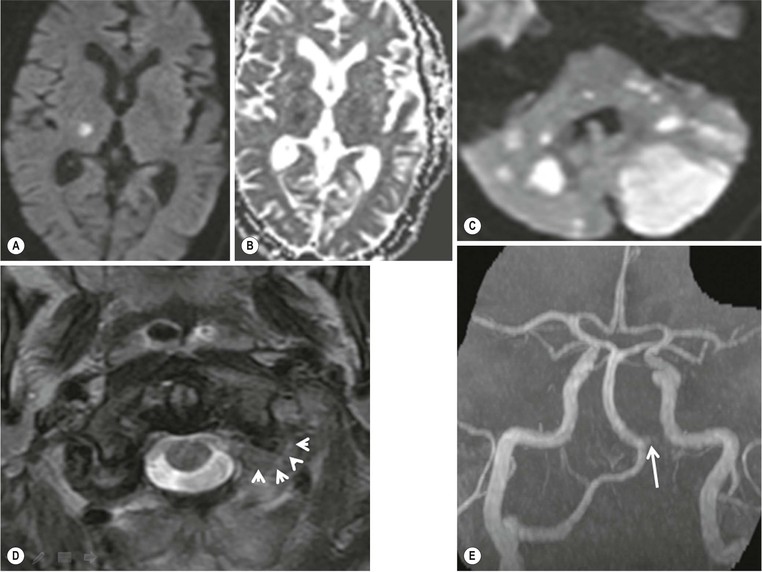
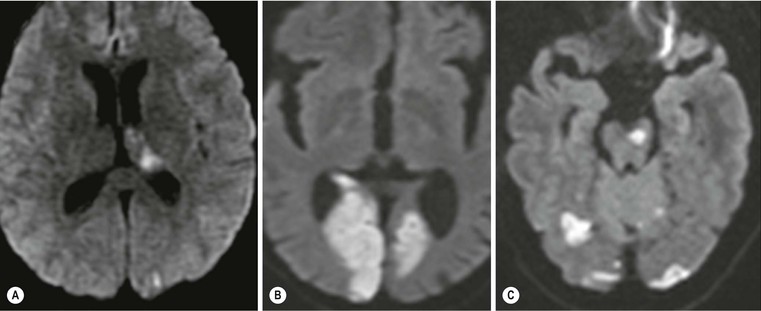
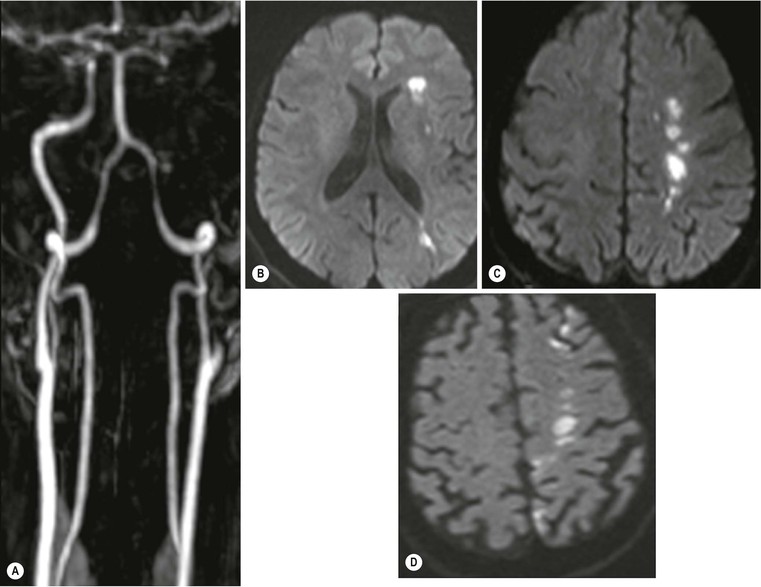
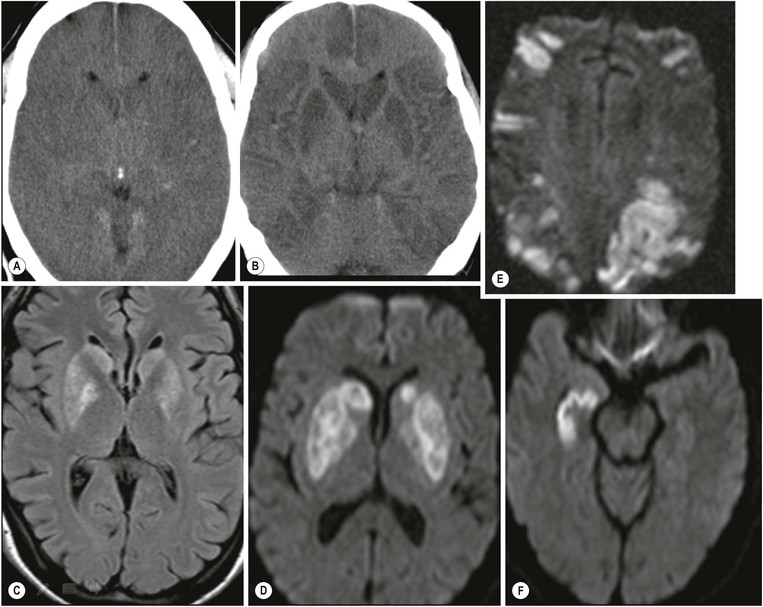
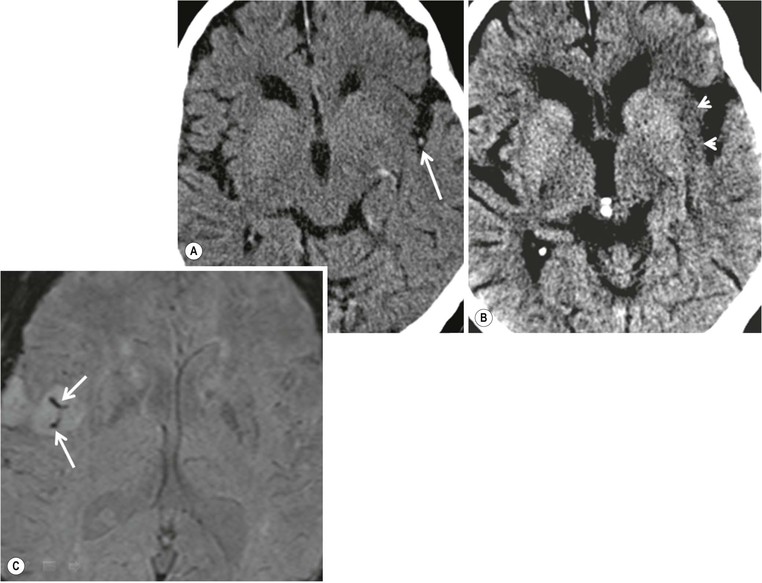
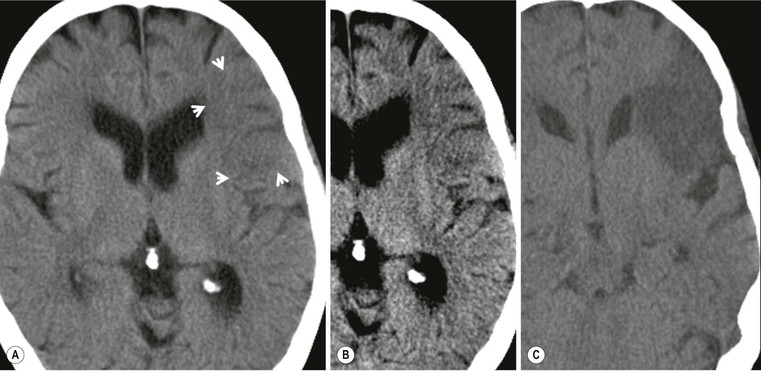
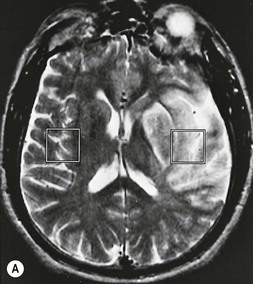
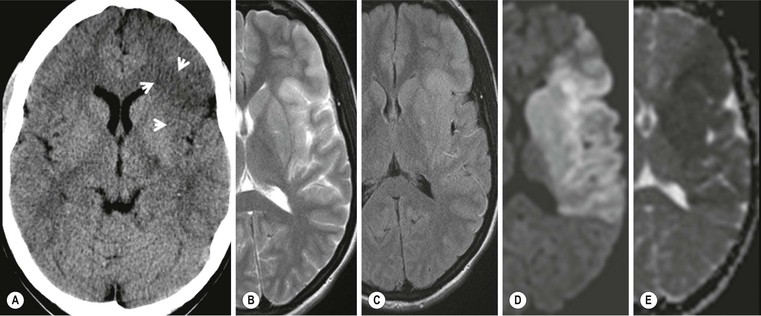
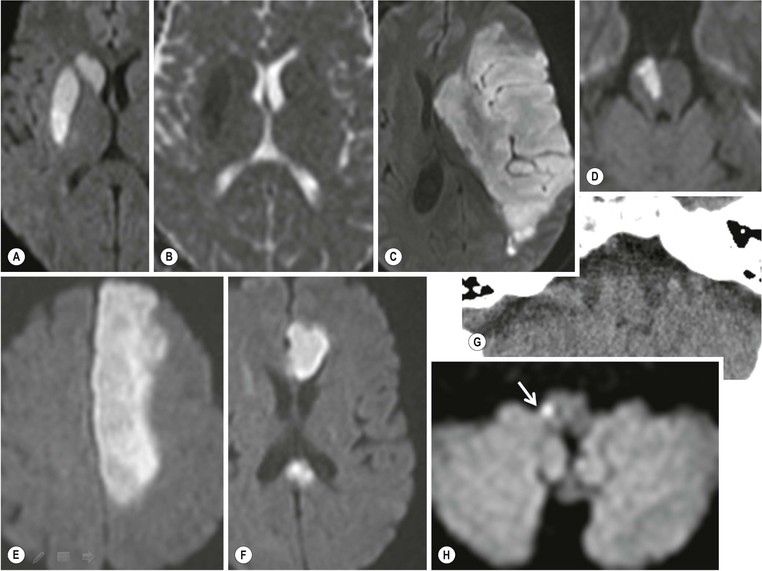
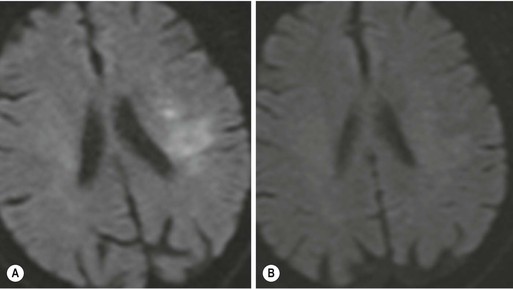
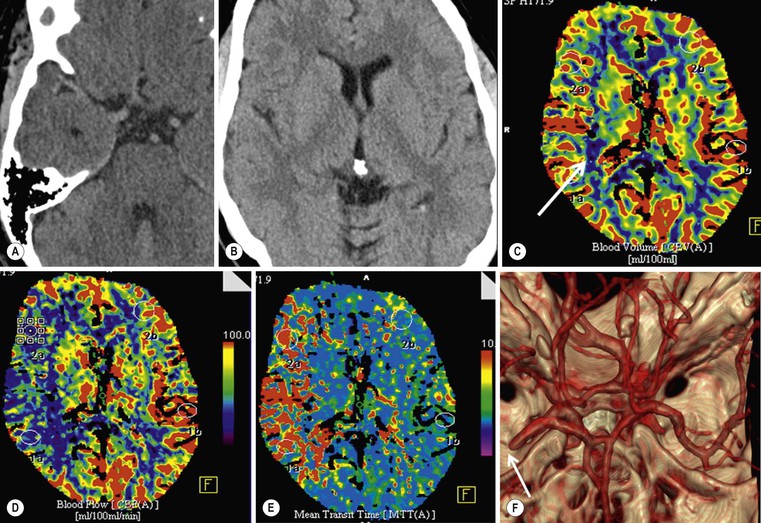
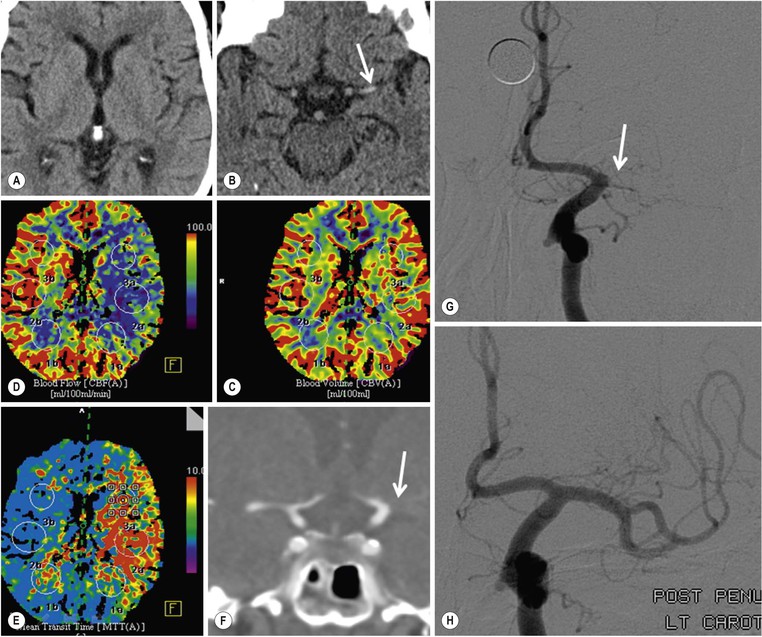
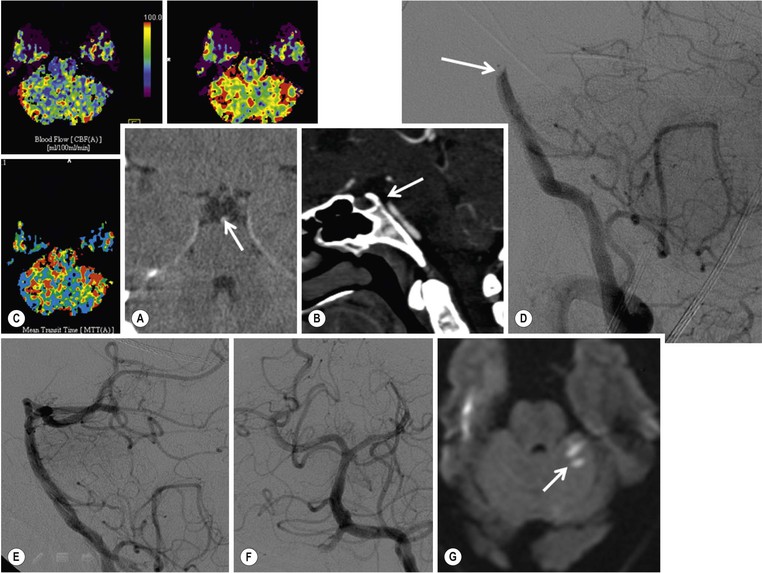
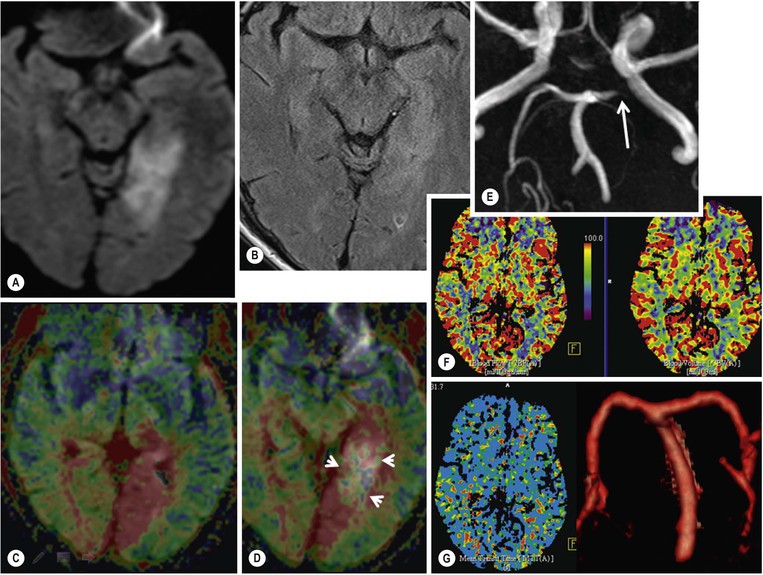
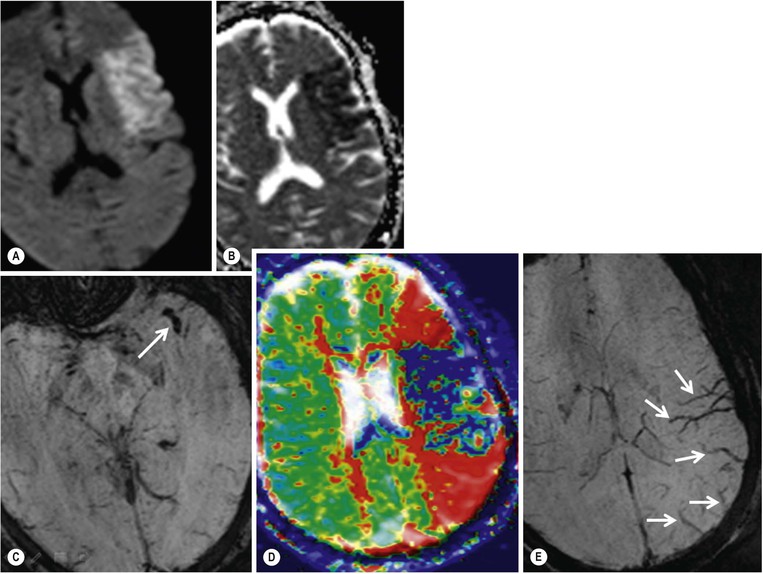
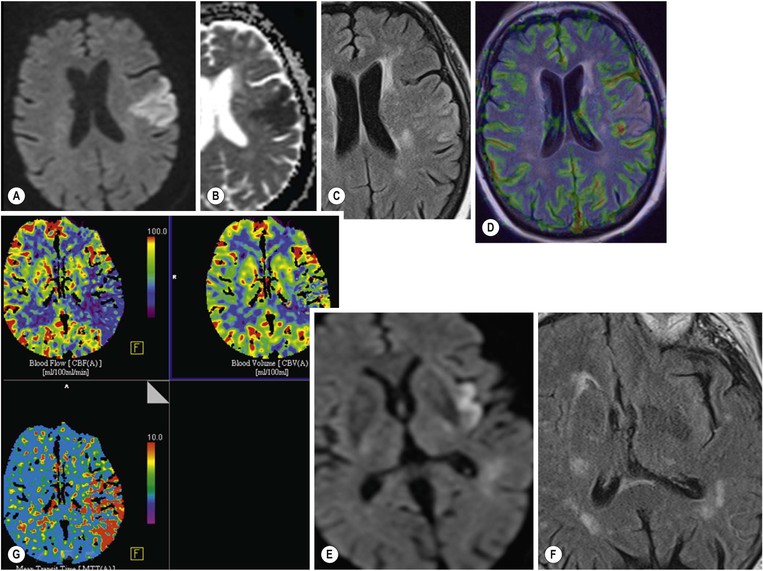
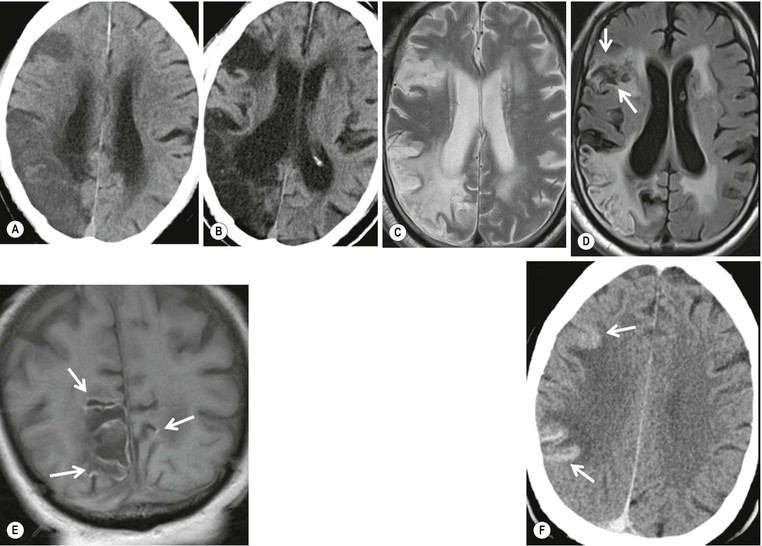
FIGURE 62-19