![]() To understand the principles that govern blood flow in the arterial and venous systems.
To understand the principles that govern blood flow in the arterial and venous systems.
![]() To recognize high-resistance and low-resistance flow patterns.
To recognize high-resistance and low-resistance flow patterns.
![]() To understand the significance of altered resistance patterns in arteries.
To understand the significance of altered resistance patterns in arteries.
![]() To comprehend the factors that influence venous blood flow and characteristics of normal venous waveforms.
To comprehend the factors that influence venous blood flow and characteristics of normal venous waveforms.
![]() To recognize venous waveforms that do not exhibit normal flow patterns.
To recognize venous waveforms that do not exhibit normal flow patterns.
KEY TERMS
Blunted velocity profile
Conduit vessel
Laminar flow
Parabolic velocity profile
Resistance vessel
Transmural pressure
Static filling pressure
CHARACTERISTICS OF BLOOD FLOW IN NORMAL ARTERIES
Flowing blood obeys the same principles of flow as do all fluids. Blood travels through arteries in a series of layers, a pattern known as laminar flow. The outermost layer of blood, adjacent to the vessel wall, moves very slowly due to friction with the wall itself. Subsequent layers increase in velocity, until flow in the center of the vessel is at the highest velocity (assuming the vessel is relatively straight and uniform in diameter). Laminar flow is the most energy-efficient manner in which the blood may flow through the vessel. The pattern of gradually increasing velocity from the vessel wall to the center of the lumen is described as a parabolic velocity profile (Figures 6-1 A and B). Most arteries in the body deviate somewhat from the parabolic velocity profile due to the pulsatile nature of the flow and the relatively short length of vessels. This disparity results in a more “flattened velocity profile” or blunted velocity profile in which a large core of the central layers flows at nearly the same velocity. Thus, this flow pattern is known as “plug flow” (Figure 6-2).
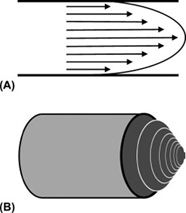
FIGURE 6-1. (A) Parabolic velocity profile. (B) 3D drawing of the parabolic velocity profile.
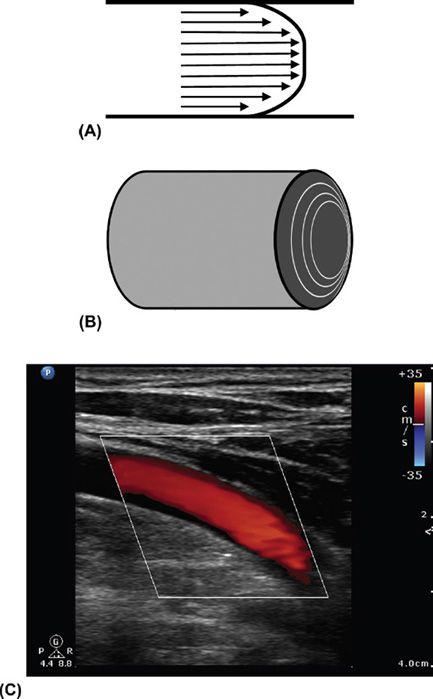
FIGURE 6-2. (A) Flattened velocity profile or plug flow. (B) 3D drawing of the plug flow. (C) Color flow image demonstrating the flattened velocity profile. Note the darker shades of red near the vessel walls denoting lower velocities and brighter shades toward the center of the vessel.
Flow through a tube (in this case, a vessel) is quantified by Poiseuille’s equation (Figure 6-3), which expresses the volume of fluid (blood) flow as proportional to the pressure differential across the tube “p1-p2” and the radius “r” of the tube to the fourth power, as well as inversely proportional to the viscosity “n” of the fluid and the tube length “L.” For practical purposes, in the human body, blood vessels can be considered “short” tubes (in contrast to a 50-ft pipe, for example). Therefore, differences in vessel lengths have minimal effect on the volume of blood flow. The same can be said for viscosity, as the body temperature and hematocrit are relatively constant in an individual human being, and do not greatly vary from individual to individual.
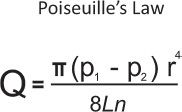
FIGURE 6-3. Poiseuille’s equation.
From a hemodynamic consideration, vessels in the body fall into one of two categories. Conduit vessels are the larger vessels that carry the blood toward its destination and resistance vessels make up the microcirculation in tissues. Resistance vessels have the ability, through hormonal regulation of the vessel diameter, to increase and decrease resistance to flow to an organ or tissue. Thus, the flow patterns within normal conduit vessels have little to do with the vessels themselves, but instead depend on the state of the downstream resistance vessels. Flow through a normal conduit vessel, then, is determined by the pressure generated proximal to the vessel by the heart and the pressure/resistance to flow of the downstream resistance vessels. (Gravity and hydrostatic pressure also play a role).
This pressure relationship is represented in Poiseuille’s equation as “p1-p2.” Changes in either the action of the heart (p1) or in the downstream resistance vessels (p2) affect the flow patterns through the conduit vessel. The vessels that are examined sono-graphically such as carotid, femoral, hepatic, renal, and mesenteric arteries are all conduit vessels in function. When evaluating flow through one of these vessels with a Doppler instrument, knowledge of flow patterns associated with both normal and abnormal conditions is essential.
LOW-RESISTANCE WAVEFORMS
A Doppler sample obtained within a vessel such as the internal carotid or the renal artery has a waveform that indicates low downstream resistance. A low-resistance waveform exhibits forward flow in both systole and diastole (Figure 6-4).
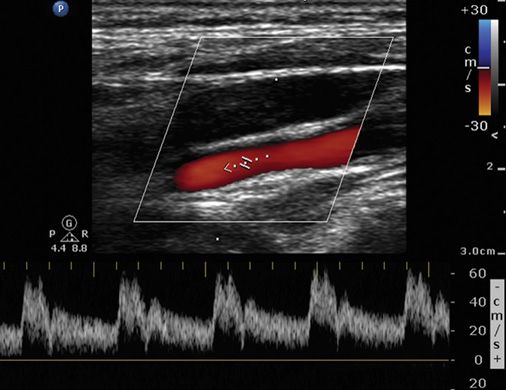
FIGURE 6-4. A low-resistance waveform with forward flow in both systole and diastole.
In a normal state, the microcirculation within most soft-tissue organs should maintain continuous low resistance to flow and therefore, the conduit arteries supplying these organs should always exhibit a low-resistance waveform. A decrease or absence of diastolic flow in the internal carotid, renal, or hepatic arteries indicates either an abnormal state in the organ such as a cerebral infarct, renal failure, or cirrhosis, or a mechanical obstruction within the vessel itself. Further Doppler evaluation of the vessel and the organ where possible should indicate which of the two possible etiologies is the correct one.
HIGH-RESISTANCE WAVEFORMS
Related posts:


Stay updated, free articles. Join our Telegram channel

Full access? Get Clinical Tree


