Radiography
Technique
Projections
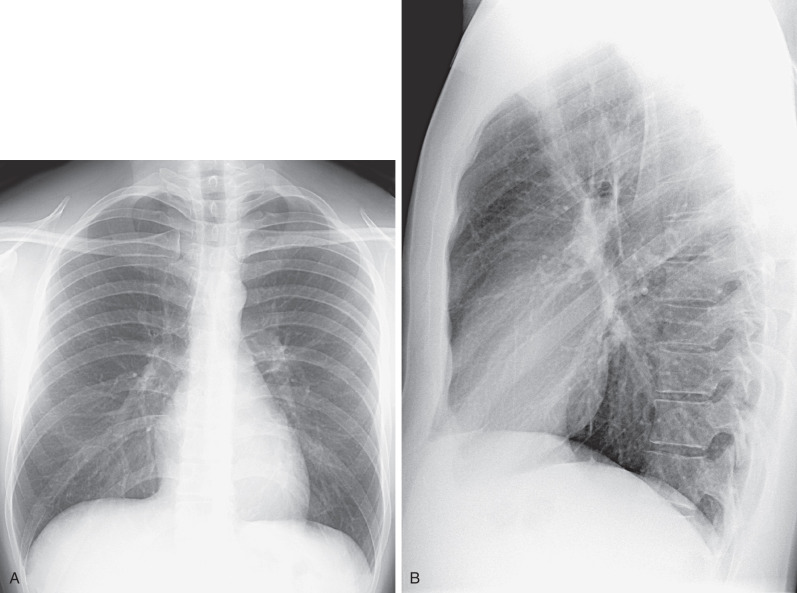
The standard radiographic views for evaluation of the chest are the posteroanterior (PA) and lateral projections with the patient standing; such projections provide the essential requirement for proper three-dimensional (3D) assessment ( Fig. 1.1 ). In patients who are unable to stand, anteroposterior (AP) upright or supine projections offer alternative but considerably less satisfactory views. The AP projection is of inferior quality because of the shorter focal-detector distance, the greater magnification of the heart, and the restricted ability of many such patients to suspend respiration or achieve full inspiration.
Basic Radiographic Techniques
Diagnostic accuracy in thoracic pathology is related partly to the quality of the radiographic images themselves, and multiple variables require attention.
Patient Positioning and Respiration
Images are ideally acquired at full inspiration to avoid magnification of the cardiomediastinal silhouette and vascular crowding, which decrease diagnostic capability.
A well-centered x-ray beam, lack of rotation, and exclusion of the scapulae from the field of view are essential for adequate positioning. The distance between the medial ends of the clavicles (anterior structures) and the spinous processes of the thoracic vertebrae (posterior structures) are reliable landmarks to assess position. In a properly centered radiograph the medial ends of the right and left clavicles are equidistant from the spinous processes ( Fig. 1.2 ). The American College of Radiology standards for performance of standard chest radiography in adults specify the use of at least a 72-inch (1.8-m) tube-detector distance for PA radiographs and a minimum of 40 inches in portable radiographs.

Exposure
Exposure factors should be such that there is faint visualization of the thoracic spine and the intervertebral disks on the PA radiograph so that lung markings behind the heart are clearly visible.
Kilovoltage
A high-kilovoltage technique (115–150 kVp) should be used for PA and lateral chest radiographs. The high kVp allows better penetration of the mediastinum and shorter exposure times, thus minimizing cardiac motion artifacts and providing sharper outline of the pulmonary and mediastinal structures.
Image Acquisition
Conventional screen-film radiography has a number of limitations and therefore has been replaced by computed radiography (CR) and digital radiography (DR).
The process of acquisition, transmission, display, and storage of digital images has many advantages over conventional screen-film systems, and it is widely used as the primary technology in conventional radiographic studies. A potential disadvantage of CR and DR is that patients may receive unnecessarily high radiation doses, which may not be detected because they do not result in perceivable alterations in image quality. The wider latitude of digital systems allows them to be used under a much broader range of exposure conditions and makes them an ideal choice for applications in which exposure is highly variable or difficult to control, such as bedside radiography. This results in a reproducible quality and considerable decrease in the repeat rate for bedside chest radiographs when using CR, compared with screen-film radiography.
Two main types of digital systems are available commercially: systems based on photostimulable storage phosphor image receptors, known as CR, and systems based on flat-panel x-ray detectors or array of detectors that directly capture the radiographic image, known as DR.
Computed Radiography
CR (storage phosphor radiography) involves the use of a reusable photostimulable phosphor plate rather than film to record the image. Plates coated with the phosphor are loaded into special cassettes that are outwardly similar to screen-film cassettes. During exposure the receptor stores the x-ray energy and is then scanned by a laser beam, which results in the creation of visible or infrared radiation, the intensity of which corresponds to the absorbed x-ray energy. The resultant luminescence is measured and recorded digitally.
Digital Radiography
DR uses a flat-panel x-ray detector or an array of detectors to directly capture the radiographic image numerically, thus eliminating the step of reading out the detector. The detectors in DR are selenium based and provide the additional advantage of having considerably greater quantum efficiency than conventional screen-film systems and photostimulable phosphor detectors do, which results in an image quality superior to that of screen-film systems and existing storage phosphor detectors at a comparable or lower radiation dose.
Normal Anatomy of the Chest
Airways
Trachea and Bronchi
The trachea is a midline structure, and the tracheal walls are parallel except on the left side just above the bifurcation, where the aorta commonly causes a smooth indentation ( Fig. 1.3 ). The trachea measures 10 to 12 cm in length and has 16 to 20 C-shaped cartilage rings on its lateral and anterior aspects and a fibromuscular posterior margin. Calcification of the cartilage rings is a common normal finding in patients older than 40 years, particularly women, but it is seldom evident on radiographs ( Fig. 1.4 ). The upper limits of normal for coronal and sagittal diameters of the trachea in men are 25 and 27 mm, respectively; in women, they are 21 and 23 mm, respectively. The lower limit of normal for both dimensions is 13 mm in men and 10 mm in women.
The trachea divides into the left and right main bronchi at the carina, at approximately the level of the fifth thoracic vertebra. The subcarinal angle ranges widely from 35 to 90 degrees (mean, 61 degrees) ; thus routine measurement of this angle has no diagnostic value.
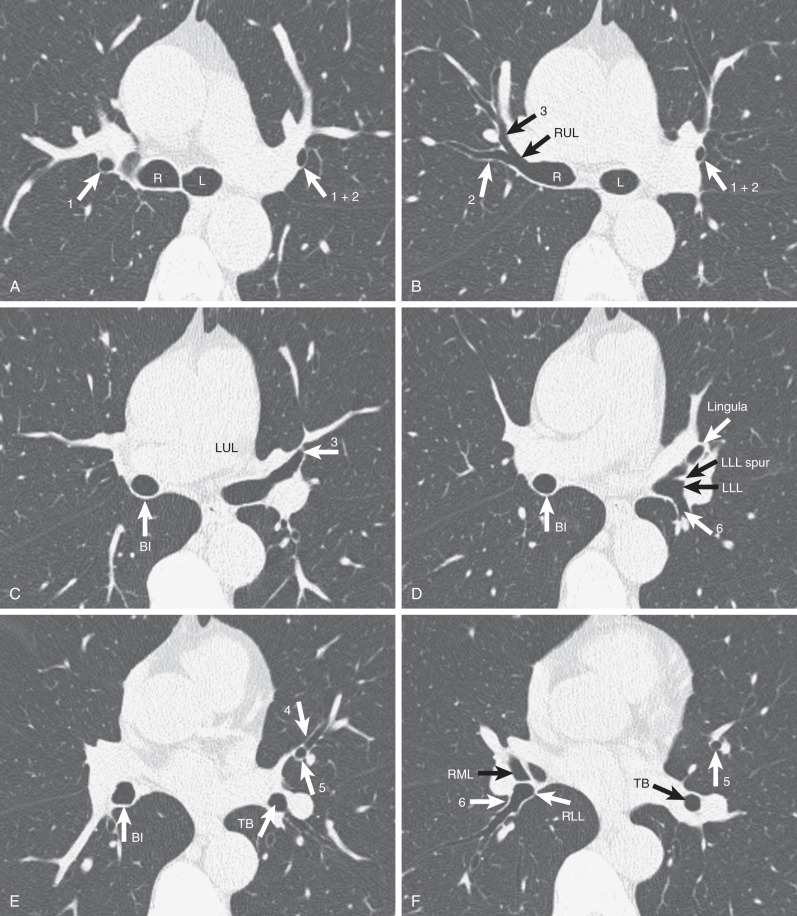
The right main bronchus measures approximately 2 cm in length and has a more vertical course than the left main bronchus does (see Fig. 1.3 ). It divides into the right upper lobe bronchus and the bronchus intermedius. The bronchus intermedius continues distally for 3 to 4 cm from the takeoff of the right upper lobe bronchus and then bifurcates into bronchi to the middle and lower lobes. The left main bronchus is approximately 5 cm in length and divides into the left upper and lower lobe bronchi.
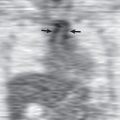
The lobar bronchi branch into segmental bronchi. Segmental bronchi are visible on chest radiographs only when they are seen end-on as ring shadows or when they are abnormally thickened. The most commonly seen segmental bronchi on a chest radiograph are the anterior segmental bronchi of the upper lobes; seen as ring shadows adjacent to the accompanying segmental pulmonary artery ( Fig. 1.5 ).
- •
Normal diameter in men is 13–27 mm.
- •
Normal diameter in women is 10–23 mm.
- •
The tracheal cartilages are C shaped and spare the posterior tracheal wall, which is membranous.
Pulmonary Arterial and Venous Circulation
Pulmonary Arteries
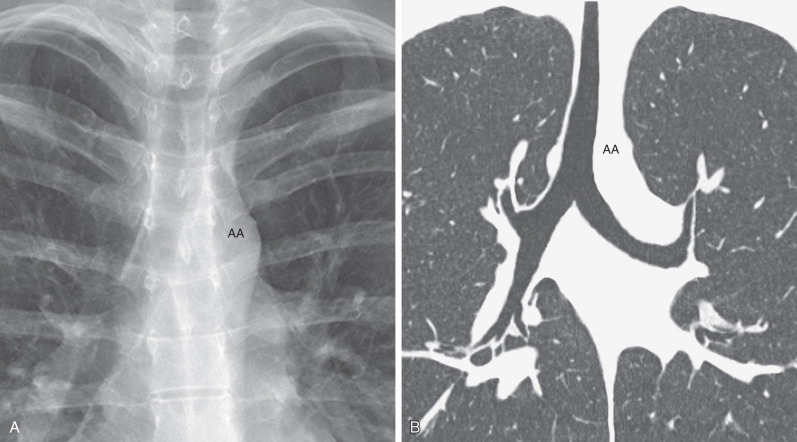
The pulmonary trunk or main pulmonary artery originates in the mediastinum at the pulmonary valve and extends cranially and slightly to the left for 4 to 5 cm before bifurcating within the pericardium into the shorter left and longer right pulmonary arteries ( Fig. 1.6 ). The left pulmonary artery continues until it reaches the hilum, where it arches over the left main bronchus and gives off the left upper lobe and interlobar arteries, from which segmental and subsegmental branches arise. The left interlobar artery lies posterolateral to the upper lobe bronchus.
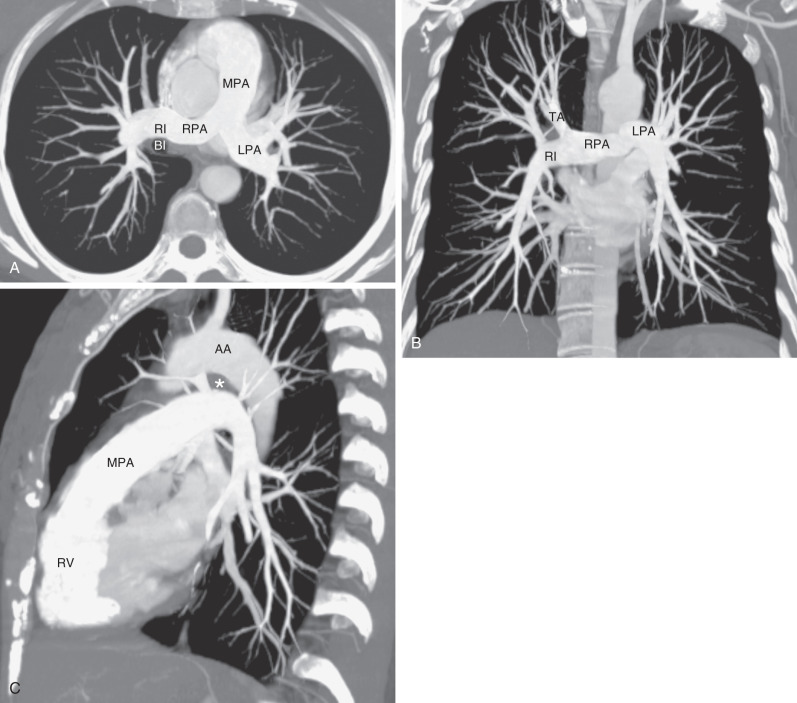
The right pulmonary artery courses behind the ascending aorta before dividing in front of the right main bronchus into ascending (truncus anterior) and descending (interlobar) branches.
Measurements of pulmonary arterial diameter can be helpful in the assessment of pulmonary vascular disease, although in conventional radiography, it is limited to the measurement of the right interlobar artery. The upper limit of normal of the transverse diameter of the right interlobar artery (measured from its lateral aspect to the air column of the bronchus intermedius) is 16 mm in men and 15 mm in women ( Fig. 1.7 ). Dilation of the interlobar pulmonary artery may result from increased pressure (e.g., pulmonary arterial hypertension), increased flow (e.g., left-to-right shunts), or aneurysm formation (e.g., Behçet disease) ( Fig. 1.8 ).
- •
The pulmonary trunk or main pulmonary artery is not normally visualized on radiography in adults.
- •
Normal diameter of the right interlobar pulmonary artery is <16 mm.
Pulmonary Veins
The pulmonary veins arise from venules that drain the alveolar capillaries and the capillary network of the pleura. In contrast to the pulmonary arteries, they are not associated with the airways. Although their final course is variable, there are usually two main superior and two main inferior vessels, the former draining the middle and upper lobes on the right and the upper lobe on the left and the latter draining the lower lobes ( Fig. 1.9 ).

Pulmonary Hila
The anatomic structures rendering the hila visible on radiographs are primarily the pulmonary arteries and veins, with lesser contributions from the bronchial walls, surrounding connective tissue, and lymph nodes ( Fig. 1.10 ).

On a PA radiograph the main shadow of the right hilum is formed by the vertically oriented interlobar artery. Right hilar structures immediately cephalad to the interlobar artery include the ascending pulmonary artery (truncus anterior) and superior pulmonary vein ( Fig. 1.11 ). The end-on opacity and radiolucency of the contiguous anterior (and occasionally posterior) segmental artery and bronchus can be identified in approximately 80% of normal individuals (see Fig. 1.5 ).

On the left the upper hilar opacity is formed by the distal left pulmonary artery, the proximal portion of the left interlobar artery and its segmental arterial branches, and the left superior pulmonary vein and its major tributaries. Because the left pulmonary artery arches over the left main and left upper lobe bronchi, the left hilum is typically 1 to 2 cm higher than the highest point of the right hilum (right interlobar artery) (see Fig. 1.10 ).
Surrounding the hilar vessels and bronchi are small amounts of fat and small lymph nodes, which cannot normally be distinguished from other structures on the radiograph. Enlargement of the hilar lymph nodes leads to increased size and opacity of the hilum, a lobulated contour, and obscuration of the interlobar artery. Hilar fullness from lymphadenopathy can be differentiated from hilar fullness from pulmonary arterial enlargement by carefully examining the adjacent hilar vessels. In lymphadenopathy the vessels will be visible through the region of hilar fullness ( Fig. 1.12 ), whereas the vessels will converge on the margins of the hilar fullness in the setting of pulmonary arterial enlargement (see Fig. 1.8 ). This finding is known as the hilar convergence sign (see Fig. 1.12 ).
The radiographic anatomy of the hila on a lateral projection is complex because the right and left hilar components are to a large degree superimposed ( Fig. 1.13 ). The trachea is usually well seen down to the level of the carina, where the air column can be seen to taper. At the level of the carina the left pulmonary artery can be seen as a curved structure as it courses above the left main bronchus and continues as the descending left pulmonary artery; consequently, the left upper lobe bronchus is seen in about 75% because it is completely surrounded by vessels (the left pulmonary artery above, the descending artery behind, and the mediastinal component of the left superior pulmonary vein in front). The air column of the normally more cephalic right upper lobe bronchus can be identified end-on as a rounded radiolucency in 50% of subjects because it is devoid of vascular envelopment on its posterior aspect such that aerated upper or lower lobe parenchyma normally abuts its wall. Consequently, clear identification of the right upper lobe bronchial lumen en face constitutes highly suggestive evidence that the airway is completely surrounded by soft tissue, most likely enlarged lymph nodes.

Below the level of the carina, a line continuous with the posterior tracheal wall represents the posterior wall of the right main and intermediate bronchi and is known as the intermediate stem line (see Fig. 1.13 ). The posterior wall of the right upper lobe and bronchus intermedius is rendered visible by air in their lumina in front and by aerated lung parenchyma in the azygoesophageal recess behind. On a well-centered lateral projection the intermediate stem line transects the middle or posterior third of the circular, radiolucent left upper lobe bronchus. The intermediate stem line is visible in 95% of individuals and normally measures 1 to 3 mm in thickness. The intermediate stem line can become abnormally thickened in patients with interstitial edema or in the presence of right hilar disease, most commonly right hilar lymphadenopathy.
On a lateral view the right hilar opacity is composed of the superior pulmonary vein anteriorly, the ascending and descending right pulmonary arteries posteriorly, and surrounding connective tissue and lymph nodes. The right pulmonary artery is a mediastinal vessel enveloped by other vessels or soft tissue elements and is therefore not seen on the lateral radiograph. The major portion of the left hilar vasculature is visible behind the intermediate stem line. The top of the left pulmonary artery is seen in 95% of subjects, usually as a sharply marginated opacity above and behind the radiolucency of the left upper lobe bronchus (see Fig. 1.13 ).
The right and left inferior pulmonary veins are commonly imaged end-on as a result of their horizontal orientation, with a nodular opacity created below and behind the lower portion of the hila. Fortunately, vessels can generally be identified as they converge toward the opacity, thereby permitting their distinction from a true parenchymal mass.
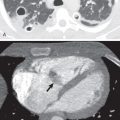
The shadows of the right hilum in front of the main bronchi and left pulmonary artery, as it courses over the left main and upper lobe bronchi, result in an inverted U appearance that delineates the radiolucent “inferior hilar window” (see Fig. 1.13 ). Normally, there are no large vessels coursing immediately below the middle and lower lobe bronchi on the right and the upper and lower lobe bronchi on the left. Therefore any rounded opacity greater than 1 cm in the inferior hilar window on a lateral view is likely to be an enlarged node or a mass ( Fig. 1.14 ).

Lung Parenchyma
Secondary Lobule
The secondary lobule is the smallest discrete portion of the lung that is surrounded by connective tissue septa. The normal secondary lobule cannot be identified on a chest radiograph. Only when the interlobular septa are rendered visible as septal lines as a result of thickening by fluid or tissue, such as edema or carcinoma, can the lung between two lines be recognized as a secondary lobule. Septal lines (Kerley lines) are identified most commonly in the anterior and lateral aspects of the lungs, where they are best developed ( Fig. 1.15 ).
Segments and Lobes
The normal anatomy of the pulmonary segments is variable, complex, and difficult to appreciate on radiographs ( Fig. 1.16 ); it can, however, be readily assessed on computed tomography (CT). An approximate location of an abnormality within a given segment can often be determined by careful analysis of its location on frontal and lateral radiographs.
Radiographic Density
The radiopacity of the lungs is a result of the absorptive power of each of its components: gas, blood, and tissue. Nonaerated lung in vivo consists of approximately half blood and half tissue,
On a properly positioned radiograph the radiographic density of the right and left lungs is symmetric. If the patient is rotated, the lung closer to the detector is more uniformly radiopaque (whiter) than the other lung; conversely, the lung that is farthest away from the detector is uniformly less radiopaque (more black). Provided that the patient is not rotated and the x-ray beam is centered properly, any discrepancy in the density of the two lungs must be interpreted as being abnormal. The cause varies from such benign conditions as scoliosis and congenital absence of the pectoral muscles to more significant disorders such as Swyer-James-McLeod syndrome.
Pulmonary Markings
Correct interpretation of the chest radiograph requires a thorough knowledge of the pattern of linear markings throughout the normal lung. These markings are created by the pulmonary arteries, bronchi, veins, and accompanying interstitial tissue. The pulmonary arteries fan outward from both hila and gradually taper as they proceed distally, up to about 1 to 2 cm from the visceral pleural surface.
The PA chest radiograph of a normal erect individual invariably shows some discrepancy in the size of the pulmonary vessels in the upper lung zones compared with the lower zones as a result of the apicobasal pressure gradient. In a recumbent individual a decrease in the influence of gravity renders this discrepancy in vascular size minimal.
Pleura
The pleural space is enclosed by the visceral pleura, which is tightly attached to the lungs, and by the parietal pleura, which lines the chest wall, diaphragm, and mediastinum. The two join at the hila. The visceral pleura consists of mesothelial cells overlying two layers of elastic tissue that separate a small amount of connective tissue and lymphatic vessels. Because the combined thickness of the normal parietal and visceral pleural layers is approximately 0.2 mm, the pleura over the convexity of the lungs and over the diaphragmatic and mediastinal surfaces is not normally visible on CR or CT. Each pleural space normally contains 8.4 ± 4.3 mL of fluid. Control of the volume and composition of pleural liquid is affected by a number of mechanisms, including Starling forces (providing filtration through the parietal and absorption through the visceral mesothelium), lymphatic drainage, and the activity of mesothelial cells. Fluid is usually produced in the parietal pleura and drained at the visceral pleura, and it tends to be drawn into the space because recoil of the lung and chest wall acts as an opposing force over most of the range of respiratory volumes.
Interlobar Fissures
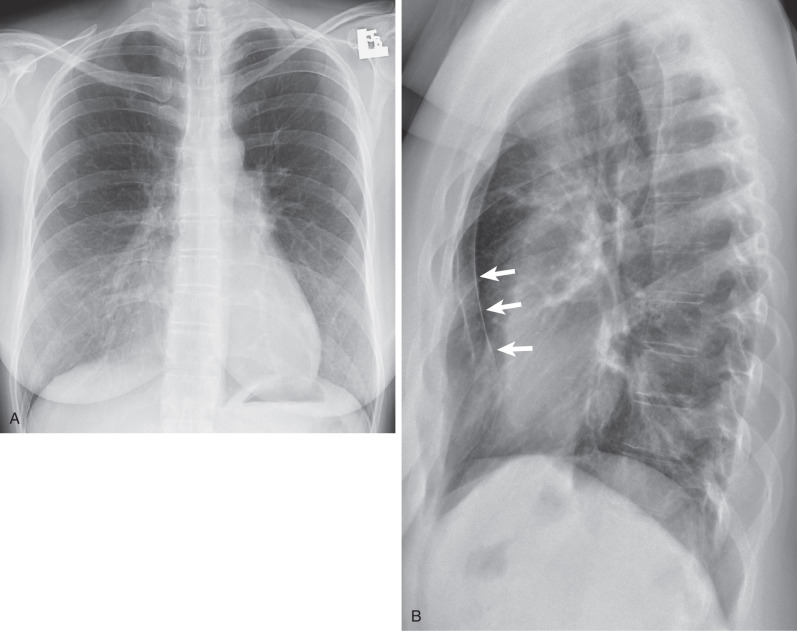
Fissures are invaginations of the pleura that extend from the outer surface of the lung into its substance. They are traditionally considered in two groups: those that separate the lungs into the three right-sided and two left-sided lobes ( normal fissures) and those that occur within one of the lobes themselves ( accessory fissures). The normal fissures are the minor fissure (located between the right middle and upper lobes), the right major fissure (between the combined right upper and middle lobes and the right lower lobe), and the left major fissure (between the left upper and lower lobes) ( Fig. 1.17 ). On a lateral chest radiograph the major fissures can be seen as lines that extend obliquely downward and forward from the level of the fifth thoracic vertebra and end at the diaphragm a few centimeters behind the anterior pleural gutter ( Fig. 1.18 ). In the majority of cases the interlobar fissures are incomplete, and the incidence of accessory fissures is variable.


Accessory Fissures
Azygos Fissure.
The azygos fissure is one of the most recognized accessory fissures, created by downward invagination of the azygos vein through the apical portion of the right upper lobe. It is manifested radiographically as a curvilinear shadow that extends obliquely across the upper portion of the right lung and terminates at a variable distance above the right hilum in a teardrop shadow caused by the azygos vein itself ( Fig. 1.19 ). Because the vein runs outside the parietal pleura, four pleural layers (two parietal and two visceral) form the fissure.

Inferior Accessory Fissure.
This fissure separates the medial basal segment from the remainder of the lower lobe. It is seen on 5% to 13% of chest radiographs, most commonly on the right, as a thin line extending from the medial aspect of the hemidiaphragm (most commonly right) obliquely cephalad and medially toward the right hilum ( Fig. 1.20 ).

Superior Accessory Fissure.
The superior accessory fissure separates the superior segment from the basal segments of the lower lobes, more commonly on the right. The fissure can be identified on approximately 3% of lateral chest radiographs.
Left Minor Fissure.
The left minor fissure is present in 8% to 18% of individuals but is seen on radiographs in only 1.6% of cases. The left minor fissure tends to be in a slightly more cephalad location than the right minor fissure and, like the right minor fissure, tends to be dome shaped (convex superiorly).
Pulmonary Ligament
The pulmonary ligament consists of a double layer of pleura that tethers the medial aspect of the lower lobe to the adjacent mediastinum and diaphragm. It is formed by the mediastinal parietal pleura as it reflects over the main bronchi and pulmonary arteries and veins onto the surface of the lung as the visceral pleura. Although the pulmonary ligament is anatomically extraparenchymal, it is contiguous laterally with a cleavage plane in the parenchyma of the lower lobe known as the intersegmental (intersublobar) septum, which separates the medial from the posterior basal segments. The pulmonary ligament is not seen on PA or lateral chest radiographs, although it determines the shape of the collapsed lower lobe in patients with atelectasis and the shape of the collapsed lung in patients with pneumothorax.
Thoracic Inlet
The thoracic inlet represents the junction between structures at the base of the neck and those of the thorax. It parallels the first rib and is higher posteriorly than anteriorly ( Fig. 1.21 ). Therefore, on a frontal chest radiograph, an opacity that is effaced on its superior aspect and that projects at or below the level of the clavicles must be situated anteriorly, whereas one that projects above the clavicles is retrotracheal and posteriorly situated. These characteristic findings together have been termed the cervicothoracic sign by some authors .

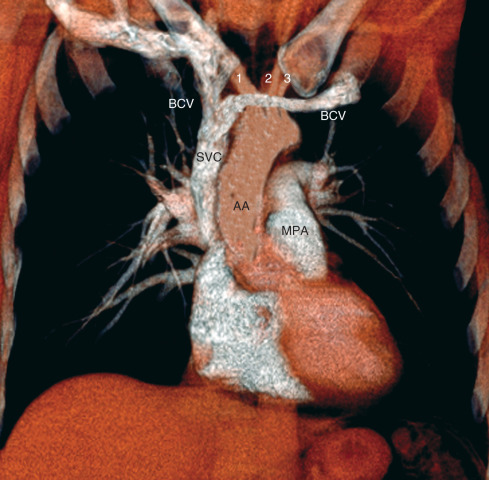
From front to back, structures occupying the thoracic inlet include the right and left brachiocephalic veins (which join behind the right side of the manubrium to form the superior vena cava [SVC]), the supraaortic branches, the trachea, the esophagus, and the recurrent laryngeal nerves on either side of the esophagus ( Figs. 1.22 ).

The overall shadow of the great systemic veins and arteries as seen on a frontal chest radiograph extending from below the level of the thoracic inlet to the heart is known as the vascular pedicle. The width of the vascular pedicle is measured from the lateral edge of the SVC as it crosses the right main bronchus to a vertical line drawn inferiorly from the point where the left subclavian artery arises from the aortic arch ( Fig. 1.23 ). Although variable, the vascular pedicle in a normal upright PA chest radiograph measures less than 6 cm. Widening (>7 cm) may result from dilation of the great vessels (supine position, pregnancy, increased blood volume, left heart failure), mediastinal abnormality (mediastinal lipomatosis, lymph node enlargement, masses, fluid collections), or pleural disease.

Mediastinum
Anatomy
The mediastinum separates the thorax vertically into two compartments and can be defined anatomically as the partition between the lungs. Although there is variability in the description of the mediastinum, the most widely used classification on radiography divides it anatomically (and for diagnostic purposes) into three compartments: anterior (prevascular), middle (cardiovascular), and posterior (postvascular). The anterior mediastinal compartment is bounded anteriorly by the sternum and posteriorly by the pericardium, aorta, and brachiocephalic vessels. It merges superiorly with the anterior aspect of the thoracic inlet and extends down to the level of the diaphragm. The compartment contains the thymus gland, branches of the internal mammary artery and vein, lymph nodes, the inferior sternopericardial ligament, and variable amounts of fat. On a chest radiograph the thymus is visible only in infants and young children, in whom it fills much of the anterior mediastinal space.
The middle mediastinal compartment contains the pericardium and its contents, the ascending and transverse portions of the aorta, the superior and inferior venae cavae, the brachiocephalic (innominate) arteries and veins, the phrenic nerves and the cephalad portion of the vagus nerves, the trachea and main bronchi and their contiguous lymph nodes, and the main pulmonary arteries and veins. The posterior mediastinal compartment is bounded anteriorly by the pericardium and the vertical part of the diaphragm, laterally by the mediastinal pleura, and posteriorly by the bodies of the thoracic vertebrae. It contains the descending thoracic aorta, esophagus, thoracic duct, azygos and hemiazygos veins, autonomic nerves, fat, and lymph nodes.
Given the variability in the visualization of anatomic structures in the lateral radiograph, it is preferable to classify abnormalities seen on radiographs into three groups based on the likelihood of their anatomic location: (1) the anterior mediastinum when a mass is situated between the sternum and a line drawn along the anterior border of the trachea and the posterior border of the heart, (2) the middle-posterior mediastinum when a mass is located predominantly between this line and a line drawn 1 cm behind the anterior margin of the vertebral bodies, and (3) the paravertebral region when a mass is situated predominantly in the potential space adjacent to a vertebral body ( Fig. 1.24 ). Although the vertebral bodies are not properly considered part of the posterior mediastinum, lesions in the paravertebral region are not infrequent causes of opacities projecting over the posterior mediastinal compartment on the lateral chest radiograph and thus should be considered within the differential diagnosis. Accurate assessment of the anatomic location of these abnormalities can readily be accomplished with CT or magnetic resonance imaging (MRI).

Frontal Chest Radiograph
On a frontal chest radiograph the mediastinal shadow to the right of the trachea is formed by the right brachiocephalic vein and the SVC, and the contour of the lower mediastinal shadow is formed by the right atrium ( Fig. 1.25 ). The interface between the right brachiocephalic vein and the SVC is seen in almost all patients from the level of the medial end of the right clavicle to the level of the right bronchus (see Fig. 1.25 ). The density of the SVC is generally less than that of the aortic arch, and its interface with the lung is normally slightly concave laterally. Increased opacity in the region of the SVC and the lateral convexity of its interface with the lung may result from increased size of the SVC (supine position, pregnancy, and right heart failure), paratracheal lymph node enlargement, a mediastinal mass, mediastinal hemorrhage, or a pleural abnormality.
The trachea is normally bordered on its right lateral aspect by pleura covering the right upper lobe. Contact of the right lung in the supraazygos area with the right lateral wall of the trachea creates a thin stripe of soft tissue density that is usually visible on frontal chest radiographs and is known as the right paratracheal stripe (see Fig. 1.25 ). This stripe is formed by the right wall of the trachea, contiguous parietal and visceral pleura, and a variable quantity of mediastinal fat. The thickness of this stripe above the level of the azygos vein generally ranges from 1 to 4 mm. Widening of the paratracheal stripe (>5 mm) may be due to thickening of the tracheal wall by inflammation or space-occupying lesions, paratracheal lymph node enlargement, mediastinal hemorrhage, or pleural disease. Widening of the paratracheal stripe is not a particularly sensitive sign for lymphadenopathy in that it is present in only approximately 30% of patients who demonstrate paratracheal lymph node enlargement on CT.
A slightly flattened elliptical opacity can frequently be seen in the region of the right tracheobronchial angle corresponding to the azygos vein being viewed tangentially as it enters the SVC (see Fig. 1.25 ).
The azygos vein originates in the upper lumbar region at the level of the renal veins as a continuation of the right ascending lumbar vein. Along its course the vein receives tributaries from the 5th to 11th intercostal veins on the right, the right subcostal vein, the right superior intercostal vein, the right bronchial veins, and the superior and inferior hemiazygos veins. It drains into the SVC.
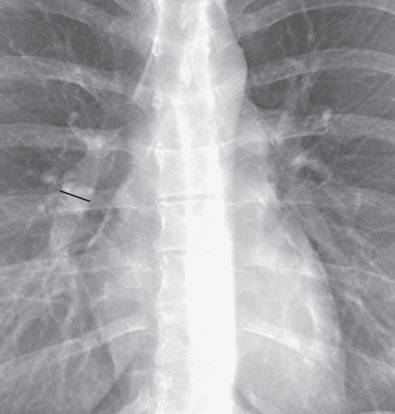
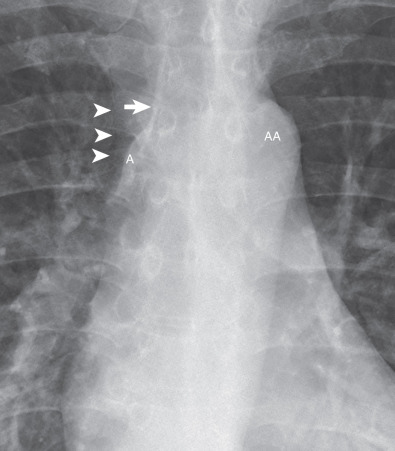
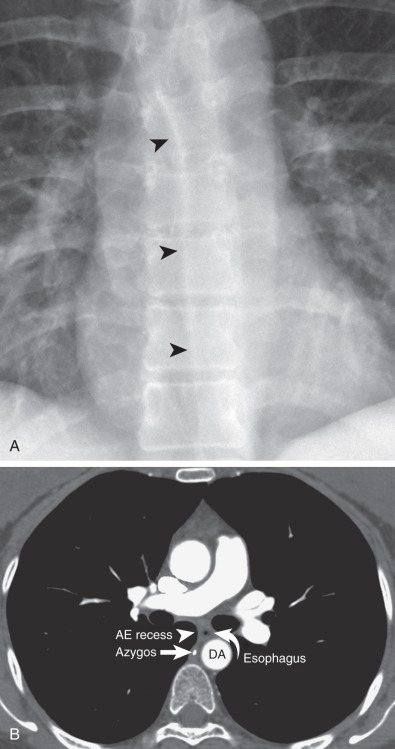
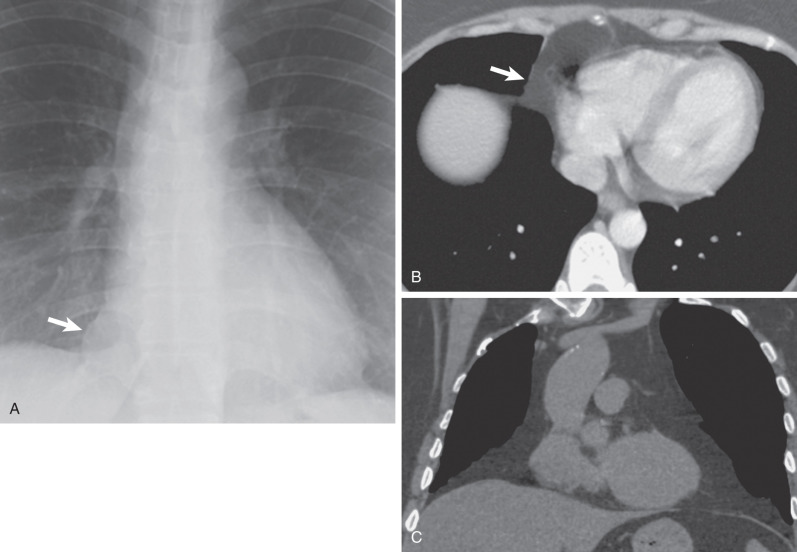
Contact of the right lower lobe with the esophagus and the ascending portion of the azygos vein results in the azygoesophageal recess. This recess is frequently identified on a well-penetrated PA radiograph as an interface that extends from the diaphragm to the level of the azygos arch ( Fig. 1.26 ). A focal right-sided convexity of the azygoesophageal recess interface should raise suspicion of an underlying pathologic process, such as a hiatal hernia, esophageal tumor or duplication cyst, azygos vein dilation, or subcarinal lymph node enlargement.
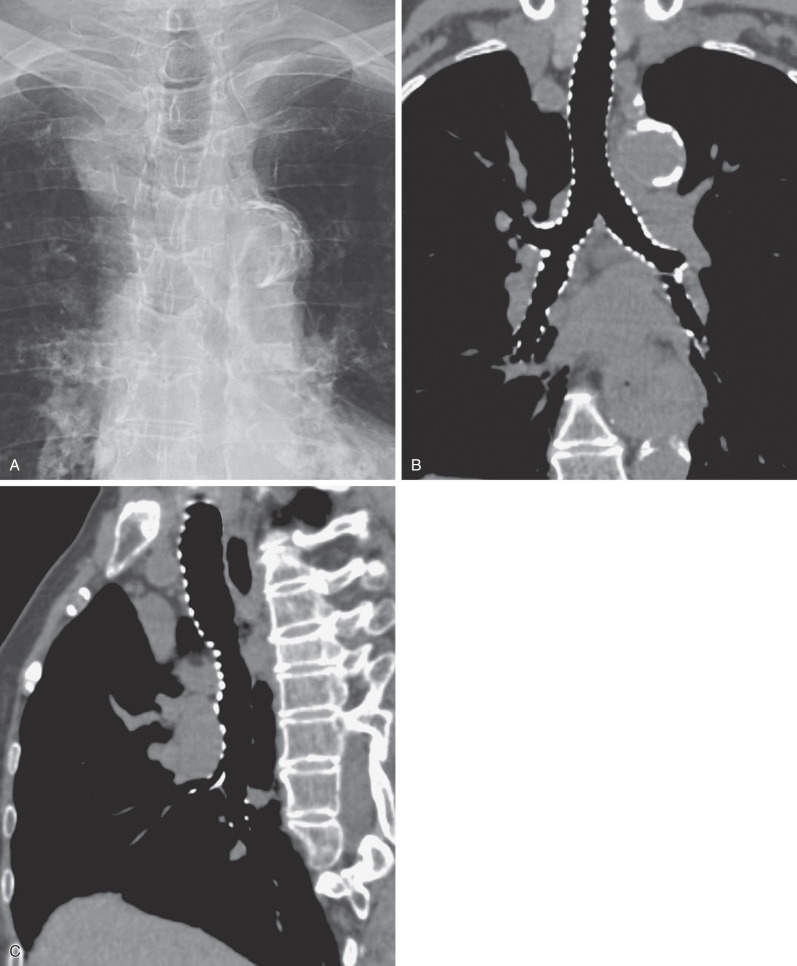
The left lateral wall of the trachea is rarely visible on a PA chest radiograph because of contiguity of the left subclavian artery and mediastinal fat. On a frontal chest radiograph the mediastinal shadow to the left of the trachea above the level of the aortic arch is typically a low-density arcuate opacity (concave laterally) extending from the aortic arch to a point at or just above the medial end of the clavicle ( Fig. 1.27 ). The lateral margin of this density corresponds to the course of the left subclavian artery and may be formed by the artery or, more commonly, by adjacent fat. The first convexity of the left aspect of the mediastinum is formed by the posterior portion of the aortic arch. Contact of the lateral aspect of the descending aorta and the left lung results in the left paraaortic interface. A lateral convexity of the left paraaortic interface may result from tortuosity of the aorta (normally seen in the elderly), an aortic aneurysm, a paraaortic mediastinal mass, hemorrhage, or enlarged lymph nodes.

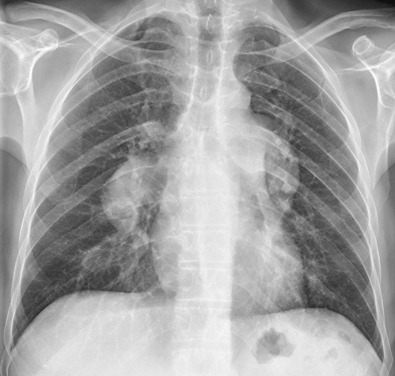
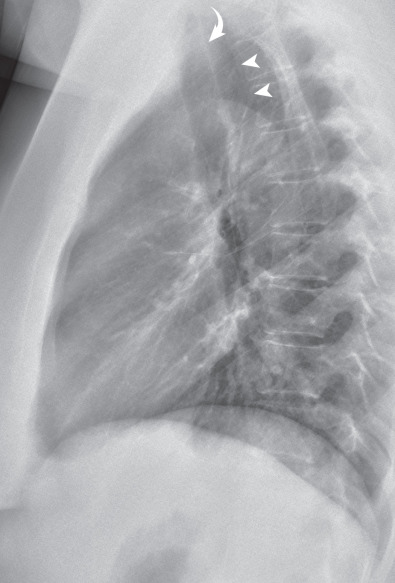
A small triangular or round opacity is seen immediately lateral to the aortic arch on approximately 1% of chest radiographs. This opacity, known as the “aortic nipple,” is caused by the left superior intercostal vein as it courses cephalad and forward to enter the left brachiocephalic vein ( Fig. 1.28 ).
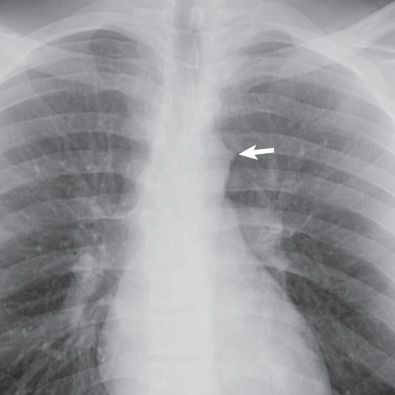
The opacity seen immediately below the level of the aortic arch and above the left main bronchus is the main pulmonary artery. The space between the arch of the aorta and the left pulmonary artery is known as the aortopulmonary window, which is usually concave or straight ( Fig. 1.29 ). It is occupied largely by mediastinal fat; its medial boundary is the ductus ligament, and its lateral boundary is the mediastinal and visceral pleura over the left lung, which creates the aortopulmonary window interface. Convexity of the aortopulmonary window interface may result from lymph node enlargement, a mediastinal tumor, or an aortic aneurysm. Because the left recurrent laryngeal nerve courses in the aortopulmonary window, pathologic processes in this region may be associated with left vocal cord palsy and hoarseness.

The interfaces between the anterior and posterior mediastinal contents and the lungs just inferior to the thoracic inlet result in linear shadows known as the anterior and posterior junction lines, respectively.
The anterior junction line is formed by contact of the right and left lungs with the adjacent prevascular mediastinum in the retrosternal space. On a PA chest radiograph this line is typically oriented obliquely from upper right to lower left behind the sternum ( Fig. 1.30 ), seen in approximately 20% of cases.

The pleural apposition between the upper lobes and along with any intervening mediastinal tissue creates the posterior junction line (see Fig. 1.30 ). On a PA radiograph the posterior junction line usually projects through the air column of the trachea; it may be straight or slightly convex to the left.
Lateral Chest Radiograph
The trachea can be readily seen on a lateral radiograph as it descends in a straight course obliquely caudally and posteriorly ( Fig. 1.31 ). The anterior wall of the trachea is seldom visible because it is obscured by the mediastinum, but the posterior wall can usually be seen because it abuts the lung. The posterior wall together with adjacent fat forms the posterior tracheal stripe or band, which generally measures less than 4 mm in diameter. Measurement of this stripe, however, is seldom helpful because the esophagus may be interposed between the posterior trachea and lung and result in a stripe thickness of 1 cm or greater.
The region posterior to the tracheal stripe and anterior to the spine above the level of the aortic arch is known as the retrotracheal triangle ( Fig. 1.31 ), which is a characteristically lucent space, and it contains the esophagus, lymph nodes, and posterior segments of the upper lobes. Increased opacity in the retrotracheal triangle in the lateral radiograph is abnormal, and although commonly resulting from an aberrant subclavian artery, other entities, such as an esophageal tumor, a thyroid mass, lymph node enlargement, or a foregut duplication cyst, may cause an abnormal density.
- •
Left hilum normally 1–2 cm higher than the right
- •
Normal diameter of the vascular pedicle: <7 cm
- •
Normal right paratracheal stripe: 1–4 mm
Heart
In normal individuals the transverse diameter of the heart measured on standard PA radiographs is generally in the range of 11.5 to 15.5 cm. A commonly used measurement to assess overall heart size is the ratio of the widest cardiac diameter to the widest inside thoracic diameter, known as the cardiothoracic ratio. A cardiothoracic ratio greater than 50% on a PA radiograph with the patient upright has a specificity of approximately 80% for the detection of left ventricular dilation but a sensitivity of only 50%. The cardiothoracic ratio is not helpful in detecting left atrial or right ventricular enlargement because neither of these chambers is reflected in the transverse dimension.
Cardiac size and contour of the heart are influenced by five main factors:
- 1.
Cardiac cycle: The diameter is largest at end diastole and smallest at peak systole. The change in heart width between systole and diastole is usually less than 1 cm.
- 2.
Height of the diaphragm, which in turn is influenced by lung volumes. The lower the position of the diaphragm, the longer and narrower the cardiovascular silhouette.
- 3.
Intrathoracic pressure, which influences not only cardiac size but also the appearance of the pulmonary vascular pattern.
- 4.
Body position: Assuming equality of all other factors, the heart is broader when a subject is recumbent than when erect.
- 5.
PA versus AP radiograph: The heart is magnified and appears larger on radiographs performed with AP projection of the x-ray beam.
The right border of the heart on a frontal radiograph is formed by the right atrium as it abuts the right middle lobe. Adjacent to the diaphragm, the inferior vena cava (IVC) may be seen as it enters the right atrium. The right ventricle is not visible on a frontal radiograph.
The heart border immediately below the level of the left bronchus is typically concave or straight (see Fig. 1.29 ). A focal convexity at this level is most suggestive of enlargement of the left atrial appendage, a finding seen most commonly in mitral heart disease. Enlargement of the left atrium may elevate the left main bronchus and cause splaying of the tracheal carina.
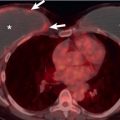
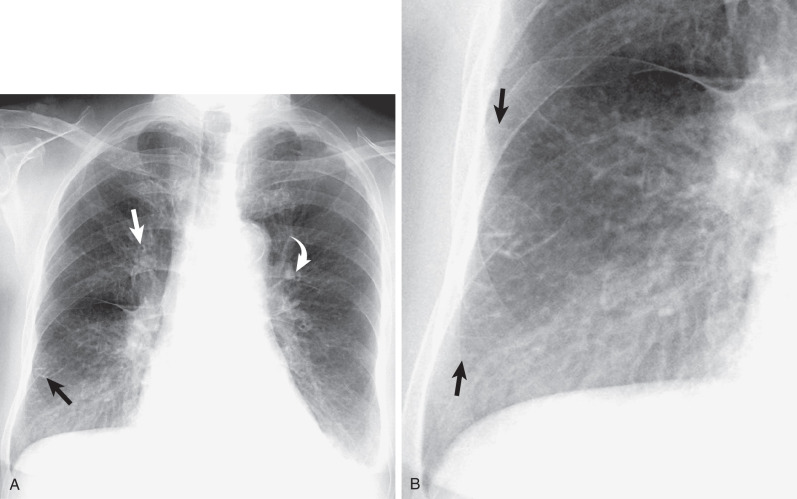
The junction of the right and left heart borders with the anterior hemidiaphragms results in the right and left cardiophrenic angles or recesses (see Fig. 1.29 ). These recesses contain fat (mediastinal fat pad) and lymph nodes and are usually concave laterally. A focal convexity of the cardiophrenic angle may result from the accumulation of fat (prominent mediastinal fat pad), a pericardial cyst, enlarged anterior diaphragmatic lymph nodes, or a Morgagni hernia ( Fig. 1.32 ).
On a lateral view the anterior border of the heart is formed by the right ventricle. Normally, the right ventricle contacts only the lower half of the sternum ( Fig. 1.33 ). The earliest sign of right ventricular enlargement on the radiograph is loss of the retrosternal clear space superiorly. The posterior heart border is formed in its upper third by the left atrium and in its lower two-thirds by the left ventricle. In some patients the IVC may be seen entering the posterior border of the right atrium.

Diaphragm
On a chest radiograph the upper surface of the dome-shaped diaphragm is normally visualized as it forms an interface with the lung; the soft tissues of the abdomen obscure its inferior surface. In approximately 95% of normal adults the level of the cupola of the right hemidiaphragm is projected in a plane ranging from the anterior end of the fifth rib to the sixth anterior interspace. On a left lateral view of the chest the right hemidiaphragm is seen along its entire length, whereas the anterior portion of the left hemidiaphragm is obscured by the heart ( Fig. 1.34 ).

Chest Wall
On a frontal radiograph of the thorax the soft tissues, including the skin, subcutaneous fat, and muscles, are usually distinguishable over the shoulders and along the thoracic wall. In the absence of pulmonary or pleural disease, deformity of the spine, or congenital anomalies of the ribs themselves, the rib cage should be symmetric.
The intercostal arteries, veins, and nerves are situated in the inferior inner surface of the ribs. By convention, a lateral chest radiograph is taken with the left side against the radiographic detector to avoid cardiac magnification. Therefore the right ribs, being further away, are magnified and appear bigger than the left ribs (the big rib sign).
In approximately 0.5% of the population unilateral or bilateral cervical ribs can be seen arising from the seventh cervical vertebra ( Fig. 1.35 ). These are generally incidental findings, although they may result in thoracic outlet syndrome—pain and weakness in the C8 nerve root distribution, variation in pulse intensity in the two arms when the affected extremity is in certain positions. Other supernumerary ribs are rare.

The sternum forms the anterior midline portion of the thoracic cage. It is made up of the manubrium, which articulates with the clavicles; the body; and the xiphoid process. The most common congenital abnormality of the sternum is a depression of the sternum known as pectus excavatum, or “funnel chest,” which may cause leftward displacement and axial rotation of the heart when severe. In these cases obscuration of the right heart border on frontal radiographs may mimic right middle lobe airspace disease ( Fig. 1.36 ).
A less common congenital abnormality is abnormal protrusion of the sternum known as pectus carinatum, or “pigeon breast” ( Fig. 1.37 ), which is seen with increased frequency in patients with cyanotic congenital heart disease.

The sternum is difficult to assess on a frontal view and best seen on lateral or oblique views. Retrosternal lung allows identification of a stripe between the posterior cortex of the sternal body and the lung. This retrosternal stripe is composed primarily of fat and ranges from 1 to 3 mm in thickness. Indentation of the lung by parasternal structures, particularly costal cartilage, may result in a lobulated contour posterior to the parasternal stripe. A focal convexity or lobulation that is not at the level of a costal cartilage is suggestive of an abnormality, most commonly enlarged internal mammary lymph nodes.
On an optimal chest radiograph exposure factors should be such that the thoracic spine and intervertebral disks are faintly visible, with the spinous processes being in the midline. Contact between the lower lobes and the paravertebral soft tissues results in paravertebral interfaces or stripes that are commonly visible on a frontal radiograph, particularly in the lower part of the chest, usually thin and parallel to the spine. Displacement of the paravertebral stripe may occur with a vertebral abnormality (osteophyte, fracture, infection, neoplasm), paravertebral masses (hematoma, neurogenic tumor, paravertebral abscess), or lymph node enlargement.
Computed Tomography
Technical Aspects
The CT image is a two-dimensional representation of a 3D cross-sectional slice, the third dimension being the section or slice thickness. The slice thickness also is known as the collimation width and was traditionally defined by collimators between the x-ray tube and the patient. Current technology allows acquisition of submillimetric slice thickness, which results in an isometric voxel and thus allows reconstruction of CT data in any imaging plane (sagittal, coronal, oblique, curved). The CT image is composed of multiple picture elements (typically 512 × 512) known as pixels. A pixel is a unit area (i.e., each square on the image matrix); it reflects the attenuation of a unit volume of tissue, or voxel, which corresponds to the area of the pixel multiplied by the section thickness. The x-ray attenuations of the structures within a given voxel are averaged to produce the image. The CT image reflects the absorption of x-rays by tissues of differing atomic number (radiographic density) within the CT section. The x-ray tube and the detectors are placed on opposite sides of the patient in a ring-like structure known as the CT gantry, which surrounds the patient, who is positioned on the CT table located in the center of the gantry. The gantry rotates around the patient, producing a series of projections that are mathematically reconstructed by a computer to form the CT image.
Incremental and Continuous Volume (Spiral) Computed Tomography
Spiral (helical) volumetric CT was an important technical advance introduced in the early 1990s that allows continuous scanning while the patient is moved continuously through the CT gantry. Current spiral CT scans of the chest are typically completed during a single breath-hold. The continuous nature of the data acquisition allows true volumetric scanning, increased spatial resolution in the longitudinal axis, and the production of high-quality multiplanar and 3D reformations without additional radiation exposure. Because spiral CT allows the entire chest to be scanned during a single breath-hold, it virtually eliminates artifacts caused by respiratory motion that otherwise degrade image quality.
Major developments were the introduction of faster rotational times (subsecond CT scans) and multiple detector arrays (multidetector CT). Faster rotational times make it possible to increase the anatomic coverage for any given section thickness and result in a marked reduction in cardiac motion artifacts and improvement in the evaluation of the pulmonary and systemic vessels. The advantages of multidetector CT scanners include improved temporal resolution, improved spatial resolution in the z-axis, increased efficiency in x-ray tube use, and decreased image noise.
Multidetector CT scanners generate isotropic data sets (i.e., 3D voxels with nearly identical measurements along their individual x-, y-, and z-axes). The increased spatial resolution in the z-axis (cephalocaudad plane) results in considerable improvement in the multiplanar and 3D reconstructions.
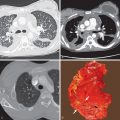
Multiplanar image displays allow better appreciation of the spatial relationships of various structures than a series of individual cross-sectional images. Use of graphics-based software systems and volume-rendering techniques allows depictions of the luminal surface of the airways that resemble the images seen by bronchography or during bronchoscopy ( Figs. 1.38 and 1.39 ).


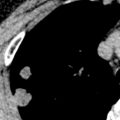
Several techniques have been used to depict the entire volume of data. A technique that is particularly helpful in CT angiography and in the detection of lung nodules is maximum-intensity projection (MIP) ( Fig. 1.40 ). MIP images display the structures of interest that are brighter than the adjacent structures in any given stack (slab) of preselected axial images. The resolution inherent to the axial images from which it is created is maintained. The major pitfall with MIP slabs is that only the highest density object contributes to the final image. Hypodense structures are hidden inside hyperdense structures, therefore limiting the efficacy of MIP images in diagnosing pulmonary embolism. Thicker slabs (3–10 mm) are most helpful in the assessment of pulmonary nodules ( Fig. 1.41 ). A related technique is minimum-intensity projection, which highlights the structures with minimal density within a given slab of axial images. Sliding minimum-intensity projection with 5 to 10 mm thick slab images improves conspicuity of small areas of hypoattenuation and is particularly helpful in detecting mild emphysema ( Fig. 1.42 ).


Volume rendering uses all of the data from the multidetector CT acquisition in the final image ( Fig. 1.43 ). It is a truly 3D reconstruction that conveys depth perception. All voxels contained within the reconstructed volume are included in the display, and voxels outside the boundaries of the reconstruction are invisible on the final image. Current workstations allow volume rendering to be performed routinely in real time and in concert with multiplanar reformatting images and MIP slabs. Volume rendering is most helpful in assessing changes in vascular morphology (e.g., strictures) and in clarifying complex 3D anatomic relationships.
Imaging Parameters
Several operator-dependent parameters influence the information provided by chest CT. The main ones are slice thickness, field of view, reconstruction algorithm, and image display settings (window width and level). In selected cases intravenous (IV) contrast medium may be used to distinguish vessels from soft tissue lesions or to detect intravascular abnormalities, such as pulmonary emboli.
The attenuation value of each picture element (pixel) of the CT image represents the average of all the attenuation values within the unit volume of tissue, or voxel, which corresponds to the area of the pixel multiplied by the section thickness. The section thickness determines the number of structures or tissues that are averaged to produce each pixel. Decrease in section thickness leads to decrease in volume averaging and increase in spatial resolution.
The optimal slice thickness is determined by the size of the structure being assessed and by the number of scans required to evaluate the patient. It has been well established that thin sections (≤2 mm) are required for adequate assessment of the pulmonary parenchyma and peripheral bronchi ( Fig. 1.44 ). Although thicker sections (e.g., 3–5 mm) provide adequate assessment of most mediastinal abnormalities, thin sections allow more detailed evaluation of the lung parenchyma and are now used almost routinely in chest imaging.

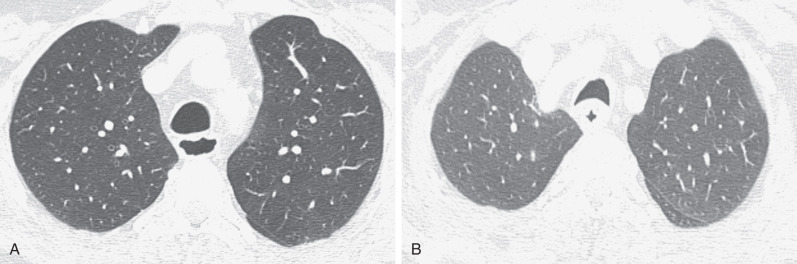
CT scans are routinely performed during suspended full inspiration, which provides optimal contrast between normal aerated lung parenchyma and abnormal soft tissue and minimizes transient atelectasis, a finding that may mimic or obscure parenchymal disease. In patients with obstructive lung disease additional scans may be obtained during or after forced expiration to detect airway abnormalities, such as tracheobronchomalacia, and to delineate areas of air-trapping ( Fig. 1.45 ).

In most cases the scans are done with the patient supine. Scans with the patient prone occasionally are required to detect subtle parenchymal abnormalities in the dorsal lung regions that may be otherwise obscured by normal dependent density or atelectasis. Prone scans are most helpful in patients with suspected parenchymal disease and normal chest radiographs, in patients with suspected asbestosis, and in patients with clinically suspected interstitial lung disease in whom the CT scan in the supine position shows only questionable abnormalities limited to the dependent lung regions ( Fig. 1.46 ).

CT numbers in the thorax range from approximately −1000 Hounsfield units (HUs) for air in the trachea to approximately 700 HUs for dense bones. The display of the CT image on the monitor is determined by the window level and width and is limited to 256 shades of gray. No single window setting can display adequately all of the information available on a chest CT scan. To display the large number of attenuation values (HUs) within a limited number of shades of gray, a CT number is selected that corresponds to approximately the mean attenuation value of the tissue being examined. This center CT attenuation value is called the window level. The computer is instructed to assign one shade of gray to a certain number of CT attenuation values above and below the window level. The range of CT numbers above and below the window level is called the window width. To depict the lungs adequately, a window level of −600 to −700 HUs and a window width of 1000 to 1500 HUs are recommended. Window levels of 30 to 50 HUs and window widths of 350 to 500 HUs usually provide the best assessment of the mediastinum, hila, and pleura, as a general although not absolute guideline of values.
High-Resolution Computed Tomography
The distinction between a “normal CT’ scan and high-resolution CT (HRCT) scan continues to blur as CT technology advances and lung imaging protocols have evolved to maximize the available technology. CT scan data are routinely reconstructed using a standard or soft tissue algorithm, which smoothens the image and reduces visible image noise; such an algorithm is preferred in the assessment of abnormalities of the mediastinum and chest wall. Use of a high spatial–frequency reconstruction algorithm is required for optimal assessment of the lung parenchyma. This algorithm reduces image smoothing and increases spatial resolution, allowing better depiction of normal and abnormal parenchymal interfaces and better visualization of small vessels, airways, and subtle interstitial abnormalities ( Fig. 1.47 ). The combination of thin-section CT scan (0.5–1 mm collimation) and a high spatial–frequency reconstruction algorithm provides the optimal assessment of interstitial and airspace lung disease, comparable to that of gross (macroscopic) lung pathology, and has been referred to as HRCT, although now standard reconstruction of any chest CT scan using this methodology is possible. Typically, HRCT protocols also include images obtained while the patient is prone and also during end expiration. IV contrast is not administered as it does not add any value in the setting of interstitial lung disease assessment.

Radiation Dose
The best currently available measurement for assessment of the risks of radiation is the effective dose. Effective dose estimates the whole-body dose that would be required to produce the same stochastic risk as the partial-body dose that was actually delivered in a localized radiologic procedure. Effective dose is useful because it allows comparison with other types of radiation exposure, such as whole-body radiation exposure secondary to natural background radiation. Effective dose is calculated by summing the absorbed doses to individual organs weighted for their radiation sensitivity. The measurement unit is the sievert (Sv). When the effective dose has been calculated, risk estimates for stochastic effects can be produced by using a linear extrapolation of radiation exposure data from Japanese atomic bomb survivors.
The main risk of radiation used in diagnostic x-rays, including CT, is the development of fatal cancers. The International Commission on Radiological Protection has recommended the use of a conservative risk of 50 additional fatal cancers induced per 1 million people of the general population exposed to 1 millisievert (mSv) of medical radiation. Although this is the average risk, there is a pronounced age effect on the risk of cancer from ionizing radiation. Children may be an order of magnitude more sensitive than adults to the risk of cancer induction from the same effective dose of ionizing radiation as they have more time to express the cancer, and they have more rapidly dividing cells than adults have. For the same reason, adults older than 50 years have a considerably reduced risk of developing radiation-induced cancer than younger patients. At all ages, women are at higher risk of developing radiation-induced cancer than men because of the greater risk of breast cancer.
The radiation dose of a CT scan of the chest performed volumetrically using multidetector CT using 300 milliamperage-seconds (mAs) and 120 kVp is approximately 7 mSv. The radiation dose of a CT scan of the chest performed for lung cancer screening is approximately 1.5 mSv. By comparison, the radiation dose using 1-mm sections at 10-mm intervals is approximately 0.7 mSv, the dose of a PA chest radiograph is 0.05 mSv, and the average yearly dose from background radiation is approximately 2.5 mSv.
Normal Anatomy
Airways
Trachea and Main Bronchi
The tracheal wall is typically seen as a 1- to 2-mm soft tissue stripe on CT ( Fig. 1.48 ). Cartilage calcification is commonly seen in older subjects, particularly women. Cartilage calcification may also occur prematurely in patients undergoing prophylactic warfarin therapy for anticoagulation. The cross-sectional appearance of the trachea varies but is most commonly rounded or oval. The posterior tracheal wall is typically flat or convex posteriorly on CT scans performed at maximal inspiration and convex anteriorly on expiratory CT ( Fig. 1.49 ). The upper limits of normal for the transverse (coronal) and AP (sagittal) diameters of the trachea in men are 25 and 27 mm, respectively, and in women are 21 and 23 mm, respectively. The lower limit of normal for both dimensions is 13 mm in men and 10 mm in women. Because of the increase in the intrathoracic pressure, the diameter of the intrathoracic trachea decreases during expiration. The decrease in the AP diameter is mainly due to invagination of the posterior tracheal membrane, a finding that is useful in confirming that an adequate expiration has occurred on expiratory CT.

The trachea divides into the left and right main bronchi at the carina ( Fig. 1.50 ). For a short distance, the main bronchi contain horseshoe-shaped cartilage rings, similar to the trachea. More distally, the cartilage plates become less regularly shaped.

Lobar Bronchi and Bronchopulmonary Segments
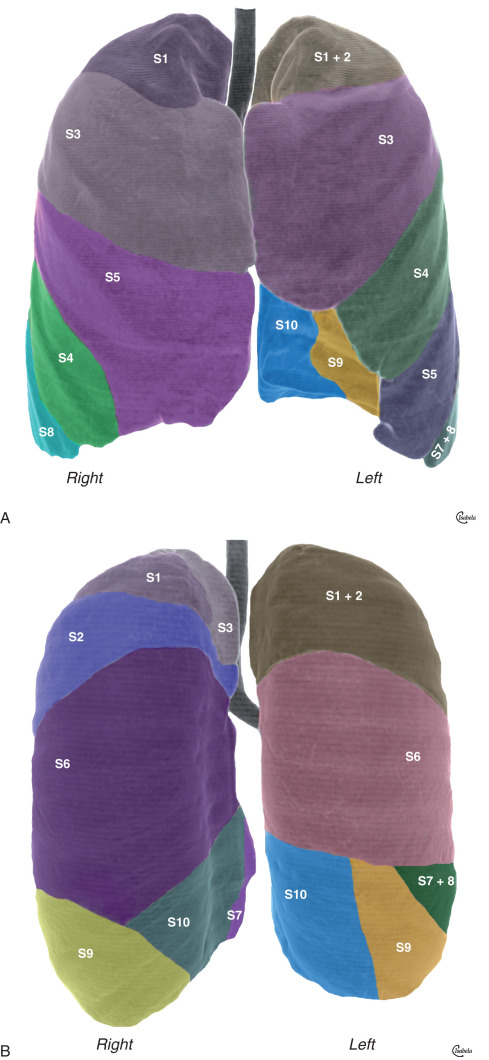
The lobar bronchi give origin to segmental bronchi. Although the segmental bronchial anatomy varies, in most patients the right lung contains 10 segmental bronchi, and the left contains 8 ( Fig. 1.51 ). There are two widely accepted nomenclatures for bronchopulmonary anatomy: the Jackson-Huber and Boyden classifications. The Jackson-Huber nomenclature is the most widely adopted terminology in North America and the one used throughout this book. The Boyden classification uses a numerical system for identifying the bronchial segments. The segmental bronchi are designated by B, followed by a number (e.g., B1), and subsegmental bronchi are indicated by the segmental number, followed by a lowercase letter (e.g., B1a). The numbering of the segmental bronchi corresponds to their order of origin from the airway. The segments of lung that the bronchi supply are identified by the letter “S,” followed by the corresponding number.


The right upper lobe usually has three segments: apical (S1 in the Boyden classification), anterior (S3), and posterior (S2). The middle lobe has two segments: lateral (S4) and medial (S5). The right lower lobe has five segments: superior (S6), medial basal (S7), anterior basal (S8), lateral basal (S9), and posterior basal (S10) (see Fig. 1.16 ).
The left upper lobe usually has two segments: apicoposterior (S1 and S2) and anterior (S3). The lingula has two segments—superior (S4) and inferior (S5), and the left lower lobe has four—superior (S6), anteromedial basal (S7 and S8), lateral basal (S9), and posterior basal (S10).
Normal Bronchi on Computed Tomography
The outer diameter of the bronchus is normally approximately equal to that of the adjacent pulmonary artery ( Fig. 1.52 ). Bronchi may appear larger than the adjacent pulmonary artery if the artery bifurcates before the corresponding bronchus or if it is narrowed because of vasoconstriction. The measurement also is influenced by altitude, presumably as a result of a combination of hypoxic vasoconstriction and bronchodilation.