- •
Current conventional methods to assess arrhythmic risk, including their guidance for implantation of a cardioverter defibrillator, have recognized shortcomings.
- •
Radionuclide imaging can enhance other methods to assess arrhythmic risk through its ability to better assess the underlying pathophysiologic mechanisms of potentially lethal arrhythmias, as well as its ability to noninvasively screen large numbers of patients who are potentially at risk.
- •
Given that most sudden cardiac deaths occur in the setting of ischemic heart disease, radionuclide MPI can help identify and quantify ischemic and scar, thereby identifying patients at high arrhythmic risk.
- •
PET metabolic imaging is useful in the identification of myocardial inflammation, which helps guide the potential need for antiinflammatory therapies in patients with life-threatening ventricular arrhythmias or at risk for arrhythmias.
- •
Phase analysis of gated perfusion images that help assess adverse myocardial remodeling has demonstrable ability to stratify arrhythmic risk and could be used to follow risk reduction in response to therapy.
- •
Cardiac adrenergic imaging with 123 I-mIBG has demonstrated robust and consistent ability to stratify arrhythmic risk. In general, both SPECT and PET neuronal tracers showed that the volume of denervated myocardium associates with the risk of ventricular arrhythmias. With 123 I-mIBG, this is quantified as an HMR, with an HMR greater than 1.6 identifying lower-risk patients.
- •
The extent of scarred myocardium is also associated with arrhythmic risk and can be quantified with both SPECT and PET imaging. The scar burden complements risk predictions by adrenergic imaging.
- •
The ability of radionuclide imaging, in conjunction with cardiac magnetic resonance imaging, to characterize myocardial scar and border zones shows great promise to fine tune the assessment of arrhythmic risk.
- •
Myocardial perfusion, metabolic and adrenergic imaging has the potential to direct arrhythmic ablative therapies.
Introduction
Cardiac arrhythmias are major causes of morbidity and mortality. They are the most frequent immediate cause of sudden cardiac death (SCD), which accounts for about 230,000 to 350,000 yearly deaths in the United States. , Nuclear cardiology is not customarily thought of as a technique for assessing arrhythmic risk. In the 2008 American Heart Association (AHA)/American College of Cardiology Foundation/Heart Rhythm Society Scientific Statement on noninvasive risk stratification techniques for identifying patients at risk for SCD, the use of imaging was limited to the assessment of left ventricular ejection fraction (LVEF). Since then, radionuclide cardiac imaging, often in conjunction with other noninvasive imaging techniques, has become increasingly recognized as providing important information regarding diagnosis and risk stratification of patients at risk for ventricular arrhythmias. For example, myocardial perfusion imaging (MPI) provides robust quantification of ischemia, scar, and left ventricular (LV) function, which are known to contribute to arrhythmic risk. As described in Chapter 23 , radionuclide imaging also provides quantitative information about myocardial inflammation in patients with inflammatory cardiomyopathies, many of whom present with ventricular arrhythmias, which helps guide patient management. In addition, assessment of LV remodeling and mechanical dyssynchrony using electrocardiogram (ECG)-gated MPI may also help guide management in patients with heart failure (HF) at risk for SCD (see Chapter 27 ). Finally, radionuclide imaging can visualize and quantify cardiac sympathetic nerve function and, in so doing, help identify patients at risk for ventricular arrhythmias and potentially guide therapy, including the use of an implantable cardioverter defibrillator (ICD) and guidance of ventricular ablation.
Risk stratification of arrhythmic risk
Numerous efforts have been made to identify conventional clinical criteria that could effectively risk stratify and select patients with known cardiac dysfunction who are likely to benefit from a primary prevention ICD. In 45,000 primary prevention ICD patients, various so-called shocked predictor variables accurately identified patients at highest risk for death over 3 years. Although ICD discharges were not specifically looked at, the goal was to identify patients at highest risk for nonarrhythmic mortality for whom there would likely be little or no benefit from the device. In another study of 2258 ICD patients, a CHA 2 DS 2 -VASc (Congestive heart failure, Hypertension, Age, Diabetes, previous Stroke/transient ischemic attack – vascular disease) score predicted all-cause mortality, again an attempt to identify those patients not likely to benefit from the device.
Numerous ECG parameters associated with arrhythmic risk have been examined in patients after myocardial infarction (MI) or with HF, including ECG Q-waves, an intraventricular conduction delay, spontaneous premature ventricular contractions (PVCs) and nonsustained ventricular tachycardia (NSVT), late potentials on signal-averaged ECG (SAECG), reduced heart rate variability (HRV), and T-wave (repolarization) alternans (TWA), as well as ventricular tachycardia (VT) inducibility on an electrophysiologic study (EPS). Nevertheless, PVCs and NSVT are generally markers of increased risk, SAECG, HRV, and TWA have low positive predictive values and are rarely used in clinical practice, and EPS is invasive and thus not a convenient routinely performed screening procedure to assess arrhythmic risk.
Serum-based biomarkers have been studied for potential screening of arrhythmic risk. A study of 1189 ICD patients found that tumor necrosis factor alpha receptor II, probrain natriuretic peptide (pro-BNP), and cardiac troponin T were independently associated with 1-year mortality, with a net-reclassification improvement of 77.2%.
Despite interesting findings, there are crucial deficiencies with many of the aforementioned analyses. First, they often did not specifically examine arrhythmic events, which is better done using specific ICD-recorded criteria, such as spontaneous sustained (>30 seconds) VT or an appropriate discharge (antitachycardia pacing or defibrillation). , At the same time, assessing the ICD record can be misleading because a discharge does not necessarily mean that a patient would have died if not for the device. In addition, an ICD discharge recorded in a patient who has died may be a response to a terminal arrhythmia that occurred as the patient was dying from pump failure.
Second, although various criteria may identify the relatively few patients at highest risk of a lethal arrhythmic event, the majority of patients who die a sudden cardiac death have either undiagnosed disease or are determined to be at low risk based on standard risk markers. Thus, current clinical methods may identify patients most at risk for arrhythmic death but cannot find most of the patients who are at risk.
It is reasonable to expect that more effective ways of assessing ventricular tachyarrhythmic risk employ techniques that directly depict cardiac structures and measure functional parameters, something for which cardiac imaging is ideally suited. Although determination of LVEF using various methods is the most commonly used imaging technique for arrhythmic risk stratification, it is a somewhat crude, global measure of cardiac function that does not directly provide information about underlying arrhythmic origins or mechanisms. Imaging techniques directed at underlying arrhythmic mechanisms are needed for more accurate risk assessment.
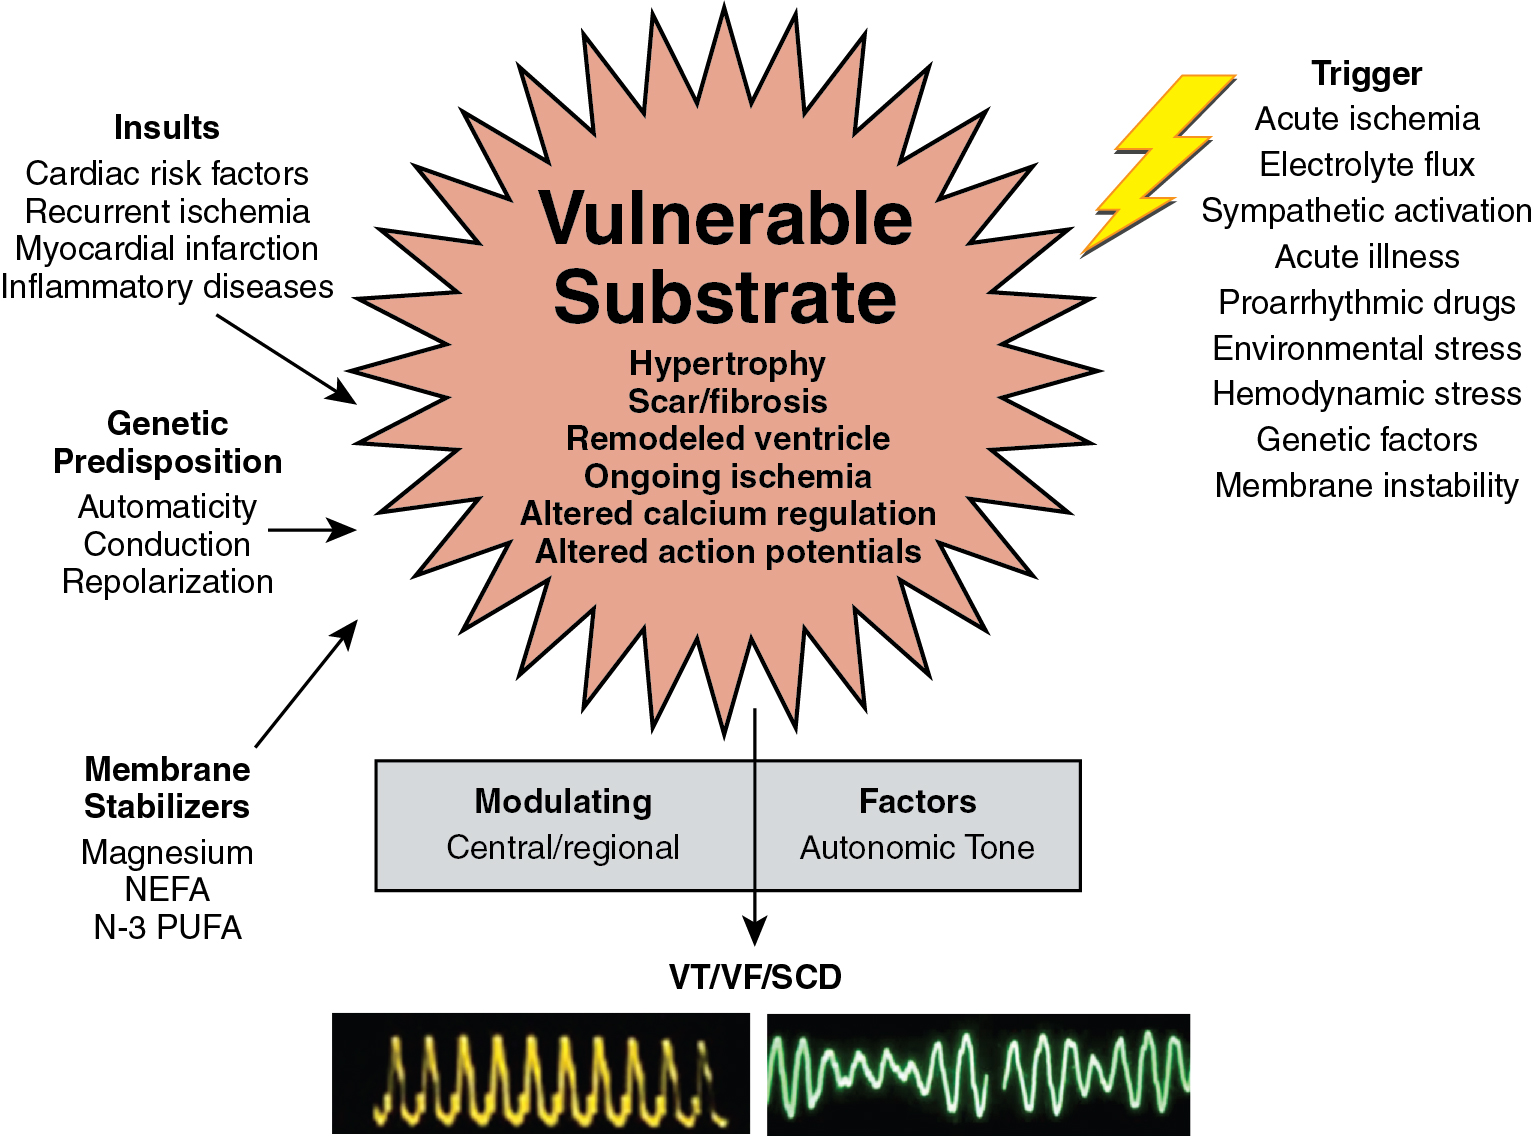
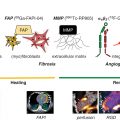
Fundamentally, sudden tachyarrhythmias in HF are caused by alterations in the functional expression of ion channels and transporters in conduction tissues, leading to heterogeneous prolongation of action potentials that results in exaggeration of electrical inhomogeneity, particularly temporal and spatial dispersion of repolarization. Alterations in calcium homeostasis also contribute to electrical instability. Ultimately, these electrical perturbations lead to dispersion of electrical impulse conduction through the myocardium, exacerbated by regions with fibrous tissue, resulting in reentrant excitation and ventricular arrhythmias. Although these underlying molecular mechanisms cannot be imaged directly with current clinical techniques, structural changes that make myocardium susceptible to electrical heterogeneity, and outside forces provoking or sustaining it, can be. A convenient way to categorize arrhythmogenic myocardial changes and outside forces is depicted in Fig. 21.1 . Abnormalities in myocardial substrate, such as tissue damage from coronary ischemic events that create areas of potential electrical instability and can lead to myocardial geometric remodeling, infectious damage, immunologically induced damage, a genetic electrical abnormality, and genetic cellular or metabolic abnormalities can all create a heart predisposed to or already exhibiting electrical conduction heterogeneity. Nevertheless, a trigger is required to initiate an arrhythmia, which could be an acute ischemic event imposed on a previously normal heart, an ischemic insult to an already damaged heart, a systemic electrolyte abnormality, a proarrhythmic pharmacologic substance, a hemodynamic or environmental stress, or an autonomic perturbation. Finally, there are modulating factors, such as the state of neurohormonal balance, including direct cardiac autonomic innervation, which can sustain an arrhythmia that has begun or can stop it. Imaging techniques, including radionuclide methods that can depict underlying molecular processes, are well able to assess aspects of all of these categories.
Patient-centered applications of radionuclide and multimodality imaging for the evaluation of arrhythmic risk
Case vignette 1: Screening for coronary artery disease
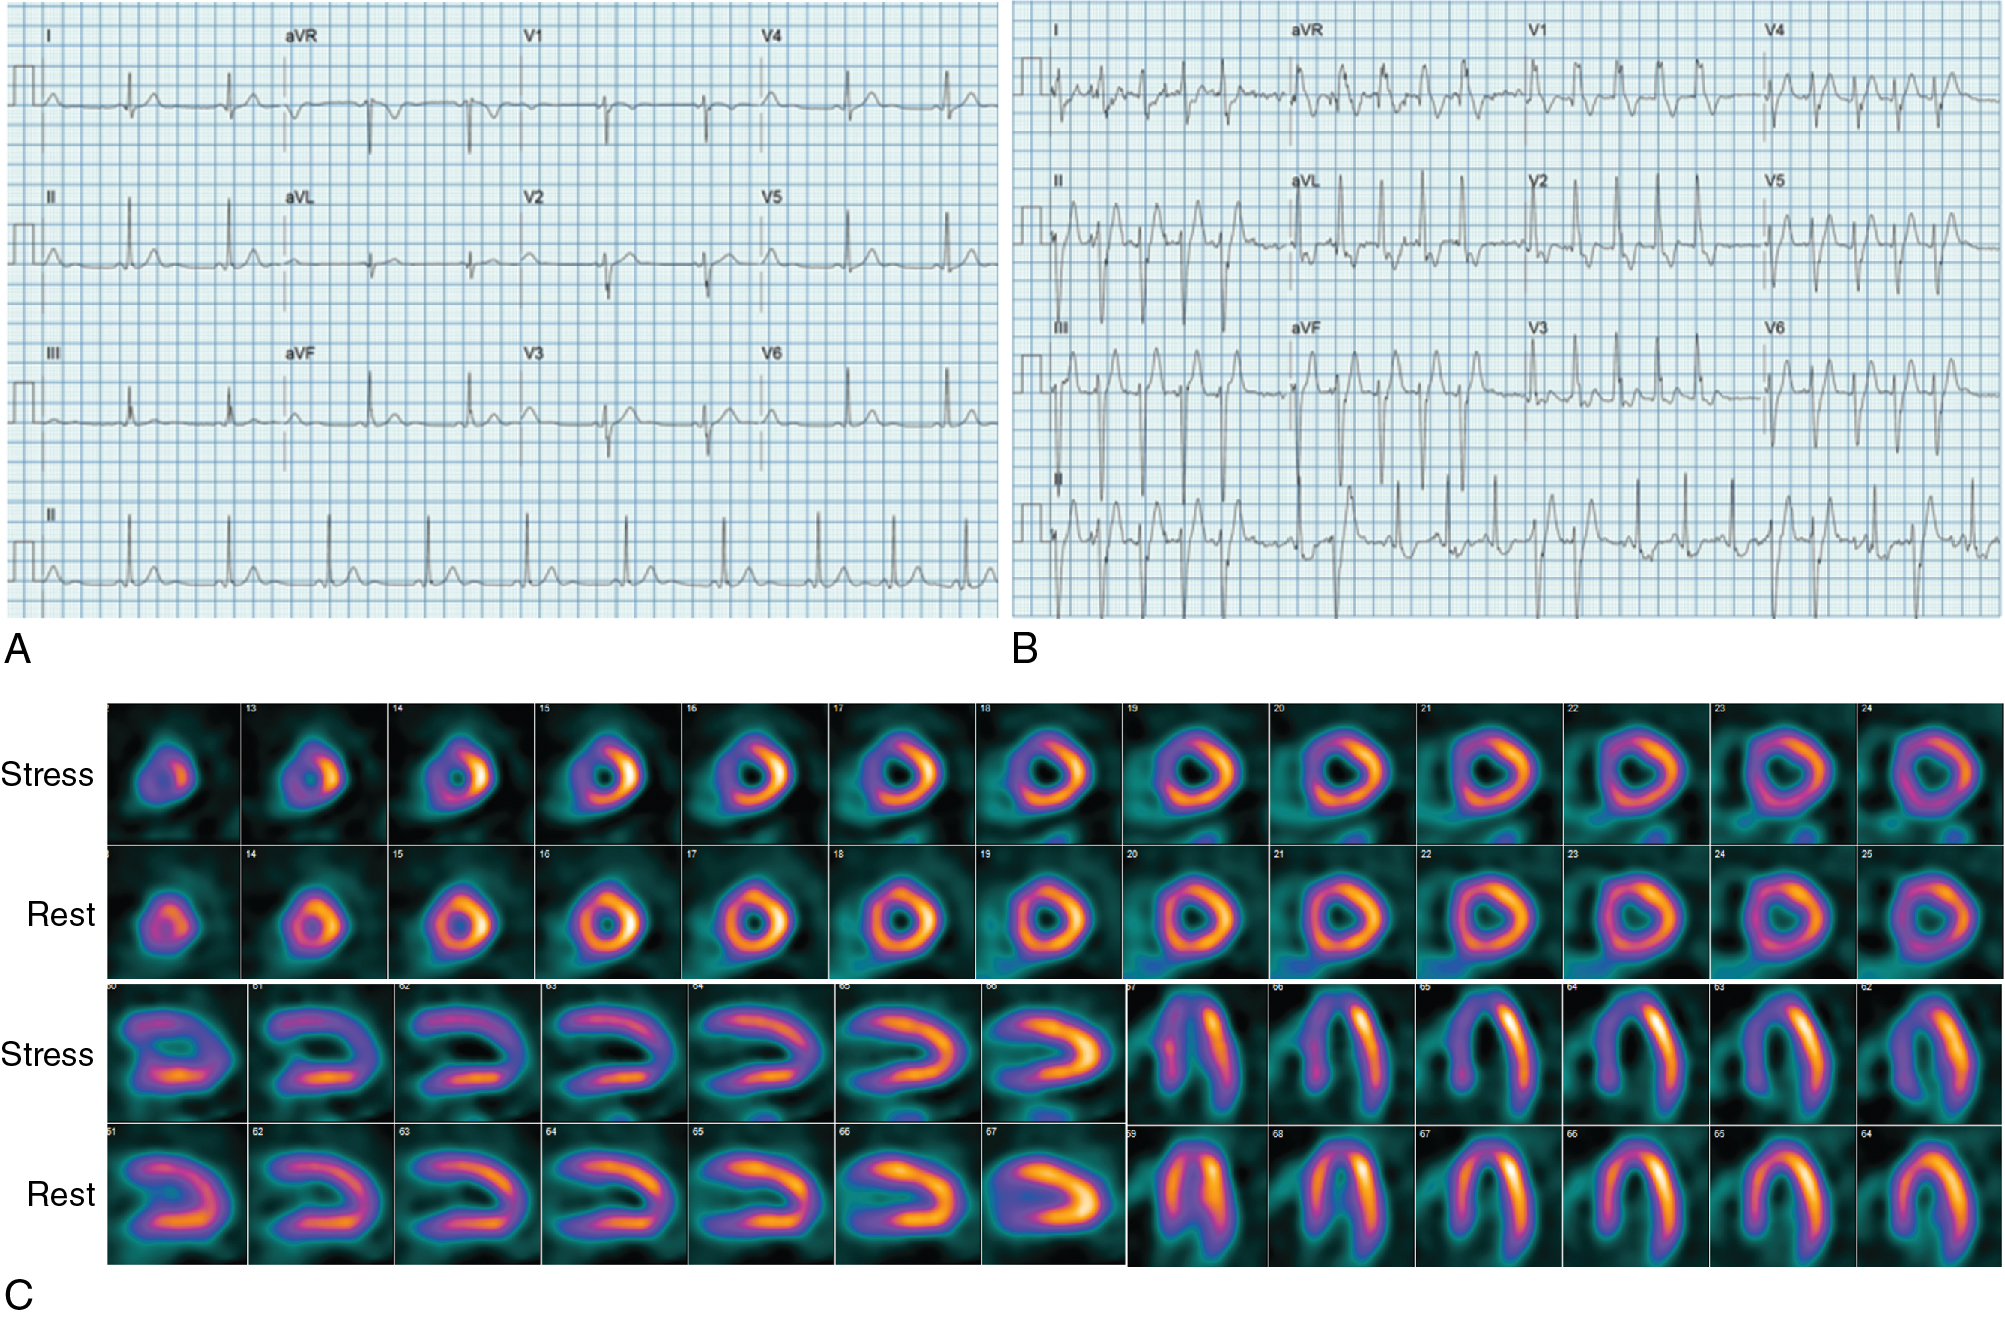
A 57-year-old male without previous cardiac history presented with exertional chest pain radiating to the left arm with long walks, associated with shortness of breath and palpitations, was referred for an exercise myocardial perfusion single photon emission computed tomography (SPECT) study. His baseline ECG was normal. At about 6 minutes of exercise, the patient developed NSVT with symptoms of chest pain associated with 2 mm of ST-segment depression. The stress/rest 99m technetium (Tc)-sestamibi images showed a large and severe perfusion defect throughout the anterior and anteroseptal walls, the apical LV segments, and the LV apex, showing complete reversibility ( Fig. 21.2 ). The ECG-gated images demonstrated anterior and anteroseptal hypokinesis with a normal LVEF of 60%. Subsequent coronary angiography showed severe three-vessel obstructive coronary artery disease (CAD), including a 60% left main stenosis. The patient underwent successful coronary artery bypass surgery.
Radionuclide MPI provides accurate quantification of myocardial ischemia, scar, and LVEF, which are known risk factors for ventricular arrhythmias. Indeed, about 80% of SCDs occur in the setting of ischemic heart disease. Half the patients who suffer an out-of-hospital cardiac arrest have evidence of acute MI and more than 50% are found to have significant CAD. For this reason, radionuclide MPI is an effective test to identify patients at risk for arrhythmias associated with CAD. Piccini et al. followed 6383 patients with documented CAD undergoing stress 99m Tc-sestamibi SPECT MPI and found that the combined extent and severity of scar plus ischemia was significantly associated with SCD independent of LVEF and a clinical morbidity index. They found that the incidence of SCD was greatest (13% at 10 years) in patients with a LVEF of less than 35% and medium or large areas of scar plus ischemia, with an SCD. Conversely, patients with mild or no scar plus ischemia and a LVEF greater than 35% had the lowest risk for SCD.
As illustrated by Case Vignette 1, exercise SPECT MPI can sometimes provoke a potentially lethal arrhythmia, thereby identifying patients at risk for SCD. Conversely, much literature has shown that patients with a normal or near normal SPECT MPI are statistically at extremely low shot-term risk for a lethal event. Thus, provided there is no change in clinical symptoms, a normal or low-risk MPI using SPECT, and presumably also with positron emission tomography (PET) that provides higher diagnostic accuracy and additional ability with quantitative blood flow to exclude high-risk disease, can reasonably exclude the threat of a lethal arrhythmia in the near future.
Once the presence of CAD is established by MPI or other methods, life-threatening ventricular arrhythmias in patients with normal LV function are often the end result of acute cardiac ischemia caused by an acute coronary syndrome. Thus, molecular imaging of atherosclerotic plaque biology may be another approach to identify high-risk patients. As discussed in Chapter 12 , multiple radiotracers targeting different aspects of plaque biology have been successfully used in the identification of at-risk patients, especially when combined with coronary CT angiography (CCTA) and, to a lesser extent, magnetic resonance imaging (MRI).
Case vignette 2: Evaluation of a patient with a nonischemic cardiomyopathies
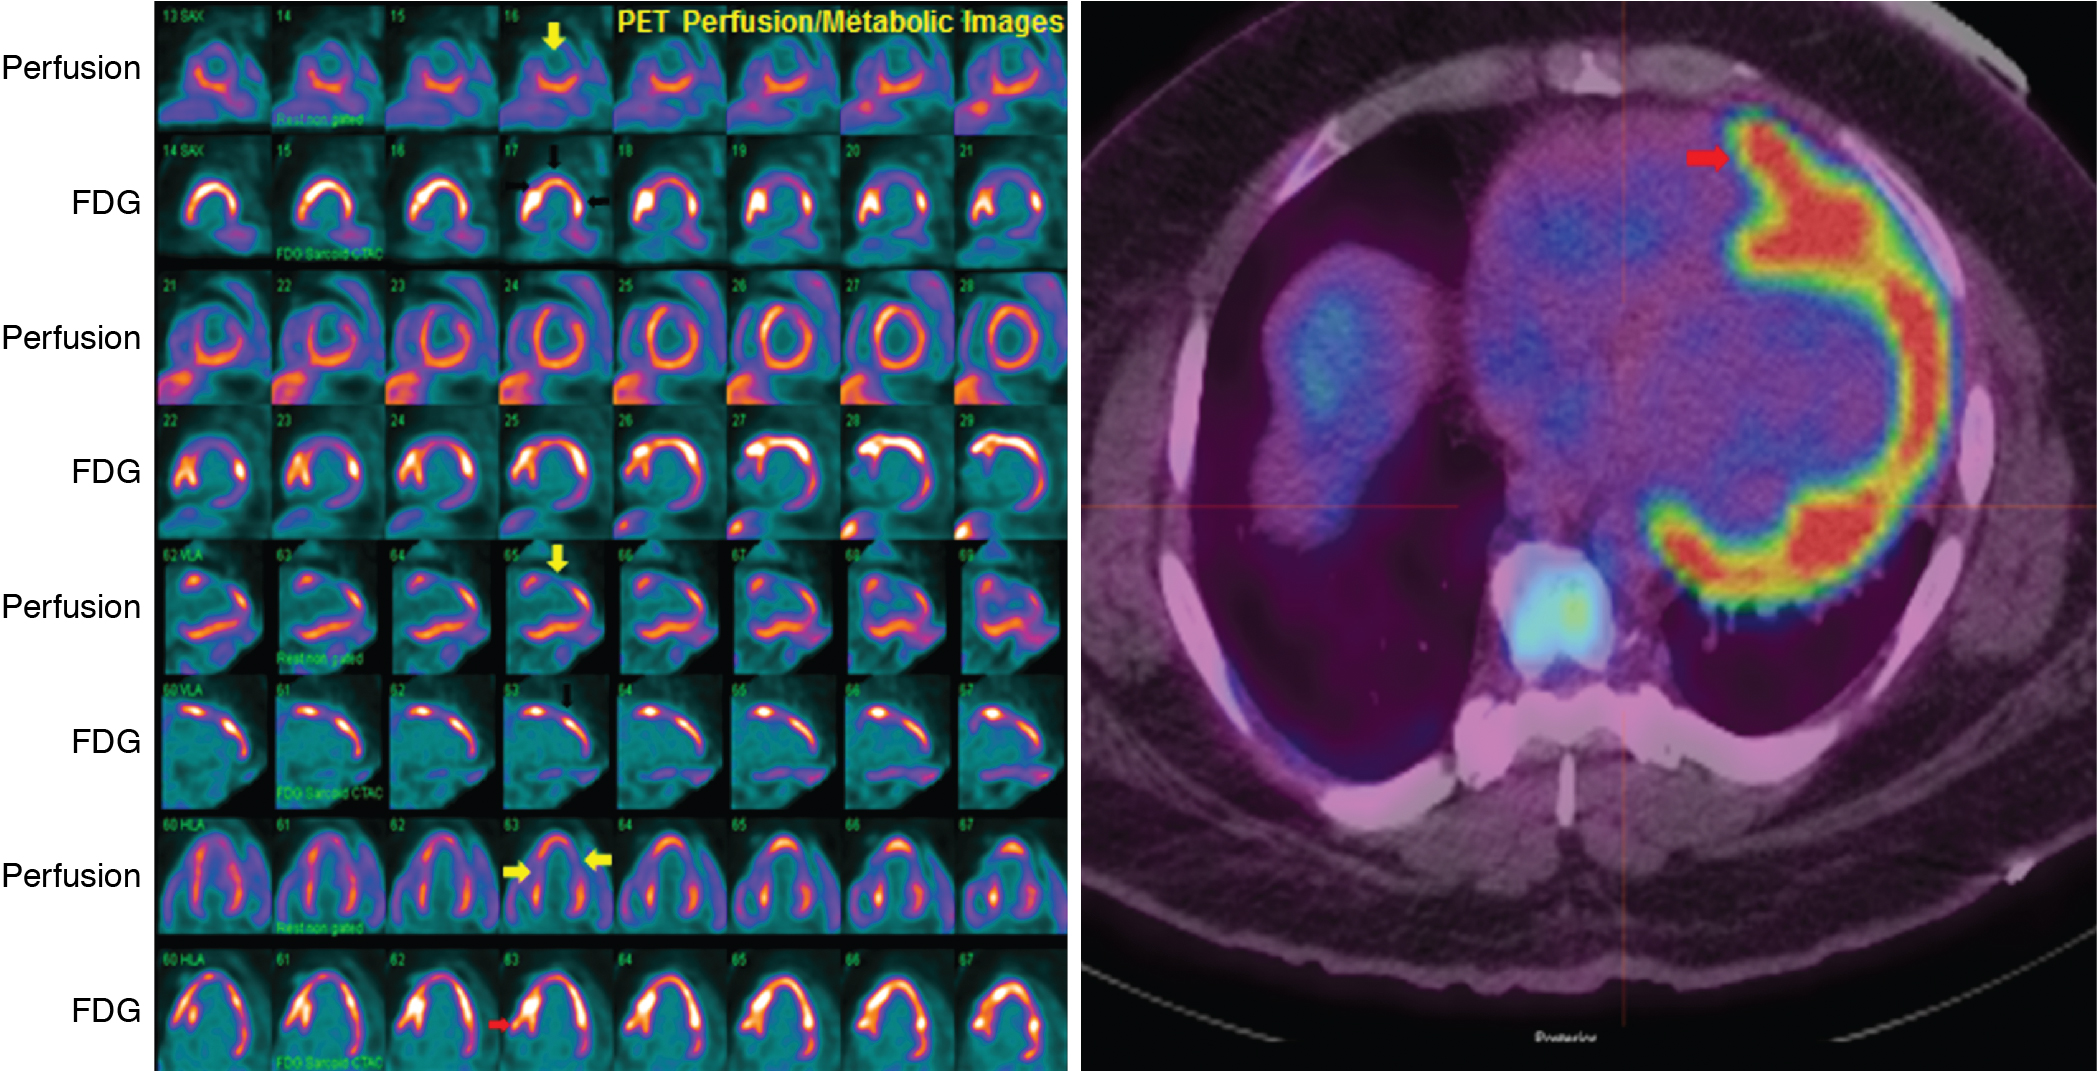
A 51-year-old male with diabetes and hypertension was hospitalized for shortness of breath and diaphoresis and found to be in VT that was quickly cardioverted to sinus rhythm. Two-dimensional echocardiography showed a dilated LV with global hypokinesis and an LVEF of 25%. Invasive CCTA showed no evidence of CAD. A skin biopsy showed findings consistent with sarcoidosis. The patient underwent a cardiac 13 N-ammonia and 18 F-fluorodeoxyglucose (FDG) PET/CT scan to assess for potential active cardiac sarcoidosis ( Fig. 21.3 ). The myocardial perfusion images showed a large and severe perfusion defect involving the mid anterior wall and extending to the anteroseptal and the distal lateral walls. The FDG images showed intense glucose uptake in all hypoperfused LV segments (perfusion-FDG mismatch) and also involving the anterior portion of the right ventricular free wall. In the absence of angiographic CAD, these findings were interpreted as severe myocardial inflammation, likely reflecting active cardiac sarcoidosis. The patient underwent ICD placement and also received immunosuppressive therapy.
Case vignette 3: Evaluation of a patient with a nonischemic cardiomyopathies
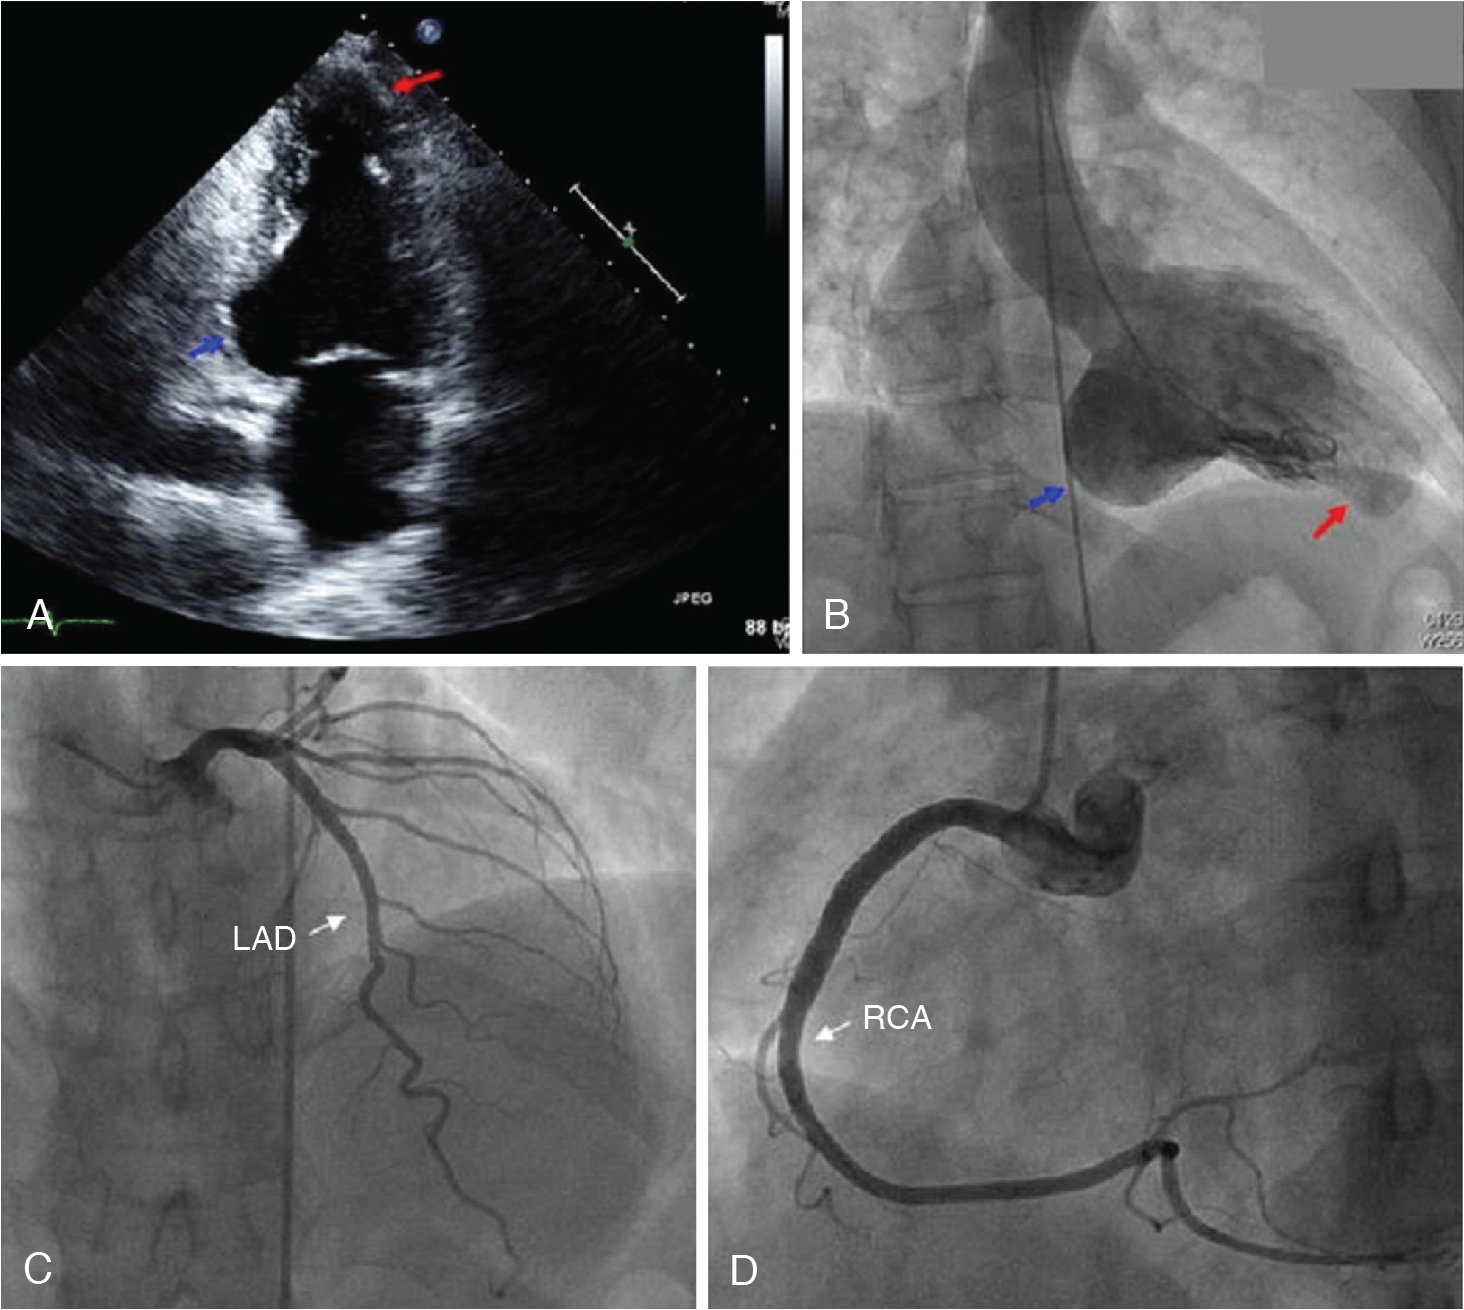
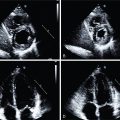
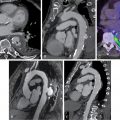
A 51-year-old female from Central America presented with a nonischemic cardiomyopathy, with echocardiography showing akinetic ballooning of the LV apex and the basal inferolateral wall and an LVEF of 35% ( Fig. 21.4 A and B). The troponin T was elevated (0.13 ng/mL), and the ECG showed ventricular ectopy and right bundle branch block. Coronary angiography revealed normal coronary arteries (see Fig. 21.4 C and D). A month after presentation, the patient had a syncopal episode, and a subsequent Holter monitor showed episodes of fast polymorphic VT. Cardiac MRI confirmed the presence of aneurysms of the LV apex and basal inferior/inferolateral wall. There was late gadolinium enhancement (LGE) in the apical aneurysm, the basal inferior/inferolateral wall, and throughout other regions of the myocardium but particularly in the midlateral wall (see Fig. 21.4 F). Although cardiac sarcoidosis was considered, the possibility of Chagas cardiomyopathy was also proposed. The patient underwent a cardiac 13 N-ammonia and FDG PET study (see Fig. 21.4 E). The myocardial perfusion images showed small and severe perfusion defects involving the LV apex, with associated periapical FDG uptake (mixed pattern of perfusion FDG match and mismatch). In addition, there was a small and severe perfusion defect in the basal lateral wall with increased FDG uptake (perfusion-FDG mismatch). The focal areas of increased FDG uptake were adjacent to the regions showing LGE on MRI. A subsequent immunoglobulin G (IgG)-immunofluorescence assay for Trypanosoma cruzi was positive and the diagnosis of Chagas cardiomyopathy was established. An ICD was placed.
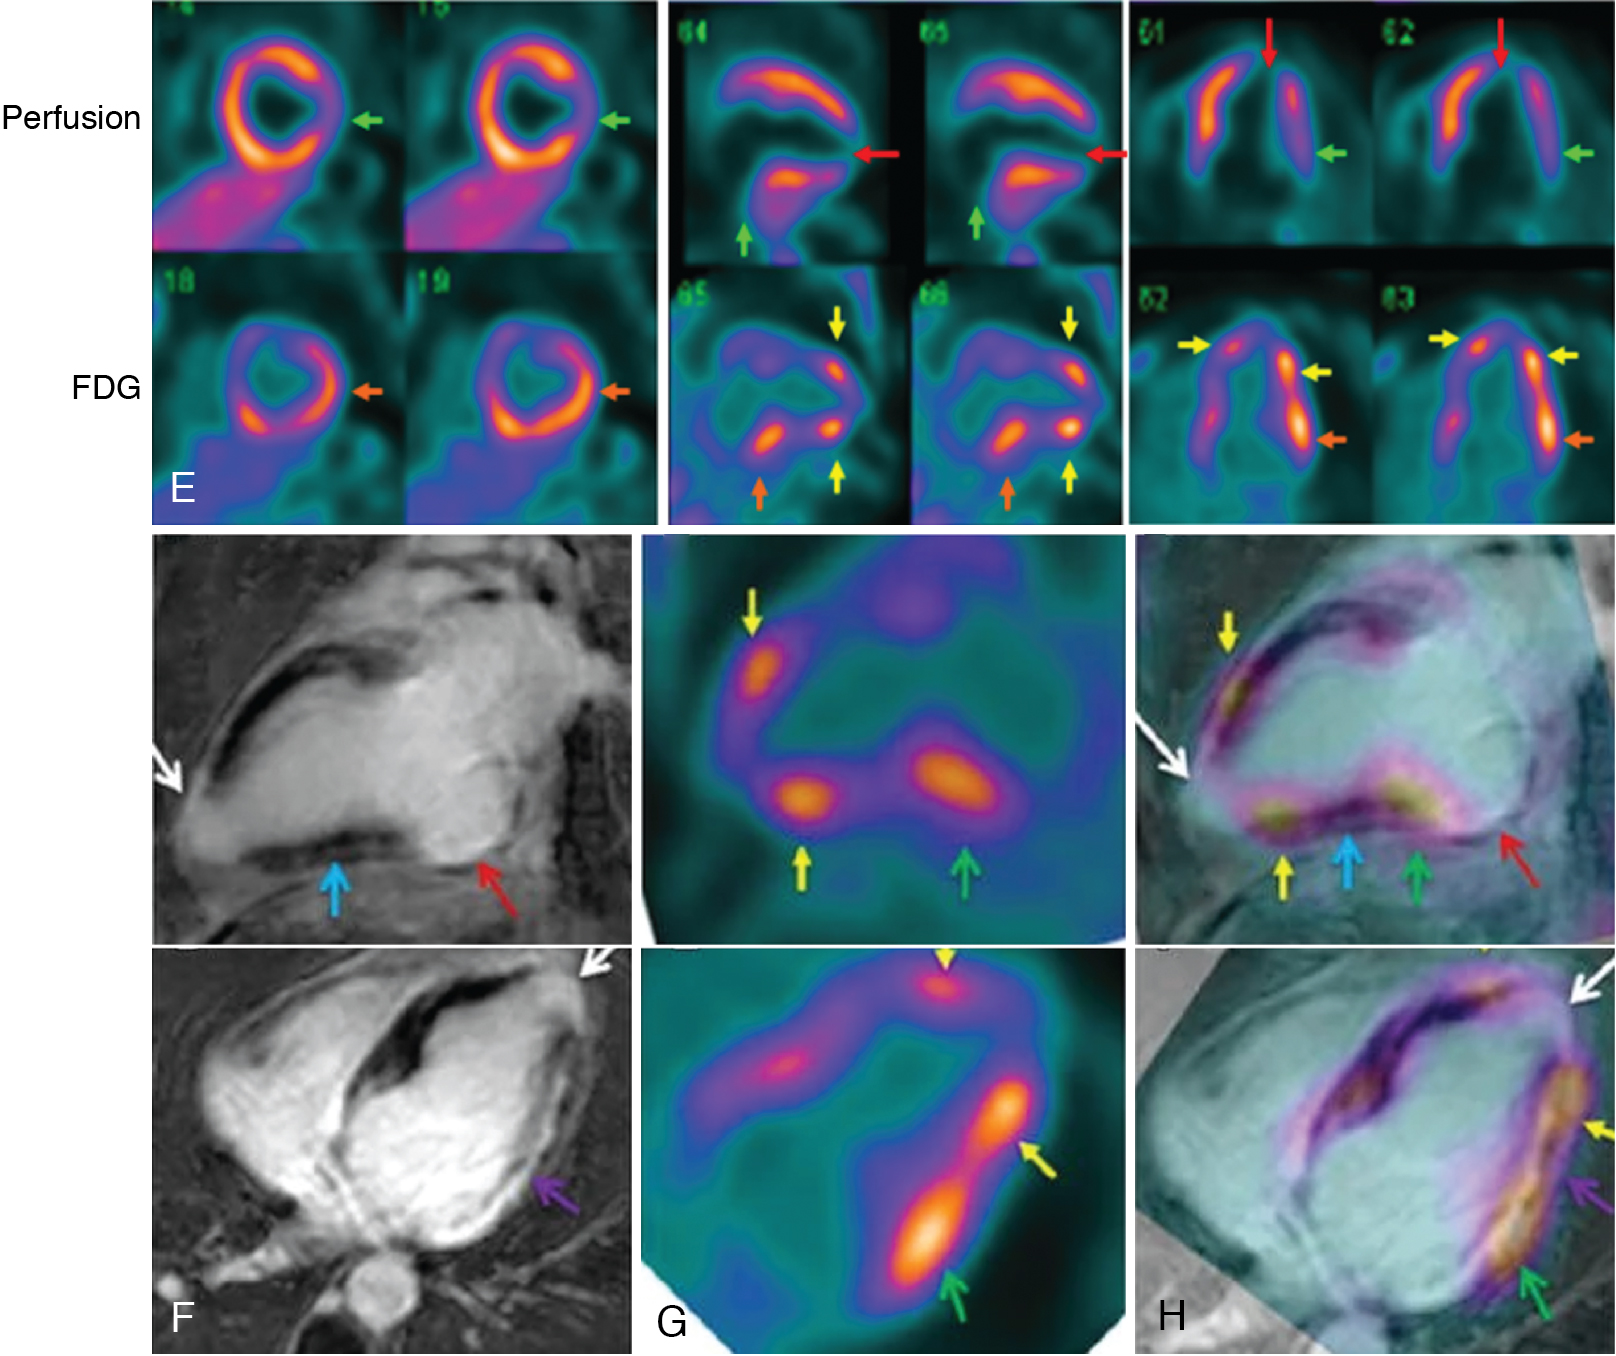
Inflammatory cardiomyopathies are frequently associated with ventricular arrhythmias. Ascertaining the presence and severity of myocardial inflammation can help guide diagnosis and management, as illustrated in these cases. Although cardiac sarcoidosis was previously thought of as a rare disease, its prevalence appears to be increasing, especially in young individuals. Although the morbidity and mortality from sarcoidosis, often from pulmonary manifestations, has been well understood, it has only recently been recognized that there is frequent presence of cardiac involvement that results in high mortality. The reported presence of cardiac clinical manifestations had been less than 10%, but more recently, autopsy has found cardiac involvement in 20% of US sarcoidosis cases and 50% of Japanese patients. Cardiac magnetic resonance (CMR) imaging work has shown cardiac LGE in 25% to 30% of people with sarcoidosis. As the initial presence of cardiac involvement by sarcoidosis can be sudden arrhythmic cardiac death, it is important to identify and institute appropriate therapies, especially an ICD. In addition, there is evidence that a lessening in the extent and severity of cardiac 18 F-FDG uptake in response to medical therapy is associated with improved cardiac function and symptoms. The role of radionuclide imaging in the diagnosis and management of cardiac sarcoidosis is discussed in detail in Chapter 23 . Case Vignette 3 demonstrates that the perfusion-metabolic imaging pattern in Chagas cardiomyopathy shares many similarities with cardiac sarcoidosis because it is difficult to distinguish these two entities. Consequently, differential diagnosis must rely on other ancillary data, such as serology in this case.
Association of LV remodeling, mechanical dyssynchrony, and ventricular arrhythmias
LV remodeling, characterized by LV dilatation, with alterations in LV geometry and contractility, including aneurysmal dyskinesis, is highly prevalent in patients with HF in both ischemic and nonischemic cardiomyopathies and is associated with the highest risk for ventricular arrhythmias. LV remodeling is potentiated by myocyte hypertrophy; cell death from necrosis and apoptosis; increased interstitial collagen; and scarring, which are central to the pathogenesis of ischemic and nonischemic cardiomyopathy. In this regard, LV geometry and volumes have been shown to be predictive of composite cardiovascular outcomes, including SCA. , Morishima et al. assessed the value of multiple metrics of LV remodeling for predicting lethal arrhythmic events (sustained VT, ventricular fibrillation [VF], or SCD) in post-MI patients with an LVEF less than or equal to 30%. In this retrospective study, SPECT-based assessment of LV volumes were significantly greater among those experiencing arrhythmic events (n = 14). Severely increased LV systolic and diastolic volumes were significant predictors of events with risk ratios of 3.44 and 3.96 for indexed LV systolic and diastolic volumes, respectively, but LVEF was not a predictor. The independent predictive value of LV volumes for specifically predicting SCA was confirmed in a more systematic prospective study of patients with ischemic cardiomyopathy and LVEF equal to or less than 35% LV volumes.
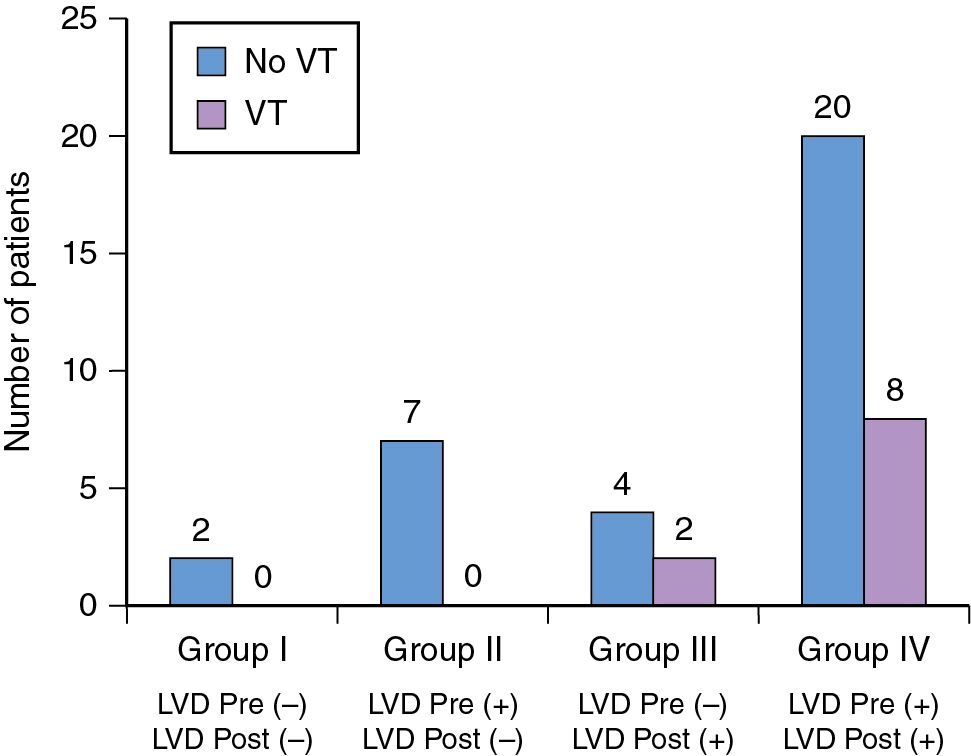
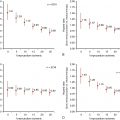
An important feature of LV remodeling is disorganized myocardial contractility, also referred to as mechanical dyssynchrony. The exact pathophysiologic mechanisms resulting in the generation of LV dyssynchrony are poorly understood, although they are believed to stem from a combination of abnormal myocardial milieu: systolic dysfunction, electrical abnormalities, myocardial scar burden, and ventricular dilatation. Although LV dyssynchrony in HF patients is not typically viewed as a predictor of arrhythmogenesis, patients with improved LV contractility after cardiac resynchronization therapy (CRT) have been shown to have a significantly lower burden of arrhythmic events versus those who continue to have severely reduced LVEF. , These early observations fueled the systematic evaluation of the role of LV dyssynchrony in arrhythmogenesis. Initial studies using speckle tracking echocardiography showed a greater occurrence of appropriate ICD therapy among those with greater LV dyssynchrony (higher standard deviation of time to peak myocardial shortening among 16 LV segments). Subsequently, LV dyssynchrony on speckle tracking echocardiography was reported to be an independent predictor of appropriate ICD therapy among patients with ischemic cardiomyopathy and a primary prevention ICD (hazard ratio [HR], 95% confidence interval [CI]: 1.12, 1.07 to 1.18). Likewise, a recent study of 187 patients with primary prevention ICD reported the association of VT (appropriate ICD therapy) with the presence or absence of LV dyssynchrony on gated SPECT. LV dyssynchrony was assessed from ECG-gated SPECT performed before ICD implantation and was noted to be present in 78% of the cohort. During an average follow-up time of 12 months, 48 patients had VT and 98% of those who experienced VT had LV dyssynchrony, conferring a 98% negative predictive value for LV dyssynchrony. Patients without LV dyssynchrony had an improved survival free of sustained and nonsustained VT (HR, 95% CI: 4.90, 2.12 to 11.20; p < 0.0001). LVEF was not an independent predictor of VT in this study. Although these findings suggest a potential role for LV dyssynchrony to stratify arrhythmic risk, recent evidence suggests that reduction in LV dyssynchrony may also offer protection from lethal arrhythmias. A subanalysis of the Multicenter Automatic Defibrillator Implantation Trial with Cardiac Resynchronization Therapy (MADIT-CRT) study specifically evaluated the relationship between changes in LV dyssynchrony after CRT and occurrence of appropriate ICD therapy. LV dyssynchrony was assessed as the standard deviation of regional time-to-peak transverse strain, measured in 12 LV segments from the apical four- and two-chamber views. Among 1077 patients, 209 patients experienced arrhythmic events, and improvement in LV dyssynchrony over 1 year was associated with a significantly lower incidence of arrhythmic events among those with a left bundle branch block (LBBB) receiving CRT-D, compared with those with LBBB receiving ICD alone and those without any improvement or worsening in LV dyssynchrony. In patients with LBBB, a 15% reduction in LV dyssynchrony among those receiving CRT-D was associated with a significantly lower risk for arrhythmic events compared with those only receiving an ICD (HR, 95% CI: 0.30, 0.12 to 0.77; p = 0.009). A gated SPECT study further reported a reduction in the frequency of VT (ICD shock and antitachycardia pacing) with acute change in LV dyssynchrony after CRT among patients with HF and LVEF less than or equal to 35%. Among 43 patients with a clinically indicated biventricular pacemaker, acute change in synchrony was determined before and immediately after CRT, from two separate gated SPECT acquisitions. A minority of the patients had no LV dyssynchrony before and after CRT and experienced no VT. Among those with resolution of LV dyssynchrony post-CRT, there were not arrhythmic events. Conversely, patients in whom dyssynchrony was induced after CRT had a similar occurrence of VT as those in whom dyssynchrony continued to persist before and after CRT ( Fig. 21.5 ). Thus, observational data suggest a strong relationship between LV dyssynchrony with clinically significant ventricular arrhythmic events. Although improvement or amelioration of LV dyssynchrony seems to confer protection against VT, induction of LV dyssynchrony in previously synchronous ventricles has a similar risk for VT compared with ventricles that have persistent dyssynchrony, as seen in ineffective CRT. Information on LV dyssynchrony can be readily obtained from routinely acquired gated SPECT, and phase analysis of SPECT is now a standard feature in several commercially available software.
Related posts:
 Radiopharmaceuticals for clinical SPECT and PET and imaging protocols
 Imaging in patients with acute chest pain in the emergency department
 Key concepts in risk stratification and cost-effectiveness using nuclear scintigraphy in stable coronary artery disease
 Molecular imaging of myocardial infarction and remodeling
 Artificial intelligence in nuclear cardiology
 Large-vessel vasculitis
Stay updated, free articles. Join our Telegram channel

Full access? Get Clinical Tree


