Background
For decades, positron emission tomography (PET) imaging was largely limited to use in research. The development of dedicated PET cameras, the widespread expansion of cyclotron production facilities, and the approval of new radiopharmaceuticals have all contributed to the dramatic growth of clinical PET in recent years. PET agents often incorporate radioactive isotopes of atoms normally present in organic substances (e.g., oxygen-15, nitrogen-13, carbon-11, and the hydroxyl analog, fluorine-18) and thus can image cellular or molecular processes that are otherwise difficult to image. Several different PET applications are clinically available ( Box 12.1 ). However, most clinical PET imaging is currently done with the glucose analog F-18 fluorodeoxyglucose (F-18 FDG) for the evaluation of cancer. Malignant cells are usually more metabolically active than normal tissues and tend to accumulate higher levels of glucose, which is reflected in increased radiopharmaceutical uptake.
F-18 Fluorine Deoxyglucose (F-18 FDG)
Cancer: Staging, restaging, therapy monitoring
Lung nodule diagnosis/characterization, localization of cancer of unknown primary
Dementia imaging
Seizures (interictal)
Cardiac: Viability, sarcoidosis
F-18 Florbetaben/F-18 Florbetapir/F-18 Flutemetamol: Detection of Amyloid
Rubidium-82 (Rb-82): Cardiac perfusion
Ammonia N-13: Cardiac perfusion
F-18 fluciclovine: Prostate cancer recurrence, metastasis
Gallium-68 prostate-specific membrane antigen (Ga-68 PMSA): Prostate cancer recurrence
Ga-68 DOTATE or DOTATOC: Neuroendocrine/somatostatin-receptor tumor imaging
F-18 sodium fluoride: Bone metastases and tumors
PET, Positron emission tomography.
Functional imaging with PET can provide substantially different information than conventional modalities, such as computed tomography (CT). Because CT relies on changes in size and architecture to diagnose malignancy, sensitivity and specificity are limited. For example, in patients with cancer, enlarged lymph nodes are assumed to harbor malignancy, whereas nodes of normal size are characterized as benign. This can result in errors when adenopathy occurs from infection or when early metastases are present in small lymph nodes. In addition, the results of therapy can be difficult to determine because masses may change in size slowly or not at all, and residual or recurrent disease can be obscured by radiation or postsurgical scar distortion of normal tissues. Use of F-18 FDG, on the other hand, permits metabolic activity to be monitored serially, with quantitative and semiquantitative analysis helping to better characterize lesions and predict therapy outcome.
One limitation of PET is the lack of anatomical detail in the images. Normal uptake in structures such as the bowel, muscles, and ureters can be mistaken for tumor. Therefore, correlation with CT or magnetic resonance (MR) is critical for proper image interpretation. Differences in positioning between the two scans are minimized when studies are performed on a dedicated PET camera combining the CT or magnetic resonance imaging (MRI) scanner in a single hybrid PET/CT or PET/MR device.
F-18 FDG PET/CT has become a key component in tumor evaluation and significantly affects patient care. This was shown by data obtained during the National Oncologic PET Registry (NOPR) established by the U.S. Centers for Medicare and Medicaid Services (CMS) to gather evidence to help determine when payment would be authorized. Findings from the NOPR trial were impressive, with PET found to alter patient management in 36.5% of cases. Changes included redirecting biopsy, avoiding surgery (after upstaging a patient), changing the overall treatment goal or causing a major change in therapy, and detecting additional primary malignancies (Coleman et al. 2010; Hilner et al. 2008). Based on the success of the NOPR trial, F-18 FDG PET/CT reimbursement was approved for most solid tumors.
Radiopharmaceuticals
Physical Properties
In positron radioactive decay, a positron ( β + ) ejected from the atom travels a short distance before meeting a negative particle (electron) and undergoing annihilation. The resulting two 511-keV photons travel at 180 degrees from each other. These high-energy photons do not interact well with routine gamma cameras but are optimally detected by the specialized ring of detectors in a PET camera. Photons received within a short enough time interval at opposing detectors are registered as “coincidence photons,” or those originating from the same decay event. The result is a superior image to those achieved with gamma camera single-photon studies (e.g., with technetium-99m–labeled agents).
Many PET-emitting isotopes have very short half-lives (T 1/2 ), requiring a cyclotron to be in extremely close proximity. The 109.7-minute T 1/2 of F-18 means it can be shipped from local and even regional production facilities. On the other hand, the T 1/2 is not excessively long, and radiation exposure is lower than many agents with longer-lived radiolabels. Dosimetry information is outlined in Appendix 1 .
Kinetics and Distribution
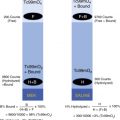
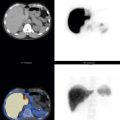
In malignant cells, increased expression of membrane glucose transporters (e.g., glut-1) results in higher levels of intracellular glucose. Within these cells, the levels of hexokinase (hexokinase II) activity are also increased, phosphorylating glucose, which then moves through the glycolysis pathway. F-18 FDG is taken into the cell and phosphorylated by the same mechanisms as glucose, but F-18 FDG cannot be metabolized further ( Fig. 12.1 ). In addition, due to the lower levels of glucose-6-phosphatase in cancer cells, FDG remains effectively trapped because phosphorylated FDG cannot diffuse back across the membrane. The normal distribution of F-18 FDG is shown in Figs. 12.2 and 12.3 .


F-18 FDG Oncology Protocol
PET/CT Imaging
Many factors affect F-18 FDG uptake, distribution, and clearance. Table 12.1 outlines different causes for altered F-18 FDG distribution in tissues. Measures are required to optimize tumor-to-background radiotracer uptake, making patient preparation and scheduling complex. An example protocol is listed in Box 12.2 . PET/CT scheduling is often complicated by factors that alter F-18 FDG distribution, and some recommendations on PET scheduling modifications are outlined in Table 12.2 .
| Increased Uptake | Decreased Uptake |
|---|---|
| High-grade malignancy | Benign lesion Indolent or low-grade tumor |
| Highly cellular lesion | Low cellularity: mucinous, cystic/fluid filled |
| Increased patient body mass/weight | Lesion:
|
| Infection, abscess | Scar, chronic fibrosis |
| Increased vascularity, inflammation | Prior chemotherapy |
| Trauma, surgery | Attenuation: breast implant or metal |
| Radiation (acute) | Radiation (delayed) |
Patient Preparation
Avoid exercise for 1 to 2 days.
Diabetes: Serum glucose controlled
Insulin: Stop long-acting insulin 8 to 12 hours before scan; no short-acting insulin within 2 hours of injection.
Oral metformin (Glucophage): May continue
If colon is area of concern, consider holding 48 hours if serum glucose can be controlled otherwise.
Hydrate patient orally.
NPO except water for 4 to 6 hours; avoid carbohydrates 6 to 24 hours prior; no caffeine.
Check serum glucose before dosing (<200 mg/dL).
Patient kept warm, quiet, and relaxed for 30 to 60 minutes before injection.
Consider sedation (diazepam, benzodiazepine) for claustrophobia, anxiety or tense muscles, or prior head and neck surgery.
Prior brown-fat uptake: Warming the patient is best.
Alternative: 5 mg intravenous (IV) diazepam 10 minutes prior or 80 mg oral propranolol 2 hours prior
Radiopharmaceutical
Adult: 8 mCi F-18 FDG IV [5–12 mCi (185–444 MBq)]
0.09 mCi/kg (3.2 MBq/kg) to 0.14 mCi/kg (5.3 MBq/kg)
Child: 0.10 mCi/kg (3.7 MBq/kg), minimum 1.0 mCi (37 MBq)
Wait (quiet, inactive) 50 to 65 minutes.
Void bladder immediately before imaging.
Image Acquisition
Patient supine
Field of view: 80 to 90 cm (varies by patient size and camera manufacturer, 50–90 cm for PET/CT)
CT transmission scan (varies):
Scout: Determine bed/slice positioning and automatic CT exposure settings 5 mAs.
Localizing (PET/CT): mAs automatic tube modulation (max 125 mAs), 100 kVp (70–120 kVp)
CTDI: 3 to 7 mGy (arms down slightly higher)
Diagnostic: 80 to 300 mAs; 100 to 140 kVp (e.g., 100 kVp in chest)
CTDI: 10 to 15 mGy
PET emission scan: TOF scanner 1 to 4 minutes/bed position; non-TOF 5 to 10 minutes/position
Processing: Iterative reconstruction, 128 × 128 or 256 × 256 matrix, pixel size typically 2 to 4 mm
CT, Computed tomography; CTDI, computed tomography dose index; PET/CT, positron emission tomography with computed tomography; TOF, time of flight.
| History | Course of Action |
|---|---|
| Prior surgery | Delay scan 4 weeks (2–6 weeks). |
| Chemotherapy | Delay scan 6–8 weeks posttherapy (minimum 3 weeks) or schedule just before next cycle. |
| Radiation therapy | Delay scan ≥ 3 months. |
| Colony-stimulating drugs | Consider scan delay of 1 week for short-acting drugs or several weeks for long-acting drugs. |
| Serum glucose | Reschedule until controlled (<200 mg/dL). |
| Insulin administration | Wait 2 hours for short-acting insulin or 8–12 hours for long-acting insulin. Turn off insulin pump for 4–6 hours. |
| Breastfeeding | Discontinue for at least 6 hours postexamination. |
| Prior brown-fat activity | Warm patient for 30–60 minutes before injection; consider medication if ineffective. |
Patient Preparation
Because glucose competes with F-18 FDG for uptake, the patient’s glucose level should be checked before injection. The upper-limit cutoff varies among institutions, but a value under 200 mg/dL is generally considered acceptable.
Insulin, whether endogenously released in response to a meal or following administration to diabetics, stimulates the glucose transporters (e.g., glut-1), which are highly expressed in muscle cell membranes. This dramatically increases muscle uptake ( Fig. 12.4 ), thereby potentially decreasing uptake in tumor. To minimize the impact, patients fast overnight or for at least 4 to 6 hours before injection and avoid carbohydrates in the meal (or even the day) before injection. Patients with diabetes should not be given short-acting insulin within 2 hours of radiotracer injection, and long-acting insulin should be held overnight. The scan must be carefully scheduled because it may be difficult to coordinate with the diabetic patient’s serum glucose levels, which can fluctuate widely over the course of the day. When this is the case, optimal times often include early morning, before eating or taking insulin, and early afternoon, with the patient fasting after eating a light early breakfast and taking the morning short-acting insulin dose. For non–insulin-dependent diabetics taking the medication metformin, consideration should be given to withholding it for 1 to 2 days because metformin has been shown to dramatically increase uptake in the bowel.

Muscle activity is also minimized by limiting vigorous exercise for 1 to 2 days before the examination, and sedatives (e.g., alprazolam oral 0.5 mg) are routinely administered for patients with head and neck cancer who have undergone surgery in the past, helping to prevent frequently problematic increased background muscle activity.
Dose Administration and Uptake
Administered doses of F-18 FDG have been steadily decreased over the years. With the introduction of improved camera technology, such as time-of-flight (TOF) detection, typical doses are on the order of 7 to 8 mCi (259–296 MBq), up to half that used with the previous-generation scanners.
Patients should remain completely still and quiet for the uptake period, which is usually 50 to 65 minutes to achieve the optimum target-to-background ratio balanced with the physical decay T 1/2 . Some studies have suggested that additional delayed images at 90 to 120 minutes may improve sensitivity and specificity because tumors tend to continue accumulating F-18 FDG while activity continues to decrease from other tissues and benign processes. In the case of astrocytomas, which are especially difficult to image with F-18 FDG, an even greater interval (on the order of hours) may increase the accuracy. However, prolonged waiting periods are not generally practical in the clinic. Whatever delay is used, subsequent studies should be performed in a consistent manner to be certain that the changes seen are not artificially created.
PET/CT Scan Acquisition
Patients are usually imaged in the supine position after bladder voiding. Because CT artifact occurs when the arms are in the field of view, they are most often placed above the head when the pathology is in the chest, abdomen, and pelvis but left at the patient’s side when the tumor is in the head and neck.
The study is acquired in two phases. First, a transmission scan is performed using an external radiation source for attenuation correction. Originally, radiation sources (e.g., germanium-68 or cesium-137 rods) rotated around the patient, requiring several minutes. CT radiography, on the other hand, requires only seconds to cover the entire body. Based on the interactions of the x-ray photons with tissues, an attenuation-correction map is built and applied to the photons detected from the patient during the second phase of imaging, the emission PET scan. Attenuation correction allows PET data to be displayed with the proper intensity and is necessary for quantification of activity. The emission scan is acquired as a series of partially overlapping blocks of data, or bed positions, as the patient is moved through the camera. The scan time for each bed position can be modified depending on the patient’s body habitus but is typically a couple of minutes on modern TOF scanners, nearly half that of previous-generation scanners. Traditionally, a whole-body PET/CT refers to a scan extending from skull base to midthigh, although studies can include the extremities and brain, depending on the situation.
Although most PET/CT studies are performed without intravenous CT contrast, its use has been increasing because it helps identify normal structures and makes pathology more conspicuous. Water can be used to distend the stomach and duodenum. Dilute oral or water-equivalent negative oral contrast are also acceptable. Attenuation correction can help overcome any questions or artifacts if dense contrast builds up, causing artificially elevated counts.
Displays include a three-dimensional maximum-intensity projection (MIP) image and sagittal, coronal, and axial fused and unfused slices. Software can fuse PET images to CT scans performed at other times or to an MR image if desired. If the examination was performed on a dedicated PET/MR camera, it is still advisable to compare the study to a recent CT in order to visualize some abnormalities, such as small lung nodules.
Dedicated PET/MR
Although dedicated PET/MR scanners are still primarily a research tool, they are increasingly being utilized clinically. By eliminating the CT component, patient radiation exposure may be decreased by 50% to 70%, with the benefit of superior soft tissue characterization ( Fig. 12.5 ). However, hybrid PET/MR scanners have a relatively small central bore, and examinations are much longer than PET/CT; thus, some patients may not tolerate the examination due to claustrophobia and positioning difficulties ( Box 12.3 ). Before scheduling an examination, the patient should be prescreened for MR contraindications, the most important being metallic foreign bodies, implants, or devices.

Patient Preparation
Follow preparation guidelines for PET/CT.
Before arrival, screen for:
Metal implants/implantable devices, fragments, or foreign bodies
Assess the safety of the specific device model and serial number (resources include http://www.mrisafety.com ).
Claustrophobia, difficulty caused by body habitus given smaller scanner bore size
Radiopharmaceuticals
Follow guidelines for PET/CT.
Acquisition
Whole-body localizing scan
MR sequences for whole-body simultaneous PET and MR acquisition:
- 1.
MR attenuation correction (MRAC):
- •
Coronal isotropic fast T1-weighted three-dimensional (3D) 2-point Dixon sequence
- •
For segmentation: spoiled 3D GRE (e.g., VIBE, LAVA)
- •
Display in fat-only, water-only, in-phase, and opposed-phase sequences
- •
- 2.
Coronal (and/or) axial T2: SS-SFE or HASTE
- •
Instead, some sites still use alternate fast sequences:
- •
STIR, with its uniform fat suppression, and radial fast spine echo imaging (PROPELLER, BLADE), which helps create motion-free image during free breathing
- •
- 3.
Additional options:
- •
Fast T1(VIBE or LAVA) whole-body coronal—for bone lesions fat-saturation sequences
- •
T1 postgadolinium contrast: whole body for myeloma or regional for other disease
- •
Small FOV in areas of concern, such as female pelvis (depending on disease)
- •
Axial or coronal DWI with two b -values
- •
Dedicated T2-weighted sequences for chest and/or liver regions
- •
May use respiratory gating
- •
Regional MR scans: With/without contrast as indicated; scans/ADC map with high B values may minimize need or replace contrast images for some purposes, such as marrow evaluation in myeloma
- •
ADC, Apparent diffusion coefficient; FOV, field of view; DWI, diffusion-weighted imaging; GRE, gradient echo; HASTE, half-Fourier acquisition single-shot turbo spin echo; LAVA, liver acquisition with volume acceleration; MR, magnetic resonance; PET, positron emission tomography; PET/CT, positron emission tomography with computed tomography; PET/MR, positron emission tomography with magnetic resonance; SS-SFE, single-shot fast spin echo; STIR, short-tau inversion recovery sequence; VIBE, volumetric interpolated breath-hold examination.
Because the MR signal is based on proton density and not beam attenuation, attenuation correction needed for standardized uptake value (SUV) calculations is challenging. MR attenuation correction (MRAC) is only possible with a limited number of sequences. Most often, a two-point three-dimensional (3D) isotropic Dixon T1-weighted (T1W) sequence is used for a process called segmentation attenuation correction. Four components are identified: fat, soft tissue, lung, and air. MRAC maps built from this are then applied. This process does not fully compensate for cortical bone, and artifacts can result, especially in the skull base. Methods such as an atlas-based attenuation-correction algorithm are likely a better option when imaging the brain. The SUV measurements generated from the MRAC-corrected PET/MR data may vary significantly from those obtained using PET/CT. Therefore, direct comparison is not advised.
The Dixon sequence data can be reconstructed, fused to MR, and displayed as fat-weighted, water-weighted, in-phase, and opposed-phase sequences. Although these may be sufficient for some purposes, spatial resolution is lower than from standard MR sequences. Most sites will routinely obtain additional free-breathing whole-body axial and/or coronal T2-weighted (T2W) images done with a fast technique such as the more rapid single-shot spin echo (single-shot fast spin echo [SS-FSE], single-shot turbo spin echo [SSh-TSE], or half-Fourier acquisition single-shot turbo spin echo [HASTE] depending on vendor). These images will demonstrate higher-quality anatomical resolution and tissue contrast, as well as better visualization of pathology, than can be seen with the MRAC data alone and can be completed perhaps 75% faster than standard sequences. Any additional sequences must be carefully considered in terms of the overall examination length, especially if a dedicated regional MR is also required.
Image Interpretation
Normal F-18 FDG Distribution
The brain is an obligate glucose user, so uptake is normally very high. The kidneys, ureters, and bladder also show intense activity from excreted radiotracer in urine. Moderate activity should be seen in the liver, mildly greater than the mediastinal background, and the spleen should be less intense than the liver. Bone marrow accumulation is normally low. Variable activity is seen in the bowel, muscle, heart, salivary glands, tonsils, testes, and uterus.
Pharyngeal and Parapharyngeal
Mild activity is normally present in the salivary glands. Marked uptake is often seen in oropharyngeal lymphoid tissue, including the palatine and lingual tonsils. Asymmetry can occur normally or as the result of therapy and inflammation but may make the evaluation for tumor more difficult. Diffuse marked uptake is often seen in the vocal cords and oropharynx and is increased from speaking. In vocal cord paralysis, unilateral uptake may occur in the normal vocal cord, along with decreased activity in the contralateral abnormal vocal cord ( Fig. 12.6 ).

Myocardial Metabolism
Minimizing cardiac activity is desirable when evaluating cancer. The myocardium uses glucose as an optional fuel source. In a fasting state, fatty acid metabolism dominates over glycolysis, leading to decreased FDG uptake. However, fasting yields inconsistent results, and significant cardiac uptake is seen in up to 50% of fasting patients, often very heterogeneous in the left ventricle. Glucose loading, such as done for a cardiac viability study, increases glycolysis and, therefore, FDG uptake. Benign, fairly intense activity is occasionally seen in the intraatrial septal fat.
Urinary Excretion
Activity in excreted urine can create interpretation difficulties. Although the ureters usually appear as long, tubular structures, they can be seen as very focal areas of activity that may be confused with tumor or lymph node metastasis. Correlation with CT and MIP images can help confirm ureter activity or rule out a soft tissue lesion. In addition, activity in the filling bladder can obscure lesions in the pelvis, and urine contamination on the skin may be difficult to differentiate from an actual superficial lesion.
Gastrointestinal Tract
The esophagus normally shows no significant uptake. Nonspecific focal or more diffuse activity could be due to inflammation from reflux. In general, this is less than that seen with cancer or acute radiation. Significant activity in the stomach, especially when collapsed, can limit the usefulness of F-18 FDG in the evaluation of gastric adenocarcinoma or lymphoma. Highly variable activity in both the small and large bowel is especially problematic because it may obscure tumor in the bowel and mesentery. Focal transient activity is frequently seen in the small bowel, possibly the result of lymphoid tissue uptake. Marked uptake in the bowel can occur from metformin. Inflammation, such as from colitis, inflammatory bowel disease, appendicitis, and diverticulitis, can cause radiotracer accumulation ( Fig. 12.7 ). However, these diseases should cause corresponding changes on CT: fat stranding, inflammatory fluid collections, changes in the bowel wall, and air within forming abscesses.

Reproductive Organs
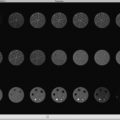
Cyclical changes can be seen normally in the uterus and ovaries in premenopausal women ( Fig. 12.8 ). Uniform, diffuse, mild to moderate endometrial uptake normally occurs, with maximal uptake occurring during menstruation (menstrual cycle days 0–4) and near ovulation (approximately day 14). Activity is lower during proliferative (days 7–13) and secretory (days 15–28) phases. Normal activity can occur in the ovaries related to ovulation and occasionally in association with follicle growth and the development of the corpus luteum cyst. Increased F-18 FDG uptake can be seen in benign uterine leiomyomas and endometrioma. In men, the testes vary widely but often show high-F-18 FDG levels normally.

Benign F-18 FDG Distribution Variants
Thyroid Disease
Thyroid activity is normally low or absent; however, multiple uptake patterns can occur ( Fig. 12.9 ). Diffusely increased uptake may be seen in thyroiditis, radiation thyroiditis, and Graves’ disease. The significance of low-level diffuse activity in patients without identifiable thyroid disease is uncertain; it may be normal or the result of subclinical thyroiditis. Focal uptake can be seen in benign adenomatous nodules. However, focal activity can be the result of malignancy in 30% to 50% of cases, and evaluation with ultrasound is warranted to determine whether a biopsy is needed.

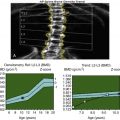
Brown Adipose Tissue Activation
Brown fat (or BAT) plays a role in nonshivering heat generation and can be stimulated by the adrenergic system as well as the cold ( Fig. 12.10 ). It is particularly important in the young but is also occasionally seen in adults. When BAT stimulation is present, F-18 FDG uptake is seen in the fat of the supraclavicular region and neck and occasionally in the upper mediastinum and suprarenal regions. Uptake frequently occurs bilaterally in the region of costovertebral junctions. Sedatives (e.g., lorazepam or diazepam) and beta-adrenergic blockers (e.g., 20 mg oral propranolol) are sometimes used to decrease this uptake, although the effectiveness is variable. Rather, it is generally preferred to keep the patient warm for a period before injection until the examination is complete because this tends to be more effective. In some cases, a scan may have to be repeated because it may be difficult to rule out lymph node involvement such as from lymphoma ( Fig. 12.11 ).


Inflammation, Infection, and Trauma
One of the greatest challenges that arises with F-18 FDG is uptake that occurs in infectious and inflammatory processes, which can be difficult to differentiate from malignancy. In infections, the cause has been attributed to glycolytic activity in leukocytes and the impact of molecules associated with inflammation (e.g., cytokines) on the glut-1 transporters. Infections such as pneumonia will have intense radiotracer accumulation. Inflammatory uptake in a lymph node or mass cannot be reliably differentiated from malignancy. Such findings are commonly problematic in sarcoidosis and granulomatous disease (e.g., histoplasmosis and tuberculosis) in the chest ( Fig. 12.12 and Fig. 12.13 ). Other inflammatory processes in the lungs, such as occupational lung diseases and active interstitial fibrosis and pneumonitis, may also cause markedly abnormal uptake.


Low-level radiotracer can be seen in atherosclerotic plaque and higher levels in arteritis. Mild F-18 FDG may routinely localize to vascular bypass graft walls. However, if more focal intense activity is seen, the CT should be examined for signs of infection or abscess, such as gas, fluid collections, or stranding. Abdominal wall surgical mesh and biliary stents may remain hot indefinitely.
Healing fractures normally accumulate F-18 FDG, but evidence of fracture should be clear on CT ( Fig. 12.14 ). Because PET is more sensitive than CT for bone metastasis, the lack of a fracture on CT could mean the activity is caused by metastatic disease, even if no lytic or blastic CT change is seen. Arthritis can cause increased activity, with activity on both sides of the joint, and increased activity can also be seen around the joint capsule or surrounding soft tissues, with CT fusion helping confirm lack of bone involvement.

Effects of Therapy
Therapy often causes an inflammatory response resulting in increased activity ( Figs. 12.15 and 12.16 ). No definitive rules indicate how long to wait after therapy to perform a PET scan. At times, repeat or even serial imaging is needed to confirm that a change is iatrogenic. Waiting 2 to 4 weeks or so after procedures will help minimize the impact of surgery ( Fig. 12.17 ). Delaying the PET for 2 to 3 months is often recommended after external-beam radiation due to expected acute inflammation and increased uptake. Although this may allow soft tissues to return to background, activity intensifies and often remains high over time in the lungs. However, the pattern of radiation change will mirror the evolution of scarring, with air bronchograms occurring on the CT, and uptake is normally fairly homogeneous if no residual tumor is present ( Fig. 12.18 ). Bones within the radiation port usually show decreased activity after a short interval.


F-18 FDG accumulates in the bone marrow as a result of marrow stimulation from anemia, marrow-stimulating drugs (filgrastim [Neupogen] or epoetin alfa [Procrit]), or certain cancer therapies. This activity may be intense enough to obscure underlying lesions, and although usually more homogeneous than changes from tumor ( Fig. 12.19 ), it can be patchy and asymmetrical, particularly in the long bones. Because the duration of these marrow-stimulating agents is frequently long lasting, it may not be practical to delay a study until their effects subside.

Chemotherapy often causes a lesion to appear to worsen on PET. The impact can be minimized by delaying a study for at least 2 weeks after treatment, but in some cases, a several-week delay or waiting until just before beginning the next chemotherapy cycle is optimal. There is, however, some evidence suggesting that imaging early after chemotherapy can better predict long-term response in certain tumors, most notably in lymphoma. In some cases, therapy causes a change in the thymus, known as thymic rebound, where the normal low-level shield-shaped uptake in the anterior mediastinum in younger patients intensifies and the organ increases in size on CT ( Fig. 12.20 ). It is important not to confuse this with residual active or worsening lymphoma.

Artifacts
When metal or dense-iodinated contrast is present, the attenuation-correction images may mistakenly show increased radiotracer activity around the area ( Fig. 12.21 ). Correlation with CT helps identify the source of such artifacts, and examining the corresponding nonattenuation-correction images will show a significant drop in activity that leads to the correct interpretation. Uptake in tumor or infection, on the other hand, will tend not to decrease on the nonattenuation-correction images ( Fig. 12.22 ).


Hybrid PET/CT systems can generate certain artifacts. One common problem is misregistration of PET and CT images. Often, patients move their head or limbs between the two portions of the examination. Also, because the PET must be acquired in quiet respiration, the CT is usually performed by having the patient stop breathing for a few seconds or while in quiet respiration. Although this minimizes the significant organ shift that would be seen if the CT was done using maximal inspiratory effort, motion and low lung volumes can obscure lesions or make them project in an incorrect location. A well-known example of this can occur in lesions around the diaphragm, such as hepatic metastases that project over lung or rib on the PET due to patient breathing ( Fig. 12.23 ). Motion can additionally decrease lesion intensity as the counts are spread over adjacent voxels. Many systems possess respiratory gating capabilities where image acquisition is triggered only during one portion of the breathing cycle, resulting in decreased motion and improved lesion conspicuity. Because this technology requires extra time and radiation (from added CT slices), it is usually reserved for limited areas containing known smaller lesions ( Fig. 12.24 ).


Patterns of Malignancy
Aggressive tumors usually have greater uptake because of higher levels of metabolic activity. This pattern must be differentiated from the intense activity often seen in infection or after radiation therapy. Low-level activity may be seen in low-grade tumors and tumors with a lower relative number of cells, such as well-differentiated carcinoid and mucinous adenocarcinoma. Malignant pleural effusions most often have low-level F-18 FDG activity, and some are even negative, which may be due to the dispersion of tumor cells in the fluid so that uptake is not detected.
Areas of central necrosis, often seen in large malignant and inflammatory masses, will have diminished F-18 FDG accumulation. By localizing areas of necrosis and differentiating areas of increased activity, PET scans can help direct biopsy for increased sensitivity and more accurate sampling. It may not be possible to differentiate a cavitary infectious process from a necrotic tumor on PET because both will have a cold center and a peripheral rim of increased activity ( Fig. 12.25 ).

Levels of background activity play a role in the detection of malignant lesions. For example, the high background activity of the brain contributes to limited sensitivity for metastatic disease, with perhaps only a third of lesions being visualized. Also, if background uptake is heterogeneous, as may happen in the bowel, liver, or bone marrow, it can make lesion detection more difficult.
Quantification: The Standard Uptake Value
Lesion activity can be described in comparison to contralateral background, blood pool, or liver activity. Areas can be graded as mild, moderate, or marked depending on the level compared with normal structures. However, it is often desirable to use a numerical value, and this is usually done with the standard uptake value, or SUV.
A region of interest (ROI) is drawn around an area or volume of tissue. The number of photons detected will reflect the actual radiopharmaceutical concentration in the body once differences in photon attenuation are compensated for by applying the attenuation-correction map from the CT data. This calculation also requires the precise knowledge of the injected activity, determined by subtracting the postinjection residual in the syringe from the known activity initially present and decay-correcting for time. Therefore, the dose calibrator quality control must be maintained, and dose infiltration must be avoided during injection. The formula used to determine SUV is:
SUV=(Tissueactivity(mCi/mL))/((InjecteddosemCi))/(patientweight(grams))
Activity in a lesion often is reported in terms of the SUV max , or the value of the most intense pixel in the ROI. This allows the exclusion of low counts from areas of necrosis or adjacent normal structures. An SUV mean is an average of all counts in the ROI, which may be more representative because a spurious single hot area will not cause incorrect data to be recorded. Many experts advocate using an SUV peak , which is calculated as an average of the counts from a circular volume (often 1 cm) surrounding the hottest pixel. The SUV peak may more accurately represent maximal tumor metabolism with a higher degree of statistical significance than the SUV max . In addition, a correction can be applied for body mass or body surface area (SUV lean or SUV bsa ). This helps eliminate the problem created by the fact that the very low distribution of F-18 FDG in fat leads to higher activity values in tumor and normal tissues in heavier patients than in thin patients.
In general, an SUV greater than 2.5 has been considered suspicious for malignancy, although most tumors have an even higher level, and considerable overlap occurs with inflammatory processes. Numerous factors affect SUV levels ( Table 12.3 ). When evaluating the response to therapy on serial scans or when comparing data from multiple sites participating in a trial, SUV accuracy is critical. All parameters that could alter the SUV must be controlled. However, variability still occurs, and most consider that the SUV must change at least 20% to be significant. Reports describe greater technical differences when considering a multicenter trial. Because of difficulties in maintaining protocol compliance and other issues, a 34% change was required before it could be considered significant.
| Factor | Change in SUV |
|---|---|
| ↑ Serum glucose | ↓ |
| ↑ Body mass | ↑ |
| ↓ Dose from extravasation | ↓ |
| ↑ Uptake period | ↑ |
| ↓ Region-of-interest size | ↑ |
| ↓ Pixel size | ↑ |
Clinical F-18 FDG PET Use in Oncology
Evaluation of lung cancer in solitary pulmonary nodules was the first clinical indication for F-18 FDG PET scanning in the United States approved by the CMS. Since that time, its use has rapidly evolved. It is important to understand the strengths and weakness of this examination for each type of tumor. F-18 FDG PET is very sensitive for many cancers ( Table 12.4 ), whereas the examination is frequently less sensitive for others ( Table 12.5 ). Several of the indications for PET are described in the following subsections. Brain tumor assessment with F-18 FDG is discussed in Chapter 13 .
| Tumors With Greater Uptake/Sensitivity | ||
|---|---|---|
| Primary Tumor Region | ||
| Head and neck cancer | Squamous (most common) Adenocarcinoma | |
| Solitary lung nodule (SPN) | >7–8 mm | |
| Lung cancer | Non–small cell Small cell | Lower for ground-glass/subsolid adenocarcinoma (formerly bronchoalveolar cancer) |
| Small cell | ||
| Mesothelioma | ||
| Breast cancer | Moderate uptake—lower in lobular and in situ lesions | |
| Esophageal | ||
| Gastric cancers | May be difficult to see due to background | |
| Colon cancer | ||
| Rectal cancer | ||
| Pancreatic adenocarcinoma | ||
| Cervical cancer | ||
| Endometrial cancer | ||
| Uterine cancer | ||
| Testicular cancer | Seminomatous +/– more than nonseminomatous | |
| Tumors With Primary Not Regionally Localized | ||
| Lymphoma | Non-Hodgkin’s | Usually hot: Low-grade tumors may not be FDG+ |
| Hodgkin’s | Almost always hot | |
| Melanoma | ||
| Multiple myeloma | ||
| Sarcoma | (locations vary) | |
| Tumors With Moderate Sensitivity | ||
| Hepatocellular cancer | Use enhanced CT/MR using noncontrast, arterial phase, venous phase, and delayed washout timing | |
| Ovarian cancer | ||
| Glioblastoma multiforme | ||
| Cancer Type From Head to Toe | Comments |
|---|---|
| Low-grade glioma | Improved in GBM and lymphoma but accuracy < outside the brain Best assessed with enhanced MR |
| Brain metastases | Detects ≈1/3 |
| Well-differentiated thyroid cancer | Imaging with radioiodine preferred |
| Pulmonary neuroendocrine tumor (carcinoid) | F-18 FDG is useful when Ga-68 DOTATATE uptake is poor (i.e., poorly differentiated tumor). |
| NSCLC bronchoalveolar | Lowest in ground-glass opacities FDG still commonly used |
| Lobular breast cancer | Detects ≈40% FDG still commonly used |
| Cholangiocarcinoma | |
| Bowel and pancreatic neuroendocrine tumors (NETs) | F-18 FDG is useful in when Ga-68 DOTATATE uptake is poor (i.e., poorly differentiated tumor). |
| Cystic borderline or low-grade pancreatic neoplasm | |
| Renal-cell carcinoma | |
| NSGCT testicular cancer | |
| Cystic, borderline, or low-grade ovarian tumor | |
| Prostate adenocarcinoma | FDG is useful when hormonal control/castration no longer inhibits growth (de-differentiates). |
| ENMZL (MALT lymphoma) | |
| Liposarcoma | |
Cancers Not Localized to an Organ or Region
Lymphoma
Lymphomas can be divided into Hodgkin’s lymphoma (HL) in approximately 10% of cases and non-Hodgkin’s lymphoma (NHL) in the remainder. Characterization also depends on the type of lymphocyte the tumor arises from: NHL can originate from T cells or B cells, whereas HL involves the B lymphocytes, and numerous subtypes have been identified under these main groupings. Each individual cancer can follow an aggressive, moderate, or more indolent course, but even cases that initially behave in a low-grade manner can undergo malignant transformation, turning highly aggressive and frequently fatal. Patients may also relapse after remission, and in such cases, tumors are often refractory to therapies.
HL progression tends to involve contiguous nodal chains and lymphoproliferative structures. It most frequently presents with painless supraclavicular or cervical adenopathy (60%–80%), axillary adenopathy (30%), and/or mediastinal mass (50%–60%). Disease outside of the lymph nodes is rare (10% to 15%), but when it happens, involvement is most often in the lung, bone marrow, bone, or liver. Disease in NHL does not tend to spread in a similar orderly fashion, and patients frequently present initially with widespread disease.
Survival has improved over the years but is worse if disease is not localized. In HL, the overall 5-year survival rate of greater than 90% decreases to 77% for distant involvement, and for NHL, the overall survival rate of more than 86% falls to roughly 63% when disease is no longer localized. Accurate staging and assessment of treatment response can help prevent unnecessary or ineffective therapy, which, given the high cure rates and long survival times, may be especially important to decrease toxicity from therapy. However, the tumor, node, metastasis (TNM) system commonly used for solid tumors is not as useful for lymphoma.
Methods used for staging and assessment of therapy response have evolved over the years. The Ann Arbor staging system has been widely used for years, relying on lesion location and size changes in lymph nodes, lymphoproliferative tissue, and other organs ( Box 12.4 ). Over the years, classification and grading systems have evolved to better reflect actual changes in tumor activity as opposed to the location of lesions. This is essential because the presence of fibrosis and scar can mean lesions seen on CT do not fully resolve, even after tumor has been successfully eradicated ( Fig. 12.26 ). However, metabolic activity on PET tends to be proportional to tumor grade and can better identify and differentiate sites of active disease from scarring. Changes in F-18 FDG metabolic activity on PET/CT can be used to significantly improve the accuracy concerning changing disease status over anatomical measurement alone on CT or MR. In order to better standardize descriptions of lesion intensity, the Deauville Criteria established a 5-point scale, comparing maximal to background structures:
- 1
= no activity above background
- 2
≤ mediastinal blood pool
- 3
> mediastinum
- 4
> liver (moderately)
- 5
>> liver (markedly)
Related posts:

Stay updated, free articles. Join our Telegram channel

Full access? Get Clinical Tree


