Fig. 44.1
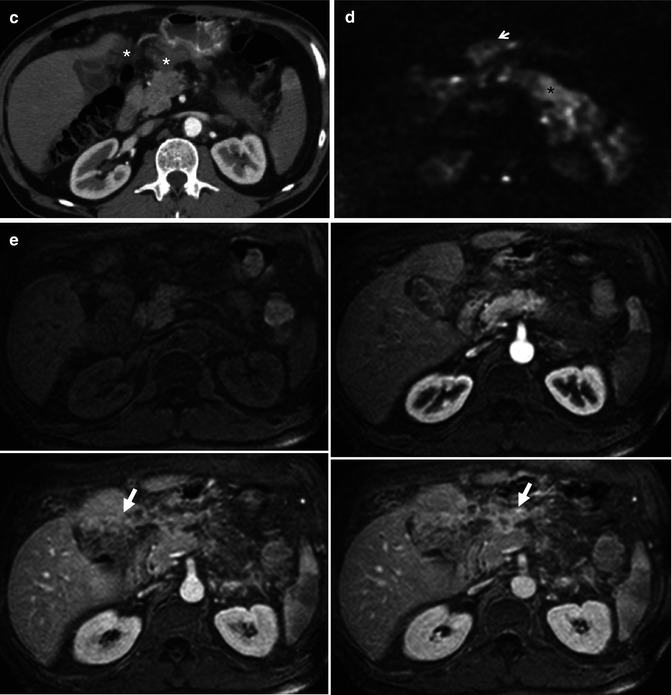
Pancreatic carcinoma staging with CT and MRI. A 61-year-old male with long evolution epigastric pain and weight loss. (a) Dual-phase enhanced CT at parenchymal pancreatic and venous phases demonstrates a large hypodense mass with heterogeneous and late enhancement located in pancreatic body and tail. The mass infiltrates the left adrenal gland (asterisks) and splenic vascular bundle (white arrows), causing a splenic infarction (black arrow) (b) Axial postcontrast dynamic THRIVE sequence (precontrast, arterial, portal, and venous phases) confirms the presence of a hypovascular mass at the pancreatic body and tail with similar findings to CT and additionally, depicts a peripancreatic node (white arrow). (c) Enhanced CT at parenchymal pancreatic phase (inferior level to 1.1) shows multiple masses with soft tissue density in gastropancreatic space, with loss of the cleavage planes with gastric chamber, and extending to the porta hepatis (asterisks). (d) Axial DWI with b factor of 1,000 s/mm2 shows high signal intensity due to true restricted diffusion of the pancreatic (asterisk) and mesenteric (arrow) masses. (e) Axial postcontrast dynamic THRIVE sequence also depicts progressive and predominantly delayed enhancement of the lesions in gastropancreatic area, consistent with peritoneal implants
MRI is the most sensitive tool to detect pancreatic carcinomas, which usually appear as low-signal-intensity masses on unenhanced T1-weighted sequences with fat suppression [8] (Fig. 44.1b). Pancreatic tissue distal to pancreatic cancer often shows lower signal intensity than normal pancreatic tissue, secondary to tumor-associated pancreatitis distal to the tumor, due to obstruction of main pancreatic duct. When chronic inflammation occurs, there is progressive fibrosis and glandular atrophy, and the depiction of tumor is poorer. Tumors are usually minimally hypointense relative to pancreas on T2-weighted images and are difficult to visualize. Detection of carcinomas is best performed by pancreatic parenchymal phase in a fat-suppressed dynamic T1-weighted sequence (Fig. 44.1b). They appear as hypovascular lesions that enhance to a lesser extent than surrounding normal pancreatic tissue because of their abundant fibrous stroma and relative sparse vascularity [11]. At this dynamic phase, most of pancreatic carcinomas are relatively well demarcated, although some lesions, most of them moderately differentiated tumors, show poorly defined margins. This appearance is similar to that of carcinomas treated with chemoradiation. The fibrous component may be responsible of delayed enhancement with secondary hyper- or isoenhancement of the lesion to pancreatic parenchyma [11, 12]. This pattern of enhancement on interstitial phase images is more common on smaller tumors, as large pancreatic carcinomas remain hypoenhanced compared to pancreatic normal tissue. In a recent review of the literature, MRI demonstrated similar sensitivity and specificity rates for diagnosis and staging of pancreatic cancer than CT [13].
EUS is an invasive method which allows histologic confirmation of pancreatic cancer. Its use is especially interesting for tumors smaller than 2 cm, where it shows superior sensitivity to CT [8].
44.2.2 Staging with Cross-Sectional Imaging: CT and MRI
The purpose to use imaging for staging is to define and classify pancreatic cancer as locally resectable, locally unresectable, and unresectable for distant metastases [11]. The classifications used are the Union Internationale Contre le Cancer, the American Joint Committee Classification, and the Japan Pancreas Society (Pancreatic Cancer Registration Committee of the Japan Pancreas Society 2003). Borderline resectable lesions may undergo resection after chemotherapy and/or radiotherapy [5].
Local staging (T) criteria after recent changes, only consider unresectable tumors those invading either the celiac axis or the superior mesenteric artery. Limited infiltration of venous superior mesenteric vein is now considered resectable using venous grafts [14]. The most useful imaging criteria of vascular invasion is the presence of circumferential involvement >180° [8, 11]. CT and MRI using vascular techniques show sensitivities over 90 % to determine vascular invasion and resectability [15] (Fig. 44.1a, b).
Nodal staging (N) is more challenging for cross-sectional imaging. Size criteria (transverse diameter) show little sensitivity, being a nonspecific criterion [16]. Metastasis in peripancreatic nodes is not important as they will be removed at surgery, being more important to define affectation of celiac node, common artery hepatic node, and para-aortic nodes, as their involvement is a criteria of unresectability [11] (Fig. 44.1b).
Up to 60 % of pancreatic carcinoma presents metastases at diagnosis [8]. The most common distant metastases of pancreatic adenocarcinoma occur to the liver and peritoneum. Therefore, the use of a multiphasic protocol including a portal venous phase allows their assessment in the same study than locoregional staging. MRI is slightly superior to CT in the assessment of liver metastasis using T2-weighted and dynamic contrast-enhanced (DCE)-MRI. In addition, it is well known that the use of DWI and hepatospecific contrast agents improves the detection of liver metastasis, especially if they are used combined [17]. Moreover, DWI has shown higher sensitivity and specificity than CT in a statistically significant manner in the detection of liver metastasis of pancreatic carcinoma [18]. In addition, in a recent series comparing MRI with gadoxetic acid and CT in the assessment of liver metastasis of pancreatic carcinoma, MRI had greater sensitivity for two of the three readers in the MRI-versus-CT analysis (85 % vs 69 %) and for all three readers in the lesion-by-lesion analysis (92–94 % vs 74–76 %) [19].
In the evaluation of peritoneal disease, MRI is considered the best imaging technique, although it is limited in its evaluation (Fig. 44.1c–e). Staging laparoscopy before surgery in resectable disease by preoperative imaging is proposed by some groups [20]. However, a meta-analysis demonstrated that laparoscopy only alters patient management in 4–15 % of the cases after staging CT [21].
44.2.3 Role of 18FDG PET-CT in Pancreatic Cancer Assessment
The triple-phase enhanced 18FDG PET-CT is the state-of-the-art protocol for assessment of pancreatic lesions [5]. Pancreatic adenocarcinoma usually shows intense 18FDG uptake (Fig. 44.2). Although 18FDG PET-CT has shown its usefulness in the differentiation of chronic and autoimmune pancreatitis (AIP) from pancreatic cancer [22, 23], it has shown a pooled sensitivity and specificity of 90.1 and 80.1 % in the diagnosis of pancreatic cancer [24]. Thus, this functional technique has a limited role in clinical practice for tumor detection and characterization. Limitations of 18FDG PET-CT are related to false-positive, such as inflammatory tissue, and false-negative results, such as mucinous and necrotic tumors or small tumors located near areas of physiological uptake (ampullary tumors) [25] (Fig. 44.3). The main use of 18FDG PET-CT is M-staging of pancreatic cancer, as its results for T- and N-staging are far from good [11, 26]. Reported sensitivities and specificities of 18FDG PET-CT for nodal staging range from 46 to 71 % and from 63 to 100 %, respectively [8]. However, reported sensitivities of 68–70 % for liver metastasis detection (Fig. 44.4) with specificities over 90 % and rates of 25 % in the detection of occult peritoneal disease (Fig. 44.5) make 18FDG PET-CT suitable for the detection of distant metastases [27, 28]. Furthermore, in a recent series, 12 of 44 patients upstaged from curative to palliative disease after 18FDG PET-CT [29]. Similarly, in another series, 18FDG -PET in addition to CT altered the surgical management in 13 % of patients by identifying unsuspected distant metastases or by clarifying the benign nature of indeterminate lesions in CT [30]. Limitations of this technique in the evaluation of liver and peritoneal metastases are related to lesions smaller than 1 cm in the liver and microscopic disease in the peritoneum, due to limitations in spatial resolution.
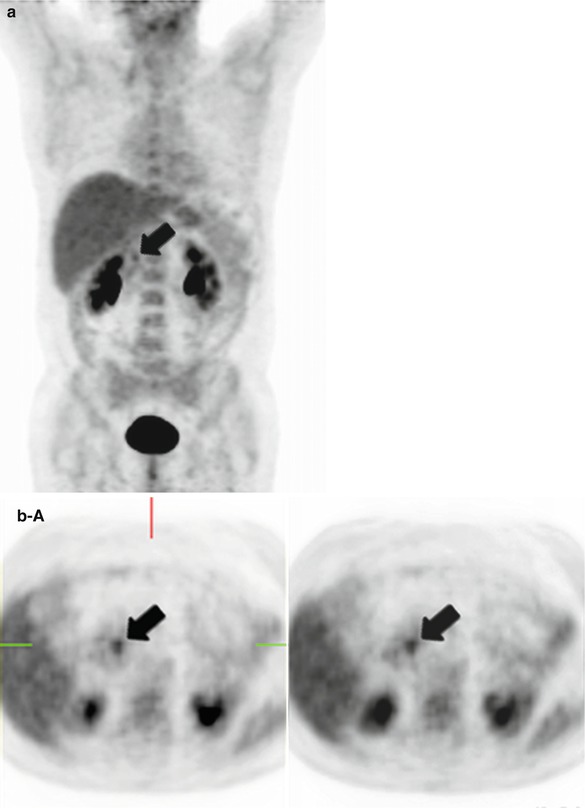
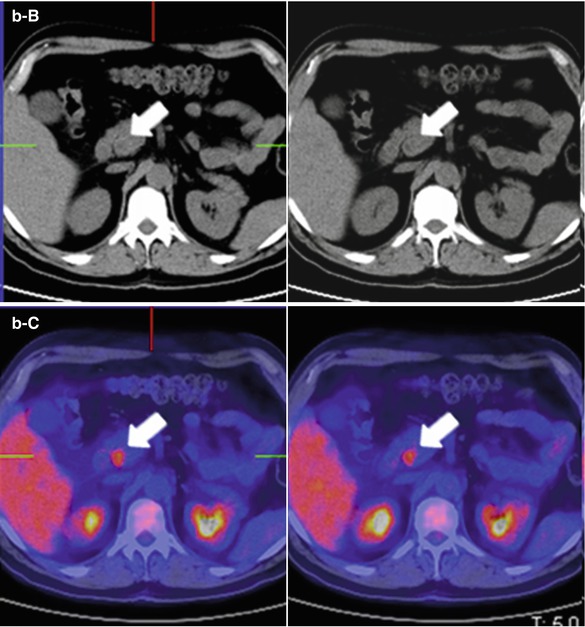
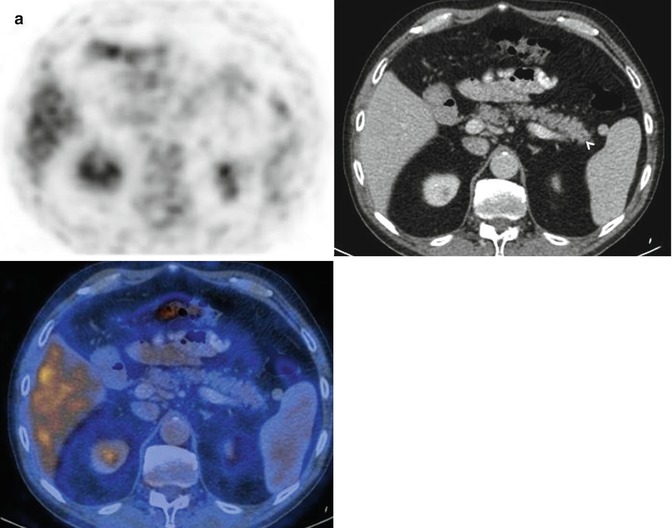
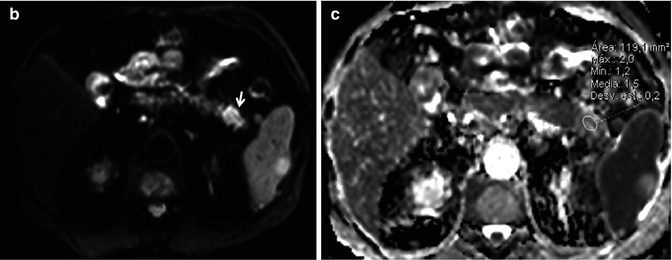
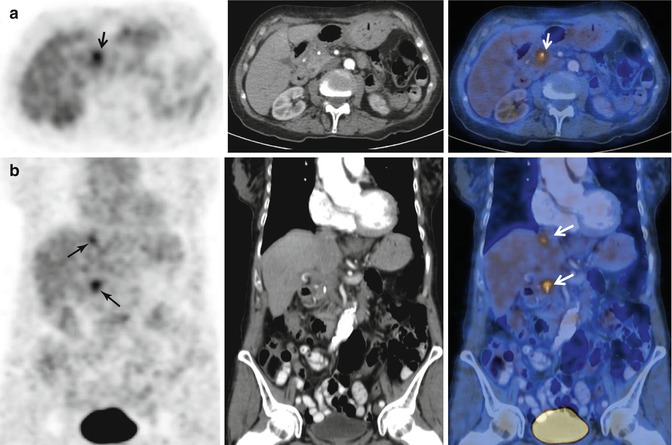
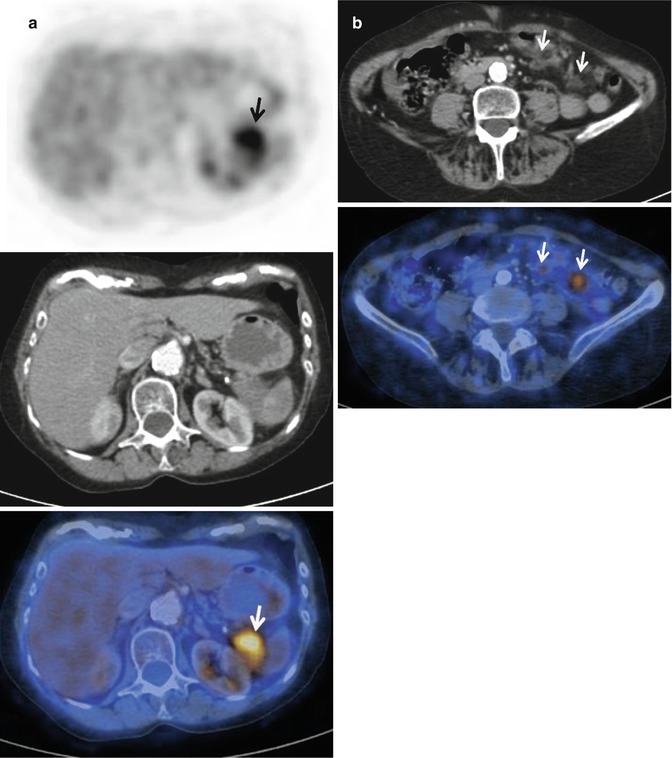


Fig. 44.2
Pancreatic adenocarcinoma at 18FDG PET-CT. A 67-year-old woman who went to the emergency room for acute epigastric pain. She underwent an abdominal ultrasound study that showed a lesion in the uncinate segment of the pancreatic gland. An 18FDG PET-CT was performed for further characterization. Coronal 18FDG PET-MIP images (a) and axial 18FDG PET-CT images (b A 18FDG PET, B unenhanced CT, and C overlay images) show a hypermetabolic foci in the uncinate segment of the pancreatic gland (arrows) consistent with pancreatic adenocarcinoma


Fig. 44.3
Hypometabolic pancreatic adenocarcinoma. (a) Axial 18FDG PET-CT images do not show uptake in a diffuse lesion which on CT presents as a subtle loss of the acinar pattern (arrowhead). However, the lesion was nicely depicted on DWI with high b value (arrow in b), which demonstrated an ADC value of 1.5 × 10⁻³ mm2/s, higher than adjacent pancreatic parenchyma (c). Uncommonly, pancreatic ductal adenocarcinoma may prove to be a metabolically silent lesion and thus be a cause of a false-negative study on 18FDG PET-CT

Fig. 44.4
Local recurrence of pancreatic adenocarcinoma and liver metastasis. Follow-up 18FDG PET-CT performed during the surveillance of a patient with Whipple procedure for previous pancreatic adenocarcinoma. (a, b) Axial and coronal 18FDG PET-CT images demonstrate the presence of two foci (arrows) of tracer uptake in the surgical bed and a focal liver lesion (superior arrows on b images) corresponding to recurrent tumor and a solitary liver metastasis, respectively

Fig. 44.5
Pancreatic tail adenocarcinoma and peritoneal compromise. (a) Axial 18FDG PET-CT images show intense tracer uptake by a solid lesion in a mildly enlarged pancreatic tail. (b) Axial 18FDG PET-CT images of the same patient at a lower level reveal two foci of tracer uptake which at CT translates in subtle solid peritoneal implants (arrows). Notice how in this case 18FDG PET/CT makes peritoneal compromise conspicuous in a patient that originally presented as a potential surgical candidate, significantly impacting on management
Another area of interest for 18FDG PET-CT is the definition of tumor volume and margins in radiotherapy planning. The scarce data available suggest a better performance of 18FDG PET-CT compared to CT in this task [5]. For example, Topkan and colleagues reported a statistically significant increase in gross tumor volume delineation in 35.7 % of patients with locally advanced pancreatic cancer during radiotherapy planning, in the comparison between CT versus co-registered 18FDG PET-CT [31]. Interestingly, 18FDG PET-CT is useful in the early evaluation of treatment response to chemotherapy and radiotherapy, being superior to CT [32, 33]. In addition, in locally advanced unresectable pancreatic cancer, pretreatment SUV values are prognostic of overall and progression-free survival and predictive of histologic response after treatment [5, 34]. Furthermore, initial data supports an independent role for relative change in maximum standardized uptake value (SUVmax) in predicting clinical outcomes in patients with locally advanced pancreatic carcinoma after concurrent chemoradiotherapy [29]. In the depiction of recurrent cancer after treatment, 18FDG PET-CT is of interest in patients with elevated concentrations of CA 19–9 and those with inconclusive CT findings [35].
44.2.4 Diffusion-Weighted MRI
In the last years, DWI has expanded its applications outside the brain because of technological improvements in gradient strengths and sequences. Nowadays, DWI forms part of state-of-the-art body MRI protocols. The image contrast on DWI relies on intrinsic differences in the water diffusion between tissues. Furthermore, the role of DWI as a cancer biomarker of tissue cellularity and cell membrane integrity is well recognized [36]. DWI can also help in the diagnosis of pancreatic carcinoma, typically showing high signal intensity with high b values and lower apparent diffusion coefficient (ADC) values than normal pancreas [37, 38] (Fig. 44.6a–c). Lipophilic cell membranes in pancreatic ductal adenocarcinoma, typically a tumor with hypercellular tissue, serve as barriers to free diffusion in the intracellular and extracellular spaces. However, variations in the ADC values of pancreatic adenocarcinoma have been related according to the histopathological composition of the tumors [38, 39]. Normally, dense fibrosis and increased cellular elements make pancreatic cancer to show lower ADC values than the normal pancreatic parenchyma; however, tumors with high content in edematous fibrosis and loose collagen fibers can show higher ADC values than normal pancreas (Fig. 44.3b, c). A recent series demonstrated lack of relationship between ADC values of pancreatic adenocarcinoma and tumor grade or other adverse pathological features [40]. However, the series by Wang and coworkers demonstrated significant lower ADC values for poorly differentiated adenocarcinoma with histopathological characteristics of limited glandular formation and dense fibrosis compared to those of well-/moderately differentiated adenocarcinomas characterized by neoplastic tubular structures [41]. A recent meta-analysis demonstrated sensitivity of 85 % and specificity of 91 % for pancreatic adenocarcinoma detection using DWI with a high b value [42]. The reported sensitivity was similar to that of 18FDG PET-CT (87 %) with better specificity (83 %). However, the presence of associated acute pancreatitis to pancreatic carcinoma, which more commonly occur in tumors located in the head of the pancreas, may hamper the detection of pancreatic adenocarcinomas at DWI in 47 % of the cases, according to recent data [39]. This is related to increased signal intensity and low ADC value of pancreatic parenchyma distal to pancreatic cancer, demonstrating acute inflammatory changes. At this presentation, pancreatic carcinoma can show ill-defined borders or even low signal intensity at high b value and similar ADC values compared to the inflamed distal pancreatic parenchyma.
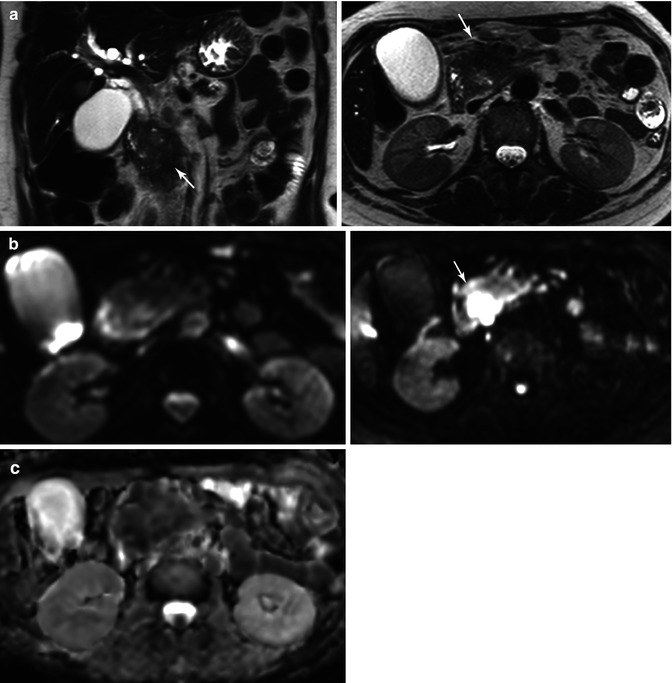
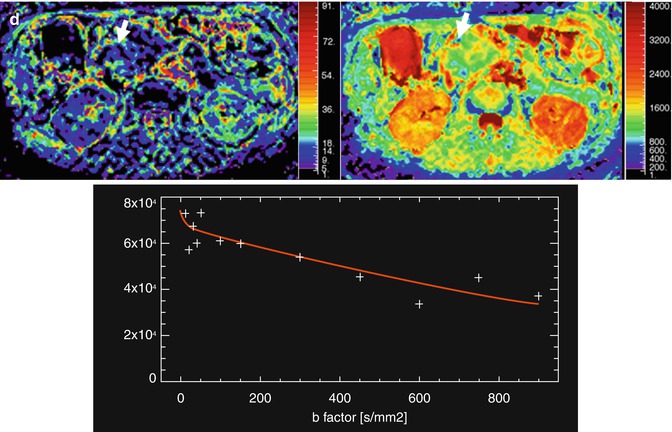


Fig. 44.6
Assessment with DWI and IVIM of a pancreatic carcinoma. A 58-year-old woman presented with jaundice and epigastric pain of long duration. (a) Axial and coronal TSE T2-weighted images demonstrate a solid mass in the pancreatic head (arrows), causing malignant proximal obstruction of the bile duct. (b) Axial DWI image with b value of 0 (top image) and 900 s/mm2 (bottom image) and corresponding ADC map (c) show increased signal intensity of the mass (arrow) with a very low ADC values (0.8 × 10⁻³ mm2/s), consistent with restricted diffusion. (d) IVIM parametric maps of f and D parameters show decreased values of f (8 %) and D (0.7 × 10⁻³ mm2/s). Notice how the first part of signal decay of diffusion signal of the mass according to the IVIM model is flat, revealing low influence of perfusion on diffusion. This explains why ADC and D values are similar in this case
Intravoxel incoherent motion (IVIM) model of diffusion signal decay quantitatively assesses the microscopic translational motions that occur in each image voxel. Pure molecular diffusion and microcirculation (also known as blood perfusion) can be distinguished by means of IVIM, using multiple lower and higher b values than 100 s/mm2 [43]. In the last years, this model has been proposed for improved pancreatic cancer assessment compared to monoexponential signal decay analysis. Lemke and coworkers demonstrated that perfusion fraction (f) showed more than a tenfold higher significance level in the differentiation between healthy pancreas and pancreatic carcinoma compared with the ADC values [44]. However, another IVIM-derived parameter, tissue diffusivity (D) was unable to differentiate normal tissue and cancer, while ADC could distinguish both entities in a significant manner (Fig. 44.6d). Moreover, the same group of authors has shown that D value rises from moderate to severe fibrosis associated to pancreatic cancer and focal chronic pancreatitis, contrarily to what has been previously shown for ADC values [45].
DWI is also able to accurately differentiate pancreatic carcinoma from benign lesions. A recent meta-analysis reported pooled sensitivity of 86 % and pooled specificity of 91 %, with an area under the curve of the summary receiver operating characteristic of 0.94 [46]. Limitations in the differentiation between mass-forming pancreatitis from poorly differentiated adenocarcinomas using DWI were also a conclusion of this meta-analysis, as both entities show high fibrotic content and low ADC values. In addition, contradictory data in the relation between ADC values of pancreatic cancer and mass-forming pancreatitis have been reported, with an evident overlap in several series [47, 48]. The referred meta-analysis considered as inconsistent the data reported by Huang and colleagues, as in their series DWI was useful in differentiating between pancreatic carcinoma and mass-forming pancreatitis using a high b value of 1,000 s/mm2 in combination with ADC quantification in a 3-T magnet [49] (Fig. 44.7a–c). IVIM model has been also tested in this differentiation. In the series by Klauss and colleagues, perfusion fraction was the best parameter in the differentiation between mass-forming pancreatitis and pancreatic carcinoma, while D value was not significantly different between both groups (Figs. 44.6d and 44.7d). Interestingly, ADC calculated with b values between 50 and 300 s/mm2 showed statistically significant differences between both entities, which were not possible with ADC calculated with b values of 25, 400, 600, and 800 s/mm2 or including all b values. Therefore, the differences between mass-forming pancreatitis and pancreatic cancer are probably due to differences in perfusion [50].
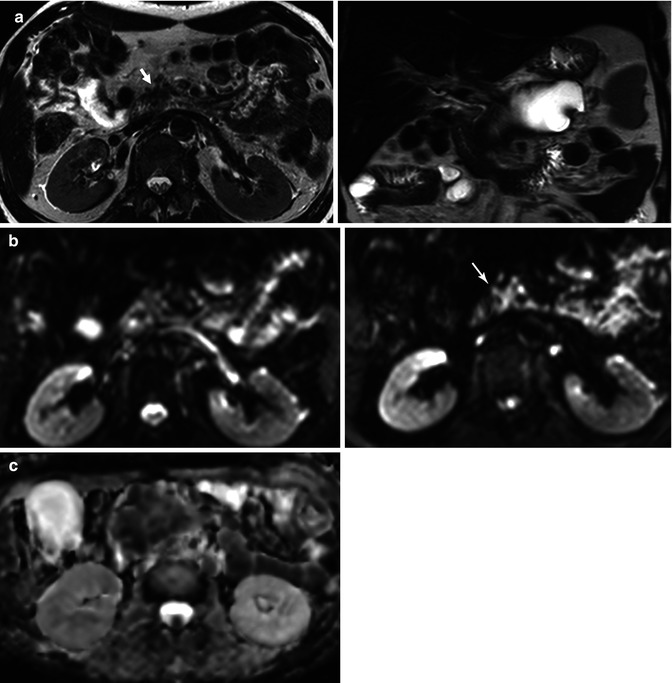
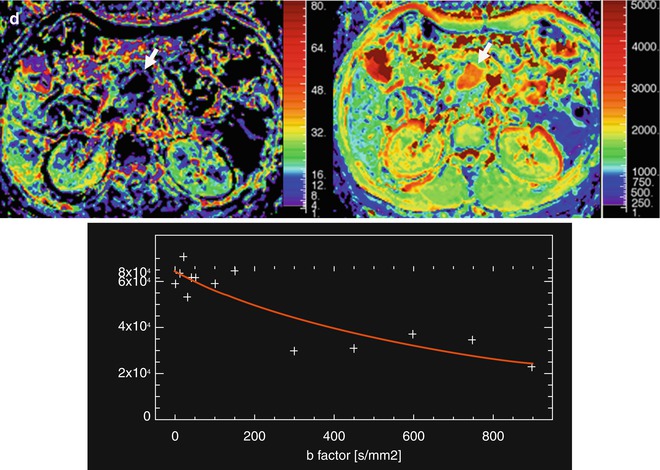


Fig. 44.7
Chronic focal pancreatitis in a 45-year-old male, with a personal history of repeated pancreatitis. (a) Axial and coronal TSE T2-weighted images show a large cystic lesion occupying the pancreatic body and tail suggestive of a pseudocyst, and a small and speculated pancreatic mass located in the pancreatic head (arrow), which is hypointense on T2-weighted image. (b) Axial DWI images of the pancreatic head lesion show increased persistent signal intensity (arrow), with an ADC value of 1.2 × 10⁻³ mm2/s (c ADC map). (d) IVIM parametric maps show intermediate perfusion fraction value (f 13 % ) and decreased diffusion (D 0.93 × 10⁻³ mm2/s). These features are consistent with focal chronic pancreatitis. Notice how, in this case, the difference between D and ADC values is secondary to the effect of perfusion on diffusion signal decay
AIP represents a distinct form of chronic pancreatitis which often presents as a pancreatic mass causing obstructive jaundice as well as pancreatic exocrine and endocrine insufficiency. It shows high signal intensity on high b-value DWI sequences and lower ADC values than chronic pancreatitis and pancreatic carcinoma [51–53] (Fig. 44.8). DWI is also useful to monitoring the effect of steroids, as if therapy is successful high-intensity areas on DWI disappear or are markedly decreased, and the ADC values increased almost to the values of normal pancreas [51, 53].
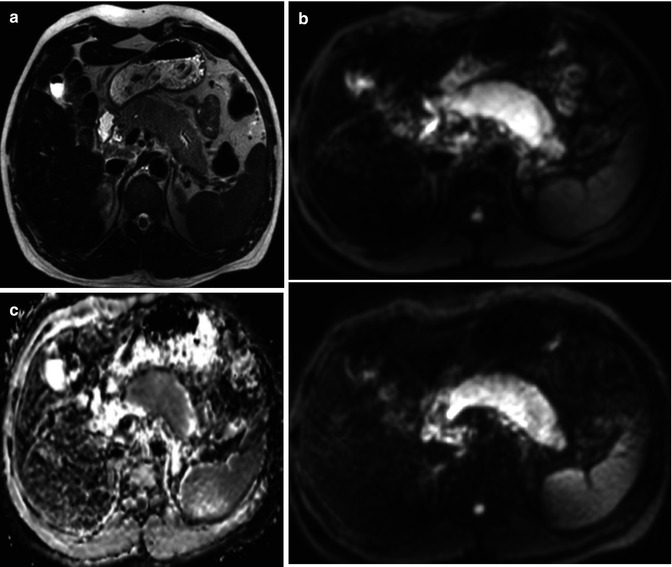

Fig. 44.8
Autoimmune pancreatitis. (a) Axial TSE T2-weighted images show diffuse enlargement of the gland, with a slight increase in signal intensity. (b) DWI images with b values of 0 and 900 s/mm2, the gland presents significant increase in signal intensity, with decreased signal intensity in the ADC map (c). ADC value was 1.4 × 10⁻³ mm2/s. These image findings are consistent with autoimmune pancreatitis
DWI has been proposed for therapy monitoring and prediction of treatment response in different tumors and organ sites [36] (Figs. 44.9 and 44.10). Normally, a positive response to treatment is related to decrease signal on high b value and increase in ADC values, although ADC decreases may occur due to fibrosis formation or necrosis clearance [54]. Preliminary data suggests that a lower ADC calculated using a high b value (1,000 s/mm2) is correlated with early progression in patients with advanced pancreatic cancer treated with chemotherapy [55]. Unfortunately, these data correspond to a unique series including 63 patients, and therefore, further research is needed to validate these results.
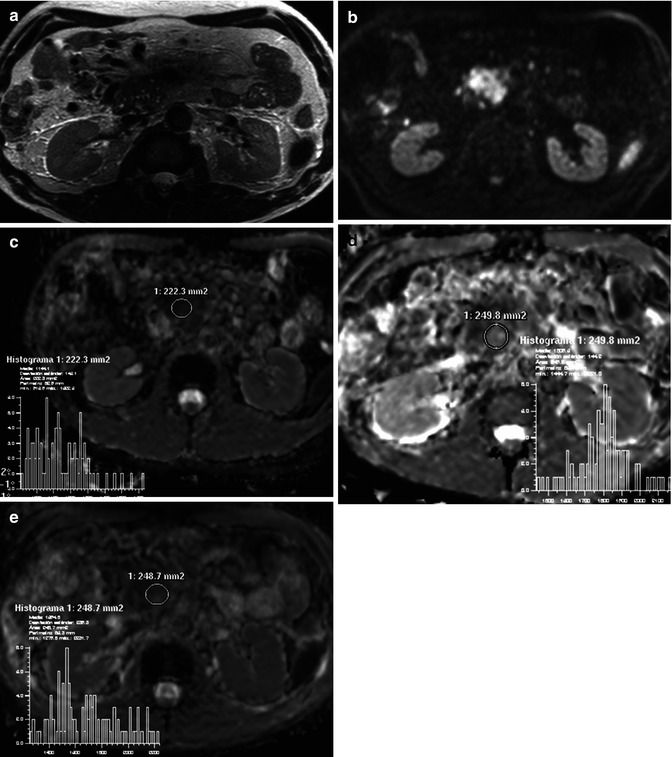
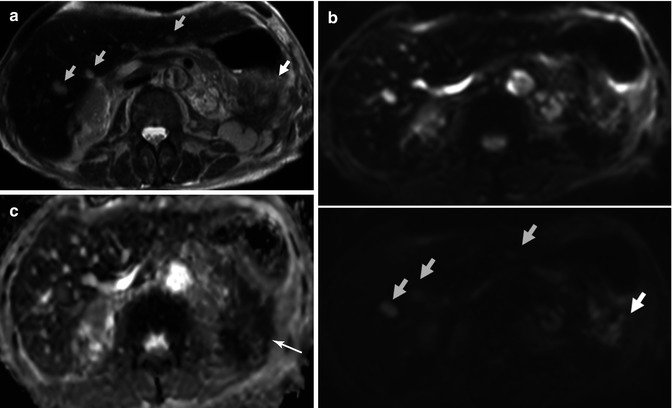
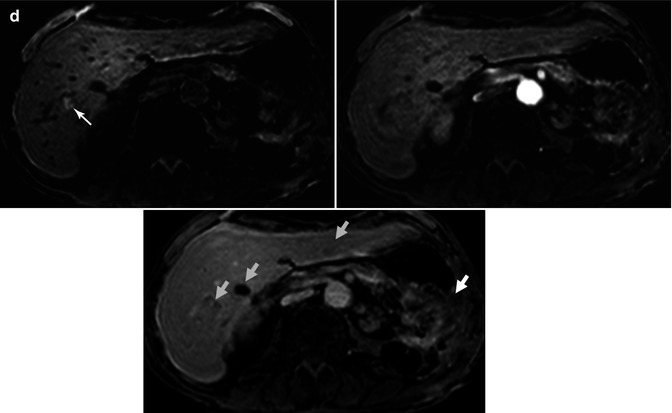

Fig. 44.9
DWI in therapy monitoring of pancreatic carcinoma. A 65-year-old male with unresectable carcinoma of the pancreatic head diagnosed in October 2010. First MRI before treatment showed a hypointense mass on T2-weighted image (a) with restricted diffusion on DWI (b). ADC value was that of 1.1 × 10⁻³ mm2/s (c). After chemotherapy, in the control study in April 2011, ADC map (d) showed increased ADC values (1.8 × 10⁻³ mm2/s), and in the histogram analysis the values of the mass moved to the right. These findings pointed out good response to treatment. In July 2011, a new control study was performed after completion of the treatment; unfortunately, ADC map (e) showed lower ADC values (1.4 × 10⁻³ mm2/s) when compared with previous study. Histogram values moved to the left, suggesting recurrence of the disease


Fig. 44.10
Recurrence of pancreatic carcinoma. Patient with history of pancreatic carcinoma treated with partial pancreatectomy of the pancreatic tail presents increased tumor markers. (a) Axial TSE T2-weighted image shows a slightly hyperintense mass in the surgical bed (white arrow), which extends to the splenic fossa, and that presents internal necrotic areas, as well as multiple focal liver lesions (clear blue arrows). (b) Axial DWI images with b value of 0 (top image) and 900 s/mm2 (bottom image) show high signal intensity of both the solid portion of the pancreatic mass and the hepatic lesions, representing restricted diffusion as confirmed in the ADC map (c), where the pancreatic mass appears hypointense (arrow). (d) Axial DCE-MRI THRIVE images before and after contrast administration on arterial and delayed phases demonstrate progressive enhancement of the pancreatic mass and peripheral enhancement of the liver lesions, one of them (arrow in precontrast image) presenting hemorrhagic content. Findings are consistent with local recurrence of pancreatic carcinoma with liver metastases
44.2.5 Evaluation of Angiogenesis of Pancreatic Cancer
The vascular characteristics of pancreatic cancer have been investigated with different imaging methods. Recent advances in technology and contrast agents have made possible to study whole organ perfusion with contrast-enhanced ultrasound (CEUS), CT perfusion, and high temporal resolution DCE-MRI. It is possible to investigate differences in time-intensity curve (TIC) of normal pancreas and focal lesions. Furthermore, semiquantitative or quantitative vascular parameters derived from these techniques have been advocated for tumor characterization, therapy monitoring, and prediction of response to treatment. Technical aspects and clinical applications have been extensively analyzed in previous chapters of this book.
Pancreatic carcinoma is a hypovascular tumor, demonstrating high permeability and limited blood flow. In this situation, volume transfer coefficient (K trans) and indirectly, initial area under the concentration curve in 60 s (AUC60), represent blood flow and values of these parameters of pancreatic carcinoma are low (Fig. 44.11). These vascular characteristics have been well demonstrated either by CT perfusion or DCE-MRI [56–58]. In addition, the TIC of pancreatic cancer is quite different to that of mass-forming chronic pancreatitis and neuroendocrine tumors [58, 59] (Fig. 44.12). Mass-forming pancreatitis shows low wash-in with at least a delayed washout, and neuroendocrine tumors show early and fast enhancement and subsequently marked washout. Differently, pancreatic adenocarcinoma demonstrates low wash-in with progressive enhancement or delayed plateau, without washout. Similarly, CEUS has shown to increase the diagnostic confidence in the differentiation between pancreatic carcinoma and mass-forming pancreatitis [60]. Furthermore, vascular parameters derived from CT perfusion or DCE-MRI help in the differentiation of pancreatic solid tumors. Therefore, it may be concluded that perfusion studies are useful in the differentiation of these entities, although conventional CT and MRI protocols are also able to perform accurate characterization (Fig. 44.13). Moreover, recently vascular parameters derived from CT perfusion were able to significantly distinguish between low- and high-grade pancreatic adenocarcinoma [61]. Similar results have been found with CEUS, which show a positive correlation between the type of vascularization in pancreatic adenocarcinoma with histology grade and mean vessel density [62]. In addition, CT perfusion parametric maps help in the detection of pancreatic carcinomas which are not visible on multiphasic CT [63].
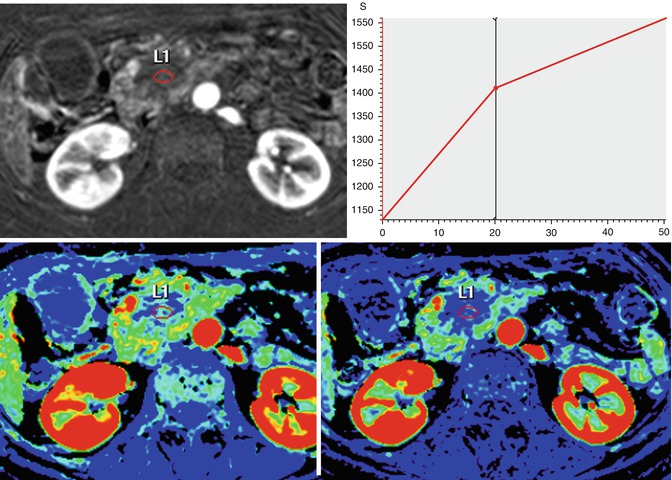
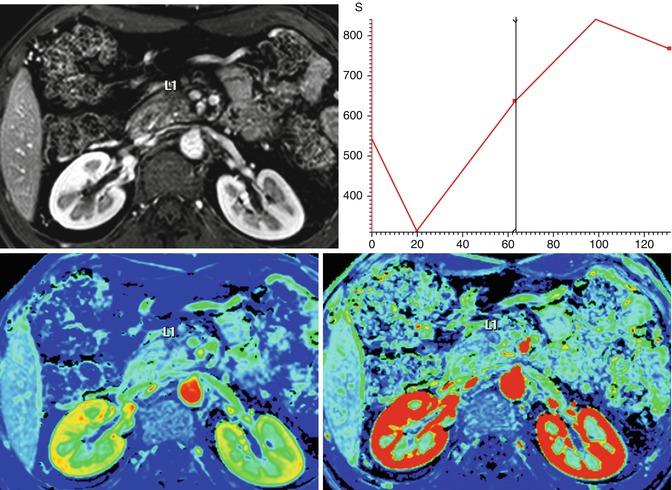
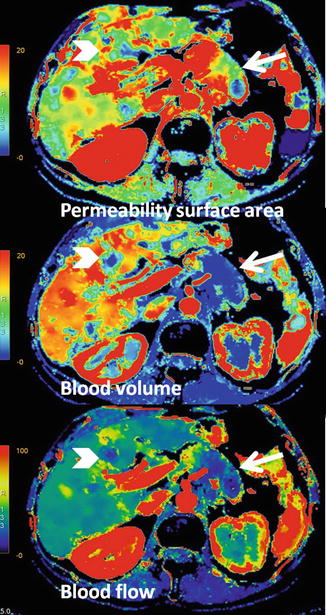

Fig. 44.11
Assessment with DCE-MRI of a pancreatic carcinoma (same case that Fig. 44.6). A 58-year-old woman presented with jaundice and epigastric pain of long duration. Axial postcontrast DCE-MRI on the arterial phase shows a hypovascular mass with progressive uptake in the TIC, with a decrease wash-in value (13.8 1/s) and a high value of area under the curve (49,000 mm2)

Fig. 44.12
DCE-MRI of chronic focal pancreatitis (same case that Fig. 44.7). A 45-year-old male presented with a personal history of repeated pancreatitis. Axial postcontrat DCE-MRI shows slight and progressive uptake after the administration of gadolinium of a pancreatic head mass, with a wash-in value of (7.9 1/s) and area under the curve of 21,496 mm2. Findings suggestive of a chronic focal pancreatitis

Fig. 44.13
CT perfusion of pancreatic adenocarcinoma with liver metastasis. Parametric maps show limited blood volume and blood flow of pancreatic carcinoma (arrows) and liver metastasis (arrowheads), which demonstrate absolute lack of flow in the center of the mass, related to necrosis. However, both lesions demonstrate a moderate increase of permeability surface area values
Initial data have related high pretreatment K trans values of locally advanced pancreatic carcinoma to good response to treatment, as these elevated values of K trans could represent better delivery of the drugs to the tumor [64, 65]. Park and colleagues evaluated 30 patients with locally advanced pancreatic carcinoma with CT perfusion before and 3 months after gemcitabine-based concurrent chemotherapy and radiation therapy. Responders demonstrated higher tumor K trans and blood volume values, although there was only a significant difference for K trans [64]. Similarly, Akisik and coworkers evaluated 11 patients with locally invasive pancreatic cancer before and 28 days after combined chemotherapy and antiangiogenic therapy with DCE-MRI analyzed using a two-compartment kinetic model. Pretreatment K trans and K ep were significantly higher in tumors that showed good response than in nonresponders. An elevated pretreatment K trans was 100 % sensitive and 71 % specific to predict tumor response. Furthermore, in responders, a significant decrease of K trans, v e, C peak, slope, and AUC60 was reported [65].
44.3 Functional Imaging in Other Pancreatic Malignancies
44.3.1 Cystic Pancreatic Tumors
Stay updated, free articles. Join our Telegram channel

Full access? Get Clinical Tree


