- •
Mechanical dyssynchrony relates to a delay in the timing of the contraction (systolic) or relaxation (diastolic) within the LV or between the RV and LV.
- •
Mechanical dyssynchrony is prevalent in patients with HF and CAD and is a clinical risk factor.
- •
CRT restores synchrony in patients with documented mechanical dyssynchrony rather than isolated electrical dyssynchrony.
- •
CRT response is affected by the presence of mechanical dyssynchrony, extent of myocardial scarring, and LV lead placement within the site of latest activation.
- •
Assessment of mechanical dyssynchrony by radionuclide imaging is reproducible and associated with reduced interobserver or intraobserver variability compared with other modalities.
Introduction
In the healthy heart, the conduction of electrical impulses through the His-Purkinje system results in an electrical cascade within myocytes that progresses from the base to the apex of the ventricles, leading to a synchronous contraction. The time it takes for the ventricle to contract is between 80 and 100 milliseconds, as shown by the QRS complex on a standard electrocardiogram (ECG) recording. Physiologic changes within the myocytes and specialized conduction cells can increase the duration of this activation. This is called electrical dyssynchrony and manifests as QRS prolongation to a width greater than 120 ms.
Whereas electrical dyssynchrony only implies a wide QRS complex, mechanical dyssynchrony describes a delay in the timing of contraction or relaxation of the left ventricle (LV; intraventricular) or between the ventricles (interventricular). LV mechanical dyssynchrony (LVMD) can affect one or both phases of the cardiac cycle (systolic and diastolic). In systolic LVMD, the efficacy of the contraction is impaired. In diastolic LVMD, a dyssynchronous relaxation of the ventricle impairs the LV filling.
Pathophysiology of mechanical dyssynchrony
Electrical and mechanical dyssynchrony are caused by a disruption in electrical conduction. Causes of dyssynchrony include ischemic and nonischemic insults to the myocardium and electrical conduction system, resulting in scar tissue formation. Although electrical and mechanical dyssynchrony often coincide, they are not synonymous, and mechanical dyssynchrony can occur in the absence of electrical dyssynchrony. Because the LV contains the most myocardial mass, electrical and mechanical dyssynchrony gain most clinical significance when the LV is affected.
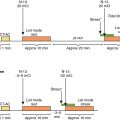
The change in timing of activation in distinct segments of the LV results in impaired systolic contraction and diastolic filling. For example, in the setting of a left bundle branch block (LBBB), the septum contracts in early systole before the lateral wall, resulting in a passive stretch of the lateral wall and a biphasic contraction pattern. In late systole, the lateral wall contracts and the septum stretches ( Fig. 27.1 A). The different timing of segmental contraction of the septum and lateral wall decreases the net cardiac output in both early and late systole, which, in turn, shifts the end systolic pressure-volume relationship rightward, resulting in an increase in the end-systolic volume and a decrease in stroke volume and work (see Fig. 27.1 B). , In addition, the uncoordinated segmental contraction can induce geometric changes in the mitral leaflets, causing mitral valve regurgitation.

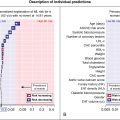
The importance of mechanical dyssynchrony
Mechanical dyssynchrony is particularly prevalent in patients with heart failure (HF) and in patients with coronary artery disease (CAD). The reported prevalence of LVMD varies by the type of modality used to assess LVMD (echocardiography, nuclear imaging, magnetic resonance imaging [MRI]), type of underlying disease (CAD, HF), and type of LVMD (systolic or diastolic). , Although electrical and mechanical dyssynchrony often coincide, LVMD is present in about 30% to 40% of patients who have a normal QRS duration, with an even higher prevalence in patients with CAD. , There are several reasons why measuring mechanical dyssynchrony is important ( Fig. 27.2 ), including that it is a clinical risk factor, it is a marker of early myocardial damage, and it may help improve the selection of candidates for cardiac resynchronization therapy (CRT). Studies that have evaluated mechanical dyssynchrony have found that its presence is independently associated with worse cardiac function and prognosis in patients with HF and/or CAD. , Mechanical dyssynchrony after acute myocardial infarction (MI) is thought to be a marker of myocardial damage and is related to worse LV remodeling. Since the introduction of CRT for patients with advanced HF and QRS prolongation, ventricular dyssynchrony has been recognized as an important prognostic factor. Current criteria for selection of candidates for CRT rely on the presence of HF with reduced ejection fraction (HFrEF) and electrical dyssynchrony. Nevertheless, there is emerging evidence that mechanical rather than electrical dyssynchrony may be a better therapeutic target in these patients.

Although echocardiography is currently the most common modality used to evaluate mechanical dyssynchrony, evidence supporting its use for the selection of CRT candidates is lacking. In the last decade, several techniques based on radionuclide imaging have been developed to quantify the severity and type of mechanical dyssynchrony and myocardial scar as an alternative approach for imaging-guided CRT lead placement. , A strength of radionuclide imaging for assessing mechanical dyssynchrony is that measurements are largely automated, thereby minimizing intraobserver and interobserver variability, which is one of the main limitations of echocardiography.
Imaging methods to assess mechanical dyssynchrony
The radionuclide imaging method for measuring mechanical dyssynchrony is called phase analysis, and it uses quantitative analyses of myocardial radiotracer and its temporal changes. By using Fourier Harmonic functions, phase analysis can estimate wall thickness during the cardiac cycle and the regional timing of ventricular contraction. Three radionuclide imaging modalities allow for the evaluation of mechanical dyssynchrony: gated single photon emission computed tomography (GSPECT) myocardial perfusion imaging (MPI), positron emission tomography (PET), and equilibrium radionuclide angiography (ERNA, also known as multigated acquisition scan [MUGA]).
As described in Chapters 7 and 8 , GSPECT MPI is used to quantify the LV ejection fraction (LVEF) and volumes to improve risk stratification in patients with known or suspected CAD. , GSPECT MPI is currently the most commonly used radionuclide imaging technique to assess the variability and timing of LV segmental contraction and relaxation. Nevertheless, PET MPI and ERNA/MUGA may also be used. The latter can assess mechanical dyssynchrony of the left and the right ventricles. Table 27.1 provides an overview of the three radionuclide imaging modalities.
| Modality | Technical Aspects | Advantages | Limitations |
|---|---|---|---|
| GSPECT |
|
|
|
| PET |
|
|
|
| ERNA/MUGA |
|
|
|
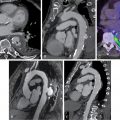
Echocardiography-based techniques, such as M-mode, tissue Doppler imaging, and speckle tracking electrocardiography using strain analysis can provide an analysis of LVMD and interventricular mechanical dyssynchrony with high temporal resolution images. MRI has the highest spatial resolution, can temporally quantify LV contraction, and can visualize veins and scar. Nevertheless, MRI is not widely available, has a high cost, and is difficult to use after device implantation.
Gated single photon emission computed tomography myocardial perfusion imaging
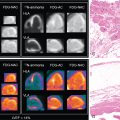
The analysis of LVMD includes an automated process that is performed by commercial software. The process includes the postprocessing of rest and/or stress GSPECT MPI data. Measurements of systolic LVMD become readily available within minutes of study completion. Automated processing of diastolic LVMD measurements is currently not commercially available. Measurements of LVMD are obtained via a so-called phase analysis, which includes several consecutive processing steps leading to the final measurements that are expressed as phase standard deviation (SD) and phase bandwidth (BW). Regional maximal count detection is conducted for each temporal frame using the standard short-axis GSPECT images. The phase analysis relies on the partial volume effect whereby changes in regional counts are proportional to changes in regional myocardial wall thickening over the cardiac cycle. For each cardiac segment, a phase angle representing the onset of mechanical contraction or relaxation is generated. After the onset of mechanical contraction/relaxation phase angles of the entire LV are generated, a phase distribution that provides data on the degree of systolic and diastolic dyssynchrony is generated. The phase distribution is displayed in a polar map using a color-coded scheme and a phase histogram. Fig. 27.3 shows the steps in the phase analysis. The phase histogram is used to calculate systolic SD and systolic BW as measures of LV systolic and diastolic dyssynchrony.

The calculated phase analysis describes the myocardium in a normalized phase polar map with a normalized phase histogram from 0 degrees to 360 degrees ( Fig. 27.4 ). The following measurements of dyssynchrony are derived from the phase histogram :
- (1)
Peak phase: the most frequent phase (peak of the histogram)
- (2)
Phase SD: standard deviation of the mean phase distribution (relative synchrony/heterogeneity of the LV contraction)
- (3)
Phase BW: 95% of elements in the histogram (time in which 95% of the LV is contracting)

These parameters can be derived either in the systolic or diastolic phase. In Fig. 27.4 , mean ±σ corresponds to phase SD, whereas mean ±2σ corresponds to phase BW. Other phase analysis measurements include phase histogram skewness (symmetry of histogram) and kurtosis (the degree to which the histogram is peaked).
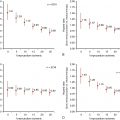
In 2005, Chen et al. proposed the first phase analysis parameters used for dyssynchrony using GSPECT MPI. The phase SD and phase BW were determined to be most reliable and representative of mechanical dyssynchrony. Normal mean and median ranges (degree) of dyssynchrony parameters measured in a healthy population are presented in Table 27.2 . A higher phase SD and BW correlate with a higher degree of systolic and diastolic LVMD ( Fig. 27.5 ). These parameters have been found to correlate well with tissue Doppler echocardiography measurements of dyssynchrony and speckle tracking echocardiography. ,
| Dyssynchrony Parameter | Mean Degree +/− SD | Median Degree (IQR) |
|---|---|---|
| Systolic phase bandwidth | 55 +/− 40 | 42 (32–63) |
| Diastolic phase bandwidth | 67 +/− 44 | 51 (38–83) |
| Systolic phase standard deviation | 21 +/− 13 | 17 (12–28) |
| Diastolic phase standard deviation | 26 +/− 13 | 23 (15–34) |

Related posts:
 Radiopharmaceuticals for clinical SPECT and PET and imaging protocols
 Imaging in patients with acute chest pain in the emergency department
 Key concepts in risk stratification and cost-effectiveness using nuclear scintigraphy in stable coronary artery disease
 Patient with known or suspected cardiac sarcoidosis
 Artificial intelligence in nuclear cardiology
 Large-vessel vasculitis
Stay updated, free articles. Join our Telegram channel

Full access? Get Clinical Tree


