Perfusion Marries Diffusion: Arterial Spin Labeling Prepared IVIM
22.1 Introduction
Noninvasive perfusion imaging can be achieved by two major magnetic resonance techniques: arterial spin labeling (ASL) [1–3] and intravoxel incoherent motion (IVIM) imaging [4, 5]. Whereas the first has been widely and successfully used in diverse brain applications, studies with IVIM imaging of the brain are scarcer. However, attention to IVIM has regained significant interest during the last decade [6–12]. The fact that application of IVIM in the brain is still lagging behind could be attributed to the small cerebral perfusion fraction, approximately 5% of the whole brain, resulting in a low signal-to-noise ratio (SNR) [8, 13].
This chapter will mainly focus on unraveling the signal origin of IVIM using ASL prepared IVIM (ASL-IVIM), and other applications of ASL-IVIM will be also discussed, for instance, water exchange measurement, arterial blood volume measurement, and microvascular flow pattern investigation.
The concept behind ASL-IVIM is relatively easy to understand: the ASL preparation module generates an endogenous tracer by inversion of the magnetization of arterial blood that will first fill up the arterial tree and then subsequently flow into the brain tissue, while the IVIM readout module monitors the diffusion properties of the tissues of interest using various motion-sensitizing gradient strengths. Marrying these two can exclusively limit the influence of the IVIM module to the contribution of the ASL signal, that is, the arterial compartment. By monitoring the ASL signal at multiple timepoints, the IVIM signal can be monitored within different parts of the vascular tree.
22.2 Unravel the Origin of the IVIM Signal
The basic assumption of IVIM is that the blood flow in capillaries, also known as cerebral perfusion, can be considered a pseudodiffu- sion process due to the random orientations of vessels at the capil- lary level of the vascular tree [5]. Traditionally, a two-compartment IVIM model is employed to separate the contribution of perfusion from diffusion effects: a slow compartment in which the signal de- cays slowly as a function of diffusion weighting (i.e., b value) and a fast compartment where the signal drops much faster as a function of the b value due to the faster-moving spins in the pseudorandom capillaries, that is, perfusion instead of diffusion. The main concern regarding the validity of this model is that a distribution of velocities as well as nonrandom orientations could result in a more complex relationship than the simple biexponential assumption. Doubts on the validity of the IVIM approach have arisen, for example, from the reported ratio of gray and white matter cerebral blood flow (CBF) with IVIM, which is frequently much lower compared to values obtained from other techniques (dynamic susceptibility contrast [DSC], ASL, O15-H2O positron emission tomography [PET]) [7, 11, 14, 15]. To better understand the signal generation mechanisms of IVIM, it is important to be able to exclusively measure the diffusion properties of the blood pool and to do this for different parts of the vascular tree. By employing ASL-IVIM the contribution of the arte- rial compartment can be isolated. The blood signal as a function of b values can be further investigated while the blood traverses through the different subparts of the vascular tree, by employing ASL at dif- ferent delay times. Not only is this important for increasing our un- derstanding of cerebral IVIM studies, it can also result in a wealth of information on the cerebral hemodynamics.
To achieve the goal of understanding the origin of the IVIM signal, an ASL-IVIM study was recently performed with T 1-adjusted time- encoded pseudocontinuous ASL (te-pCASL) as an ASL preparation in combination with a conventional IVIM readout (eight b values ranging from 0 to 168 s/mm2 achieved by a 90° excitation pulse followed by a bipolar gradient with different gradient strengths) [16]. T 1-adjusted te-pCASL is a very efficient time method to acquire ASL data at multiple postlabeling delay (PLD) times [17, 18]. In te- pCASL, the traditional long labeling duration is divided into several short blocks (in this study 11; block duration values were adjusted to compensate for a T 1 decay of label for each specific block on the basis of an assumed T 1 of blood of 1650 ms, resulting in approximately similar SNRs for all blocks), whereas the label/control condition of each block is varied according to a Hadamard matrix encoding scheme (Fig 22.1).

Figure 22.1 Sequence diagram of time-encoded pseudocontinuous arterial spin labeling IVIM (te-pCASL IVIM, order of Hadamard matrix: 12, labeling block duration of 894, 579, 429, 340, 283, 241, 211, 187, 168, 153, and 115 ms resulting in a total labeling duration of 3600 ms) and a Hadamard decoding scheme for a specific block (block number 11). The red and yellow blocks represent the label and control conditions, respectively. When applying this specific decoding scheme, for all blocks except block number 11, the contribution of a specific labeling (control) block is cancelled by the subtraction of the label (control) block of another line from the Hadamard acquisition, resulting in zero net signal. For the 11th block, a proper ASL signal is obtained (6*control–6*label).
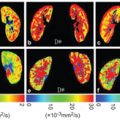
After Hadamard decoding, perfusion images can be reconstruct- ed for all blocks that have similar SNRs to a traditional pCASL experi- ment, with the labeling duration equal to the duration of the specific labeling block, a PLD equal to the time between the end of the block and the start of the readout (Fig 22.2), and an equal number of ac- quisitions (i.e., equal scan time when the repetition time (TR) of the sequence would be the same). The same decoding technique was performed for each of the b values.
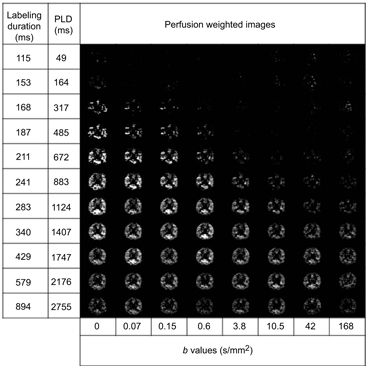
Figure 22.2 Hadamard-decoded, ASL prepared IVIM images for different PLDs and different b values. Reprinted from Ref. [16], with permission from John Wiley and Sons, copyright 2017.
The value of ASL-IVIM signals averaged over the whole brain gray matter mask was first fitted as a function of b value to a monoexponential model:
S ASL(PLD, τ) is the amplitude of the ASL signal without any diffusion weighting for a certain PLD and labeling duration of a block (t). This model assumes that the entire all signal originates from the arterial compartment, that is, it reflects only the perfusion compartment of the IVIM model. However, labeled spins in ASL are known to cross the blood–brain barrier (BBB) almost unrestricted, and therefore one can expect that some of the signal of an ASL-IVIM experiment originates from the extravascular compartment.
To further distinguish the intravascular and extravascular contributions to the ASL signal, an alternative two-compartment, biexponential model can be employed:
Here, S ASL_intra(PLD, τ) and S ASL_extra(PLD, τ) are the amplitudes of the intravascular and extravascular ASL signals for a certain PLD and labeling duration (τ) without any diffusion weighting and D intra and D extra are the pseudodiffusion coefficients of the intravascular and extravascular compartments, respectively.
According to the results published by Zhang et al., the pseudodiffusion coefficient D* as calculated from ASL-IVIM data using the monoexponential model was found to decrease exponentially for 883 ms < PLD < 2176 ms, while it was relatively stable for PLDs > 2176 ms (Fig 22.3) [16]. The fast compartment of the conventional IVIM experiment showed comparable apparent diffusion values as the ASL signal with PLDs between 1747 ms and 2176 ms. Very high D* values of 8 ~ 13 mm2/s were observed for short PLDs, which can be explained by the fact that the ASL signal was still present in larger arteries for these short PLDs. For longer PLDs the labeled blood travels further down the vascular tree, with D* decreasing exponentially, suggesting that more and more of the ASL signal originates from the microvasculature or even originates from the extravascular compartment of the brain tissue. Finally, for the longest PLDs, that is, 2176 and 2755 ms, the D* remains relatively stable, suggesting that the inverted spins have extravasated into the extravascular compartment, reflecting diffusion in tissue. To distinguish the intravascular and extravascular contributions of the ASL signal the two-compartment biexponential model was also applied. In general, the biexponential fitting was found to describe the ASL signal more accurately as a function of the b value. The averaged extravascular D at long PLDs (PLD > 2176 ms) was found to be ~1.9 ± 1.4 × 10⁻³ mm2/s, which is two times lower than the D* using the monoexponential model (~4.0 ± 2.8 × 10⁻³ mm2/s). This lower value could be explained by the fact that the monoexponential model is indeed too simplified, resulting in a weighted average between diffusion properties of the intravascular and extravascular ASL signal. However, the D extravascular is still two times higher than the diffusion coefficient of the slow compartment (0.90 ± 0.05 × 10⁻³ mm2/s) of the conventional IVIM experiment, which might again indicate that the ASL signal does not exchange with the complete extravascular compartment but with only a subpart.

Figure 22.3 Pseudodiffusion coefficient D* (a) and the natural logarithm of D* (b) as obtained from the monoexponential fit to the ASL-IVIM data; D intra (c), natural logarithm of D intravascular (d), D extravascular (e), and the natural logarithm of D extravascular (f) for different PLDs as obtained from the biexponential fit. The error bars represent the standard error of the mean values among the subjects. Reprinted from Ref. [16], with permission from John Wiley and Sons, copyright 2017.
Related posts:

Stay updated, free articles. Join our Telegram channel

Full access? Get Clinical Tree


