Head and Neck IVIM MRI
7.1 Authentic and Geographic Estimations of Perfusion and Diffusion Properties for Head and Neck IVIM MRI
IVIM imaging can be characterized by three parameters: pure diffusion coefficient (D), microvascular volume fraction (f), and perfusion-related incoherent microcirculation (D*) [1, 2]. In general, the perfusion/diffusion parameters can be determined by using the least-squares method from a multiexponential signal decay curve obtained with multiple b values, usually ≥8, including a b value of 0 s/mm2 and spanning from low (<200 s/mm2) to high (200–1000 s/mm2) values. As many numbers of b values less than 200 s/mm2 as possible should be used for precisely characterizing the decay curve, which is predominantly influenced by tissue perfusion. However, increases in the number of b values used will extend the scan time and increase the chances of patient motion.
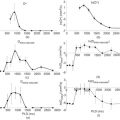
In brief, D can be obtained by the least-squares method using signals in logarithm at high b values (e.g., ln S 200, ln S 300, ln S 400, and ln S 800, as in Fig 7.1a,b). To estimate f, an initial f value is calculated as (S 0–S inter)/S 0, where S 0 is the signal intensity at b = 0 s/mm2 and S inter is the interception of the logarithmic regression line obtained by using b values of 200, 300, 400, and 800 s/mm2 with the y axis.
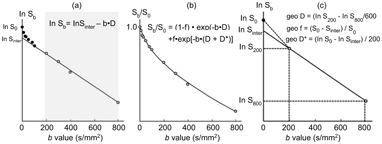
Figure 7.1 IVIM parameter determination by the least-squares or geometric methods. (a, b) The least-squares method. The left panel (a) shows a representative signal decay curve obtained by using 11 b values (0, 10, 20, 30, 50, 80, 100, 200, 300, 400, and 800 s/mm2). First, D (fit D) can be obtained by the least-squares method using ln S 200, ln S 300, ln S 400, and ln S 800, and the initial f value is calculated as (S 0 – S inter)/S 0, where S inter is the interception of the logarithmic regression line obtained by using b values of 200, 300, 400, and 800 s/mm2 with the y axis. The middle panel (b) shows the relationship between S b/S 0 and varying b values. When fit D and initial f and D* values are given, f (fit f) and D* (fit D*) values can be obtained by the least-squares method on the basis of the equation S b/S 0 = (1 – f)◊exp(–bD) + f◊[–b(D +D*)]. (c) The geometric method. The graph shows geometric determination of IVIM parameters using 3 (0, 200, and 800 s/mm2) of the 11 b values. D is calculated by the equation geo D = (ln S 200 – In S 800)/600. f is estimated by the equation geo f = (S 0 – S inter)/S 0, and geo D* is estimated by the equation geo D* = (ln S 0 – In S inter)/200.
The initial D* value of 0.01 was successfully used for assessing the IVIM of salivary gland tumors [3]. When the D, initial f, and initial D* values are given, f (fit f) and D* (fit D*) values can be obtained using a nonlinear regression algorithm based on the following equation:
(7.1)
Fit f and fit D* values can be obtained after substituting the initial f and D* values into the Levenberg–Marquardt algorithm [4].
IVIM analysis using the least-squares method is cumbersome and time consuming and thus may not be suitable for routine clinical use. Accordingly, several techniques have been developed to simplify the procedures for estimating the diffusion and perfusion properties [5–8]. These simplified techniques may have some shortcomings in precisely determining IVIM parameters compared to the analysis using the least-squares method. However, a comparative study has recently demonstrated that the geometric estimation of IVIM parameters using a limited number of b values is a simple and reliable technique for diagnosing a wide spectrum of head and neck tumors [9]. In the simplified geometric method (geo), the number of b values used can be limited to as few as three (e.g., b = 0, 200, and 800 s/mm2, as shown in Fig 7.1c). By using logarithmic plots, D can be estimated as a decline between b = 200 s/mm2 and b = 800 s/mm2:
(7.2)
When an estimated D value is given, we can then estimate the tissue perfusion fraction by geometrically determining f as follows:
(7.3)
where S 0 is the signal intensity at b = 0 s/mm2 and S inter is the interception of the logarithmic regression line obtained by using b values of 200 and 800 s/mm2 with the y-axis. The perfusion property
geo D* can also be geometrically estimated as follows:
(7.4)
In the least-squares method, we can use fit D* for estimating the perfusion properties of a tissue. However, the perfusion parameter geo D* is heavily weighted toward the extravascular space. Therefore, geo D* is basically different from fit D* [9]. However, as mentioned in the later section of this chapter, geo D and geo f are very close to the corresponding parameters fit D and fit f, respectively, in terms of the value levels as well as diagnostic efficacy for different types of head and neck tumors.
7.2 Head and Neck Squamous Cell Carcinomas
7.2.1 Perfusion and Diffusion Characteristics of Head and Neck Squamous Cell Carcinomas
Squamous cell carcinomas are the most common malignancy of the head and neck, occurring in the oral cavity, nasopharynx, oropharynx, hypopharynx, larynx, and paranasal sinuses. Several researchers have attempted to evaluate the usefulness of IVIM models in characterizing perfusion and diffusion properties of head and neck squamous cell carcinomas. Among them, Sumi and Nakamura [8, 10] effectively characterized head and neck squamous cell carcinomas in comparison with the other types of head and neck tumors using geometrically determined microvascular volume fraction (geo f) and pure diffusion coefficient (geo D) based on the IVIM model obtained with b values of 0, 500, and 1000 s/mm2. These studies have shown that the geo f and geo D values are significantly different among the malignant as well as benign tumors (lymphomas, squamous cell carcinomas, and benign and malignant salivary gland tumors) (Fig 7.2). Distinctive histological structures of particular types of head and neck tumors may successfully explain the differences in geo f and geo D values among the different types of head and neck tumors; for instance, lymphomas exclusively contain dense proliferations of lymphoid cells with scarce amounts of stromal tissues between the tumor cells, both restraining the water diffusivity within the tumors. However, squamous cell carcinomas have varying amounts of stromal tissues depending on the tumor grade, ranging from poor or undifferentiated to well-differentiated histology. Large stromal tissue areas within squamous cell carcinoma may increase the tumor perfusion. Aberrant perfusion with dysfunctional capillaries within the solid tumor would produce hypoxic microenvironments and resultant areas of necrosis, developing into areas with varying degrees of higher diffusivity depending on the necrotic contents (liquefaction or coagulation necrosis) [11]. Keratin deposits in the stromal tissues in squamous cell carcinomas could also influence the water diffusivity.
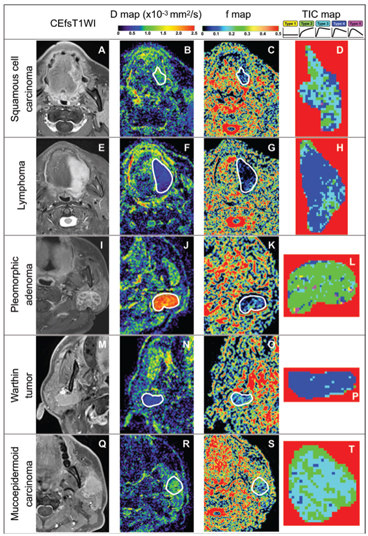
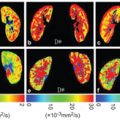
Figure 7.2 Representative contrast-enhanced fat-suppressed T1-weighted MR images (CEfsT1WI) and geo D, geo f, and TIC maps of squamous cell carcinoma, lymphoma, pleomorphic adenoma, Warthin tumor, and mucoepidermoid carcinoma. (A–D)A 56-year-old man with SCC in the tongue (A). D = 0.85 × 10⁻³ mm2/s (B), geo f = 0.097 (C), and overall TIC profile = Type 3 (D). (E–H) An 80-year-old woman with non-Hodgkin lymphoma (large B-cell lymphoma) in the tongue (E). D = 0.46 × 10⁻³ mm2/s (F), geo f = 0.031 (G), and overall TIC profile = Type 4(H). (I–L) A 66-year-old woman with a pleomorphic adenoma in the left parotid gland (I). D = 2.25 × 10⁻³ mm2/s (J), geo f = 0.083 (K), and TIC profile = Type 2 (L). (M–P) A 69-year-old man with a Warthin tumor in the right parotid gland (M). D = 0.56 × 10⁻³ mm2/s (N), geo f = 0.124 (O), and TIC profile = Type 4 (P). (Q–T) A 53-year-old man with mucoepidermoid carcinoma in the left parotid gland (Q). D = 0.89 × 10⁻³ mm2/s (R), geo f = 0.154 (S), and TIC profile = Type 3 (T). White demarcations on D (B, F, J, N, and R) and geo f maps (C, G, K, O, and S) indicate tumor areas. Tumor areas are cropped on TIC maps (D, H, L, P, and T).Geo D and f values were calculated using b values of 500 and 1000 s/mm2. TICs in each pixel of the tumor area can be categorized into five types (Type 1–5) on the basis of the increment ratio, the peak time, and the washout ratio according to the following formulas: Increment ratio (%) = (SIpeak – SIpre) × 100/SIpre, peak time (s) = time corresponding to the SIpeak, and washout ratio (%) = (SIpeak – SI3min) × 100/(SIpeak – SIpre). SIpeak is the signal intensity at peak, SIpre is the signal intensity of pre-enhancement, SI3min is the signal intensity 180 s after the start of the contrast medium injection, Tpre is the time at pre-enhancement, T3minis 180 s after the start of the contrast medium injection, and Tpeak is the time required to reach the intensity peak. The TIC patterns are, for example, referred to as flat (increment ratio ≤20%; Type 1), slow uptake (increment ratio >20% and peak time ≥120 s; Type 2), rapid uptake with a low washout ratio (increment ratio >20%, peak time <120 s, and washout ratio <30%; Type 3), rapid uptake with a high washout ratio (increment ratio >20%, peak time <120s, and washout ratio ≥30%/<70%; Type 4), and miscellaneous (increment ratio >20%, peak time<120 s, and washout ratio ≥70%; Type 5).
The D values of squamous cell carcinomas are significantly larger than those of lymphomas, smaller than those of pleomorphic adenomas, similar to those of Warthin tumors, and smaller than those of malignant salivary gland tumors; and the f values of squamous cell carcinomas are significantly larger than those of lymphomas, similar to those of pleomorphic adenomas, and smaller than those of Warthin tumors and malignant salivary gland tumors [8, 10]. Alternatively, schwannomas have a wide spectrum of f and D values, which greatly overlap those of squamous cell carcinomas and salivary gland tumors. Schwannomas are characteristically composed of mixtures of cellular Antoni type A areas with Verocay bodies and hypocellular Antoni type B areas. The Antoni type B areas often contain small ectatic vessels. This histological diversity in schwannomas is well correlated with the wide spectrum of the IVIM parameters [8].
The large overlaps in the f and D values of head and neck tumors may diminish the value of these parameters in differentiating between tumors with different histological types. This is partly because the other IVIM perfusion parameter D* is less precise and less informative in diagnosing different tumor types with different perfusion characteristics. However, additional perfusion information, for example, perfusion kinetic parameters obtained by time intensity curve (TIC) analysis from dynamic contrast–enhanced (DCE) MRI, could improve the ability of the IVIM parameters to differentiate between some types of head and neck tumors. This concept is based on the fact that some TIC kinetic parameters are useful for differentiating between some types of head and neck tumors and the parameters are well correlated with the IVIM perfusion parameters [12–16]. The strategy for the combined use of TIC and IVIM parameters may differ between different sets of tumor types; however, a successful approach has been reported as follows: First, tumors can be classified into those with Type 2, Type 3, Type 4, or Type 5 profiles (see legends for Fig 7.2). Then, the tumors in each category with a distinctive TIC profile can be further classified into particular tumor types according to the f and D value levels based on the cluster analysis [10]. This stepwise approach using TIC profiles and IVIM parameters with varying thresholds can effectively differentiate between benign and malignant tumors with 97% accuracy and diagnose different tumor types with 89% accuracy in that study.
7.2.2 Metastatic vs. Nonmetastatic Lymph Nodes in the Neck
Lymph node metastasis is a critical prognostic factor in patients with head and neck squamous cell carcinoma. The presence of one or more metastatic nodes in the neck greatly affects the locoregional control, the treatment strategy, and even patient survival [17]. MRI has been evaluated as a diagnostic tool for neck diseases in patients with head and neck squamous cell carcinoma [11,18,19]. However, the application of IVIM imaging to the diagnosis of metastatic nodes in the neck has been very limited, mainly because metastatic nodes are often small in size (<10 mm), with potentially poor precision in measuring IVIM parameters using multiple b values, and partly because the whole neck is often outside the scope of IVIM MRI for primary tumors so as to avoid unfavorably extended scan times.
Information about extranodal spread (ENS) has been recently included in staging patients with head and neck cancer [20, 21]. Actually, ENS is a dominant risk factor for survival in patients with head and neck squamous cell carcinoma [22]. Although the usefulness of IVIM imaging in detecting ENS has not been evaluated, pathognomonic changes in perfusion and diffusion parameters can be assumed in ENS-positive metastatic nodes, where the TIC profiles largely shift from dominant Type 3 rapid uptake with a low washout ratio or Type 4 rapid uptake with a high washout ratio pattern into dominant Type 2 slow uptake patterns [23] (Fig 7.3).
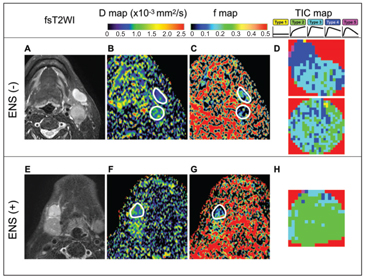
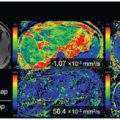
Figure 7.3 Representative fat-suppressed T2-weighted MR images (fsT2WI) and geo D, geo f, and TIC maps of metastatic nodes with or without extranodal spread (ENS). (A–D) A 55-year-old man with SCC in the oropharynx and ENS- negative, ENS (–), metastatic nodes in the neck levels IB and IIA (A), D = 0.60 × 10⁻³ mm2/s (IB) and 0.64 × 10⁻³ mm2/s (IIA) (B), geo f = 0.207 (IB) and 0.131 (IIA) (C), and overall TIC profile = Type 3 (IB) and Type 3 (IIA) (D). Geo D and f values were calculated using b values of 500 and 1000 s/mm2. (E–H) A 74-year-old man with SCC in the floor of the mouth and ENS-positive, ENS (+), metastatic node in the neck level IB (E). D = 0.74 × 10⁻³ mm2/s (F), geo f = 0.115 (G), and overall TIC profile = Type 2 (H). White demarcations on geo D (C, G) and geo f maps (D, H) indicate areas of metastatic nodes with (G) or without (C) ENS. Note that nodal areas with a Type 2 TIC profile are predominant in an ENS (+) node (H); however, nodal areas with Type 3 or 4 TIC profiles are predominant in ENS (–) nodes (D). Geo D and f values were calculated using b values of 500 and 1000 s/mm2.
7.2.3 Prediction of Treatment Response in Head and Neck Cancer
One of the major issues in the clinical application of IVIM MRI in patients with head and neck carcinoma is the potential of the MR technique for predicting treatment responses. Several researchers have attempted to evaluate the usefulness of IVIM parameters in predicting responses of the primary tumors or metastatic nodes to chemoradiotherapy/nonadjuvant chemotherapy [24–29]. The general consensus among these studies is that the baseline and interval changes of some IVIM parameters may be useful for predicting treatment responses of the primary tumors and metastatic lymph nodes in the necks of patients with head and neck cancer. For example, the baseline D values of nasopharyngeal carcinomas (NPCs) in responders to nonadjuvant chemotherapy are significantly lower than those of the cancer in nonresponders, with the best cutoff threshold of D = 0.911 × 10⁻³ mm2/s; and the interval changes in D, f, and D* values of responders during treatment periods are significantly greater than those of nonresponders [24]. Another study using a cohort of patients with human papillomavirus (HPV)-positive or HPV-negative head and neck cancers of the oropharynx and unknown in origin showed that interval changes in D values during chemoradiotherapy are significantly higher for a complete response (CR) group than those for a non-CR group [25]. A tumor that is epithelial in origin with a low baseline D value is supposedly composed of densely packed small cancer cells with poorly differentiated characteristics, which is considered to be more sensitive to chemoradiotherapy compared with a tumor with a higher D value. Increases in f and D* values during radiochemotherapy may be caused by improved vascular network within the solid tumors, which will lead to improved vascular microenvironments and accelerated immune responses of the host. On the other hand, greater increases in D values during the treatment indicate higher rates of cell death in tumors of responders.
Similar findings with IVIM parameters have been reported for the prediction of treatment responses in metastatic nodes of patients with head and neck cancer. In patients with locally advanced head and neck carcinomas who had undergone chemoradiotherapy without surgical intervention, high baseline f values and higher interval changes in f and f × D* values in the lymph nodes can be predictors of successful locoregional control in the neck [27, 29]. Locoregional failure of primary laryngeal and hypopharyngeal cancers can also be predicted by IVIM estimation of tumor diffusion and perfusion properties. In this case, D values and f values in recurrent tumors are significantly lower than those of post-therapeutic changes, supporting the idea that estimating D and f values can effectively differentiate between these malignant and inflammatory lesions [30]. These results are consistent with the notion that tumor capillaries are leaky and insufficient, while inflammatory lesions are characterized by dilated capillaries and vascular hyperpermeability. Therefore, the tumor microenvironment is associated with decreases in fast-moving blood pools, and the inflammatory lesions contain more pools of fast-moving blood and increased water content in the interstitial tissues. Both D and f values are significantly different between malignant and inflammatory lesions. However, the f value may be the best for differentiating between malignant and inflammatory lesions, considering its higher sensitivity (94% vs. 78%) and accuracy (80% vs. 74%) [30].
7.3 Lymphomas
7.3.1 Perfusion and Diffusion Characteristics of Nodal/ Extranodal Lymphomas
Lymphomas can be classified into several subtypes on the basis of the morphology, immunophenotype, molecular and genetic characteristics, and clinical presentation and course [31]. Classification at the initial stage of patient management is mandatory because not all lymphomas share the same clinical course and the treatment depends on specific histologic features.
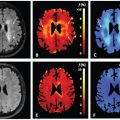
Lymphomas have common MRI features, including characteristically homogeneous signals on T1- and fat-suppressed T2-weighted MR images and low D values [8, 10] (Fig 7.2). These MRI features reflect the histological features of lymphomas largely comprising dense and exclusive proliferation of several types of lymphoid cells. However, some (~20%) lymphoma nodes (nodal lymphomas) contain nonenhanced areas in contrast-enhanced MR images [11] (Fig 7.4). D values of lymphoma nodes without focal defects, which were determined as signal declines between b values of 500 and 1000 s/mm2, were significantly smaller than those of metastatic nodes without focal defects (0.45 ± 0.10 vs. 0.96 ± 0.31 × 10⁻³ mm2/s, respectively). Although D value levels of focal defects in lymphoma nodes were also significantly smaller than those of focal defects in metastatic nodes, the values for lymphomas as well as metastatic nodes were widely distributed and greatly overlapped with each other (1.09 ± 0.41 for lymphomas vs. 1.42 ± 0.53 × 10⁻³ mm2/s for metastatic nodes) (Fig 7.4). The broad range of D values in metastatic nodes may be attributable to the different viscosity of coagulation and liquefaction necrosis in the metastatic nodes, with the former type having lower D values compared to the latter. On the other hand, necrotic tissues in lymphoma nodes may represent necrotizing granulomas mimicking tuberculosis with a high viscosity of caseous materials [32]. As a result, the D values of lymphoma nodes with focal defects were at levels similar to those of metastatic nodes with focal defects (1.09 ± 0.41 vs. 1.42 ± 0.53 × 10⁻³ mm2/s, respectively). Accordingly, the D value cutoff threshold of 0.6 × 10⁻³ mm2/s for the entire node was the best for discriminating between lymphoma from metastatic nodes without focal defects; and the D value cutoff threshold of 1.45 × 10⁻³ mm2/s for focal defects was the best for differentiating between lymphomas and metastatic nodes with focal defects [11]. The presence or absence of focal defects and the nature of the defects in lymphoma nodes may be an important prognostic indicator in patients with non-Hodgkin lymphoma [33].
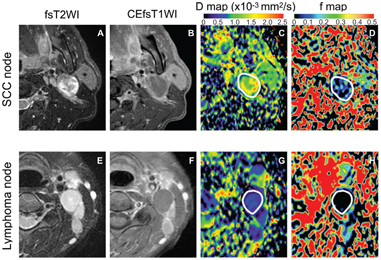
Figure 7.4 Representative fat-suppressed T2-weighted (fsT2WI) and contrast- enhanced fat-suppressed T1-weighted (CEfsT1WI) MR images and geo D and geo f maps of metastatic (SCC node) and lymphoma nodes with focal defects. (A–D) A 52-year-old man with SCC in the tongue. A metastatic node in the neck level IIA (A) contains a large nonenhanced area (B) with D = 1.32 × 10⁻³ mm2/s (C) and geo f = 0.092 (D). (E–H) A 50-year-old woman with adult T-cell leukemia lymphoma. A lymphoma node in the neck level IIA (E) contains a large nonenhanced area (F), with D = 0.47 × 10⁻³ mm2/s (G) and geo f = 0 (H). White demarcations on geo D (C, G) and geo f maps (D, H) indicate areas of focal defect (nonenhanced areas) within the nodes. Note that some perfusion activity remains in the focal defect of the metastatic node (D) but apparent perfusion signals are not detected in that of lymphoma node (H). Geo D and f values were calculated using b values of 500 and 1000 s/mm2.
Related posts:
Stay updated, free articles. Join our Telegram channel

Full access? Get Clinical Tree


