Liver Fibrosis
10.1 Introduction
The stage of liver fibrosis is a strong determinant of the risk of hepatocellular carcinoma and its prognosis, so staging of hepatic fibrosis is important in the management of patients with chronic liver disease [1, 2]. End-stage liver fibrosis (cirrhosis) causes liver failure and is typically irreversible, whereas liver fibrosis in the early to intermediate stages can be treatable [3]. Therefore, early detection and staging of liver fibrosis are crucial for planning and monitoring the response to therapy. Liver biopsy followed by histopathologic assessment is commonly performed to stage liver fibrosis. However, biopsy may have severe complications, including hemorrhage and infection. Biopsy also has inherent drawbacks, including sampling error because of the small specimen sample, interobserver disagreement, and low patient acceptance [4–6]. Despite these limitations, biopsy is still considered the golden standard for staging liver fibrosis. Therefore, noninvasive methods have been developed for assessing hepatic fibrosis, including serum markers and imaging-based methods.
10.2 Pathologic Features of Liver Fibrosis
When the liver parenchyma is damaged, regardless of the cause, which includes viral hepatitis, alcoholic or nonalcoholic steatohepatitis, or an autoimmune-related disorder, fibroblasts proliferate and produce collagen around the sinusoids. The collagen inhibits the molecular exchange between the sinusoids and hepatocytes. Abnormal communication between the hepatic arteries and veins or the portal vein is part of the pathologic state, and changes in diffusivity of molecules can be observed with diffusion-weighted imaging (DWI) or intravoxel incoherent motion (IVIM) imaging. Histopathologic assessment of liver fibrosis is usually performed using hematoxylin- eosin and Masson trichrome staining to determine the fibrosis stage (F score) using the METAVIR (meta-analysis of histological data in viral hepatitis) scoring system, that is, F0, no fibrosis; F1, portal fibrosis without bridging fibrosis; F2, portal fibrosis with bridging fibrosis; F3, portal and bridging fibrosis with deformity of hepatic lobules; and F4, cirrhosis [7, 8]. F2 and F3 are often called significant fibrosis and severe fibrosis, respectively.
10.3 ADC Value for Staging Liver Fibrosis
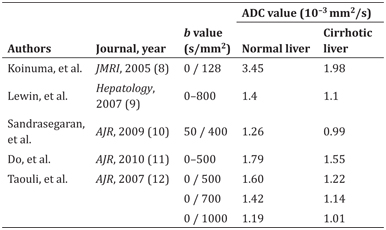
In general, the apparent diffusion coefficient (ADC) value (a monoexponential model-based diffusivity estimation) decreases with progression of liver fibrosis. Several studies have compared the ADC values of normal livers with those of cirrhotic livers. All five reports [9–13] listed in Table 10.1 show reduced ADC values in the cirrhotic liver. It is important to note that the ADC values of normal and cirrhotic livers vary according to the b values used in the study. The ADC value is mainly determined by two types of molecular movement, that is, molecular diffusion in solid tissue and microcirculation in vessels (perfusion) [14]. The liver is a highly vascularized organ, so perfusion-related effects are not negligible when assessing diffusivity by DWI. One of the above-mentioned reports concluded that DWI with a b value of 700 s/mm2 had a higher ability than DWI with a b value of 1000 s/mm2 to differentiate cirrhotic livers from normal livers (with Az values of 0.901 and 0.832, respectively) [13].
Table 10.1 Comparison of ADC values between normal and cirrhotic liver
10.4 IVIM for Staging Liver Fibrosis
IVIM DWI is a biexponential model-based method that is used for simultaneous estimation of both perfusion-related (fast) and molecular diffusion–related (slow) diffusivity and analyzes the signal decay of multi-b-value diffusion-weighted images [14, 15]. The histopathologic structures of the liver are altered by fibrosis, so diffusivity measured by DWI or IVIM is strongly affected by the degree of fibrosis. Accumulation of collagen deposits increases the resistance of the portal system to blood flow, which in turn decreases the velocity of portal blood flow and increases the pressure in the portal system. IVIM is thought to be more suitable than DWI (monoexponential) in terms of precise estimation of the events occurring in a liver with fibrosis and uses the following three parameters: true diffusion, denoted by D; pseudodiffusion (perfusion), denoted by D*; and the perfusion fraction, denoted by f [16].
10.4.1 Diagnostic Performance of IVIM for Liver Fibrosis
According to a recent systematic review and meta-analysis of studies that included DWI and IVIM [17], pooled sensitivity values with corresponding 95% confidence intervals (CIs) for liver fibrosis ≥F1, ≥F2, ≥F3, and F4 were 0.78 (95% CI 0.75–0.82), 0.81 (95% CI 0.78–0.84), 0.71 (95% CI 0.67–0.75), and 0.80 (95% CI 0.75–0.85), respectively. Pooled specificity values for liver fibrosis ≥F1, ≥F2, ≥F3, and F4 were 0.78 (95% CI 0.73–0.82), 0.80 (95% CI 0.76–0.83), 0.84 (95% CI 0.81–0.86), and 0.77 (95% CI 0.74–0.81), respectively. The area under the receiver-operating characteristic curve (Az) values that distinguished liver fibrosis ≥F1 from F0, ≥F2 from <F2, ≥F3 from <F3, and F4 from <F4 were 0.8554, 0.8770, 0.8836, and 0.8596, respectively. These results indicate that IVIM has good but not excellent diagnostic accuracy for staging of liver fibrosis (with Az values in the range of 0.8–0.9) when compared with magnetic resonance imaging (MRI) or ultrasound-based elastography (Table 10.2) [17–19].
Table 10.2 Diagnostic results of different liver fibrosis stages compared to magnetic resonance– or ultrasound-based elastography
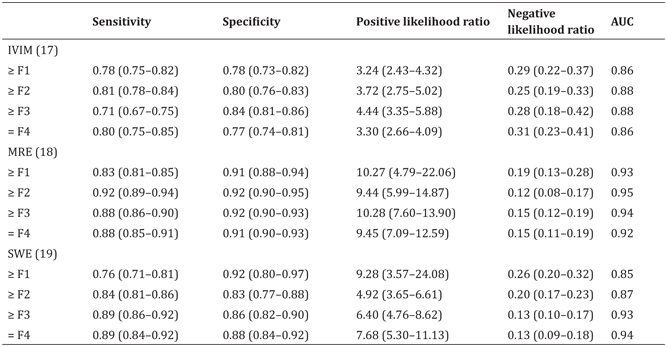
AUC, area under ROC curve; MRE, magnetic resonance elastography; SWE, shear wave elastography
Another meta-analysis [20] that included six papers focusing on IVIM only [21–26] showed that the weighted mean difference (WMD) values for D* and D measurements were statistically significant in terms of distinguishing fibrosis stage (F0 vs. F1–4, WMD=2.46 [95% CI 0.83–4.09, P = 0.006] for D* and 1.62 [95% CI 0.06–3.18, P = 0.027] for f; F0–1 vs. F2–3, 13.10 [95% CI 9.53–16.67, P< 0.001] for D* and 5.63 [95% CI 2.74–8.52, P< 0.001] for f; F1–2 vs. F3–4, 14.34 [95% CI 10.26–18.42, P< 0.001] for D* and 3.30 [95% CI 2.10–4.50, P< 0.001] for f). However, the WMD values were not significant for the D and ADC measurements, except for the ADC of F1–2 versus F3–4 (WMD = 0.07 [95% CI 0.02–0.12, P=0.002]). This meta-analysis suggested that perfusion-related diffusivity (D*) has a larger impact on reduced diffusivity than on true molecular diffusivity (D) in liver fibrosis. Considering the significant hemodynamic changes accompanying fibrosis of the liver, it seems reasonable that changes in D* are substantial in cirrhosis (Figs.10.1–10.3).
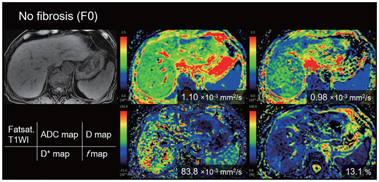
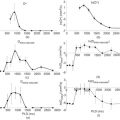
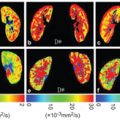
Figure 10.1 An 80-year-old man with no chronic liver disease (F0).
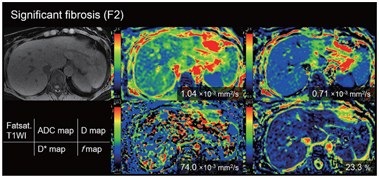
Figure 10.2 A 58-year-old-woman with chronic hepatitis type C (F2).
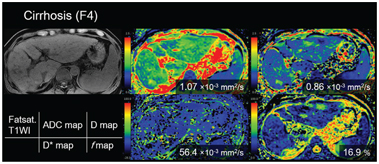
Figure 10.3 A 77-year-old-man with cirrhosis type C (F4). The D* value of the liver decreased as the stage of the liver fibrosis progressed (from the red to the green area dominant in F0 and the blue area dominant in F4). There is no significant trend between the stage of fibrosis and other parameters (apparent diffusion coefficient, D, and f value).
Liver cirrhosis results in architectural changes in the liver parenchyma that have a direct effect on the microcirculation and macrocirculation in the liver. Portal perfusion decreases, while perfusion of the liver is partially compensated for by an increased hepatic arterial blood supply [27]. These changes in the hepatic circulationcan be depictedincontrast-enhanced perfusion computed tomography (CT)/MRI as decreased portal flow and increased arterial flow in the liver [28]. There is a significant correlation between these perfusion CT/MRI-related parameters and the severity of chronic liver disease [28–30]. Reduced D* in cirrhotic livers may represent these alterations in the hepatic circulation or perfusion [31]. In cirrhosis, the proportion of the volume of collagen fibers relative to that of hepatic sinuses could increase, which can reduce the f value. Although we have only collateral evidence, D* and f measured by IVIM may be a biomarker for alteration of liver perfusion in the cirrhotic liver.
10.4.2 Factors Influencing IVIM Values
Magnetic field strength
Theoretically, DWI performed using a 3-T MR unit has the advantage of an improved signal-to-noise ratio in comparison with a 1.5-T MR unit [32
Related posts:
 IVIM MRI: A Window to the Pathophysiology Underlying Cerebral Small Vessel Disease
 Clinical Applications of IVIM MRI to the Nervous System
 Head and Neck IVIM MRI
 Perfusion Marries Diffusion: Arterial Spin Labeling Prepared IVIM
 IVIM MRI in the Kidney
 Clinical Application of IVIM in the Female Pelvis
Stay updated, free articles. Join our Telegram channel

Full access? Get Clinical Tree


