Chapter 9 Pericardial and Myocardial Disease
PERICARDIAL DISEASES
Anatomy
The pericardium can be thought of as similar to the two layers of a deflated balloon, which is wrapped around the heart. One side of that balloon becomes the inner layer (visceral layer), which is wrapped around and closely adheres to the heart and the overlying epicardial fat and coronary arteries. The outer layer (the parietal layer) of the balloon is embedded into the surrounding structures, namely the pericardial fat in the mediastinum.
Instead of air, there is a small amount of fluid (25 to 50 ml) within the balloon. The small amount of fluid between the two layers allows for nearly friction-free motion between the visceral layers of the pericardium (which moves with the beating heart) and the outer parietal portion, which is relatively stationary, fixed to the mediastinum. Like the pleura and peritoneum, the normal pericardium may not be seen along its entire course; it becomes more visible when diseased and thickened or when pericardial effusion is present.
The inner visceral layer of the pericardium, also called serous pericardium or epicardium, is directly attached to the heart and gives a glistening appearance to the heart. The parietal pericardium is attached to the surrounding mediastinum, anteriorly to the superior pericardial sternal ligament, inferiorly to the central tendon of the diaphragm, and posteriorly to the esophagus and descending thoracic aorta. The fat outside the parietal pericardium is called pericardial fat. It is mediastinal fat that is adjacent to the pericardium. The fat inside the visceral pericardium is called epicardial fat, and it is directly attached to the cardiac chambers. The coronary arteries run within the epicardial fat. The visceral pericardium covers both, coronary arteries and epicardial fat. The pericardium does not cover only the heart but also extends about 3 cm into the root of the aorta and pulmonary artery where the visceral and parietal pericardium come together to form the pericardial reflection (Figure 9-1).

FIGURE 9-1 Normal pericardium. Electrocardiography-gated computed tomography appearance of normal pericardium in sagittal reconstruction (A) and oblique aortic root long-axis reconstruction (B) show the pericardium (arrows) extending 3 cm upward on the pulmonary artery (PA) and aorta (AO), where the pericardial reflection site is located. C, Ventricular short-axis reconstruction shows pericardium separating epicardial fat (*) from pericardial fat. Note left anterior descending coronary artery (LAD) running in the epicardial fat. LA, left atrium; LV, left ventricle, RPA, right pulmonary artery; RV, right ventricle.
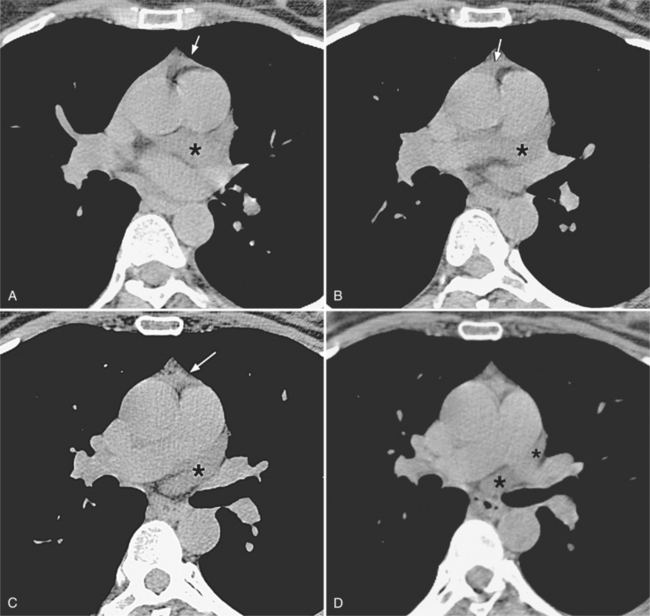
There are a few spaces inside the pericardial cavity in which fluid tends to accumulate and through which surgeons could stick their fingers or pull bypasses if they choose to do so—and sometimes they do. The superior pericardial recess is such a space. It connects the right side and the left side of the pericardial space between the root of the ascending aorta and the right main pulmonary artery (Figure 9-2). Sometimes fluid that has accumulated there may mimic aortic dissection, a thickened aortic wall from arteritis or enlarged lymph nodes. On rare occasions, a surgeon may opt to pull a venous bypass graft through the superior pericardial recess, if the graft is too short to be placed in the typical position anterior to the pulmonary artery (Figure 9-3).

FIGURE 9-2 Superior recess. Electrocardiography-gated computed tomography slices from calcium scoring show superior recessus (*) posterior to main pulmonary artery and wrapping around left pulmonary artery. Note the superior extent of the pericardial space anterior to the aorta and pulmonary artery (arrows).
Normal Appearance on Chest Imaging
The visceral and parietal pericardium and the fluid in the pericardial space cannot usually be differentiated on computed tomography (CT) or magnetic resonance imaging (MRI) because the thickness of the pericardial layers is below the limits of the resolution. If a thickened pericardium is described, it usually refers to the combination of visceral pericardium, pericardial fluid, and parietal pericardium. On CT, secondary signs are helpful to differentiate the cause of the thickening of the pericardial complex. Nodularity and enhancement of the thickened pericardium is suggestive of metastatic disease. Calcification indicates chronic pericarditis. A smoothly thickened pericardial contour is suggestive of, although not diagnostic of, pericardial effusion. One great aid in imaging the pericardium is the fat that covers the outside of the parietal pericardium (pericardial fat) and the fat over the surface of the heart (epicardial fat). On CT and magnetic resonance, the normal thickness of the pericardium between the sternum and the right ventricular free wall is less than 3 mm.
Laterally, the pericardium is usually not visible on CT. On MRI images, chemical shift artifacts may cause the pericardium to look like a thick black line in the frequency encoding direction. Special techniques can be used to investigate the different components of the pericardial contour: Phase contrast images allow for detection of freely moving fluid within the pericardial space. Gradient echo images also are bright where fluid is in motion.
Pericardial Effusion
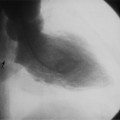
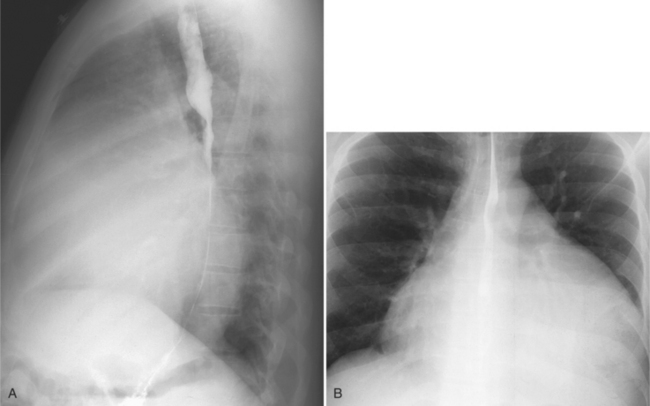
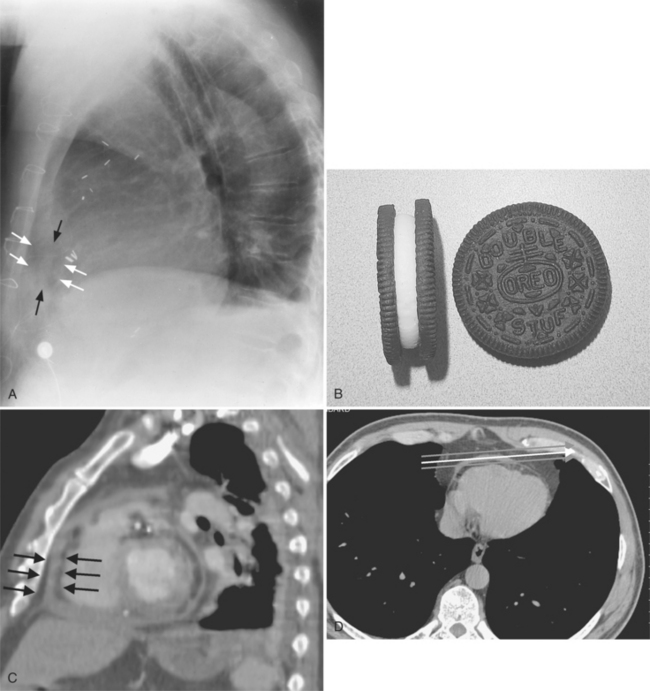
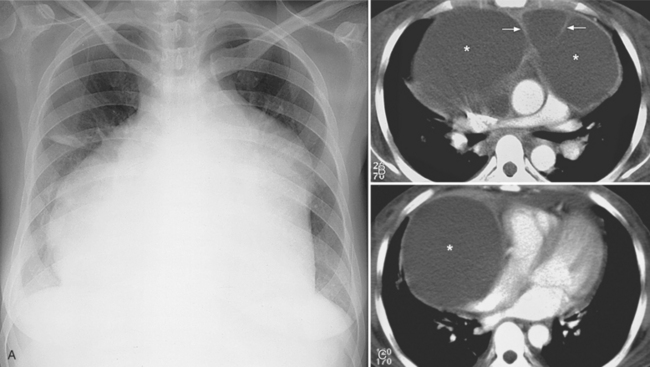
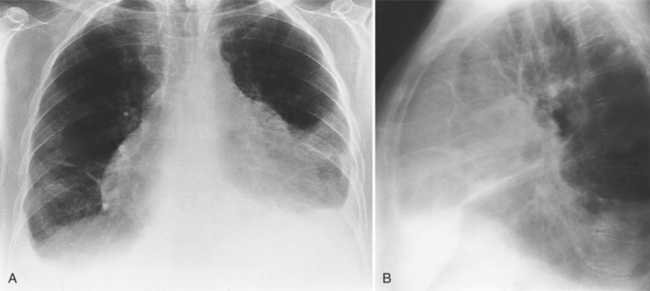
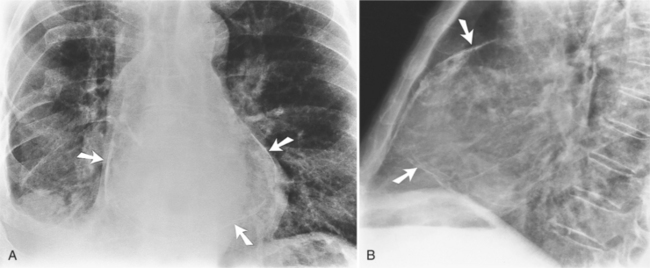
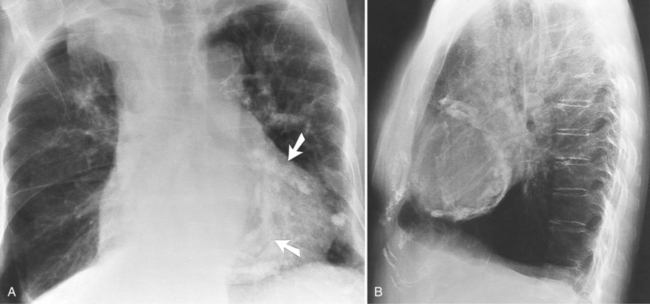
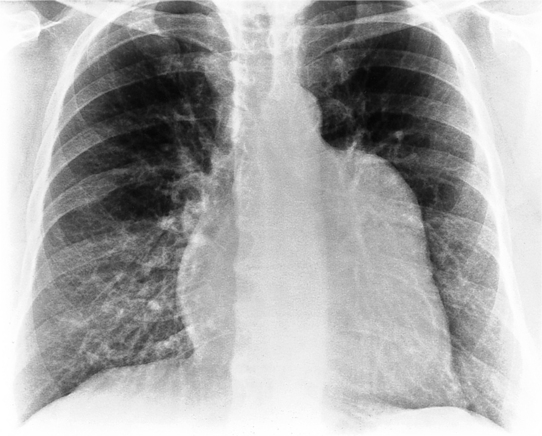
The normal pericardial space in the adult can be distended with 150 to 250 ml of fluid acutely before cardiac tamponade results. Cardiac tamponade is caused by excess fluid in the pericardial space, which compresses the heart and thus causes a low cardiac-output state. In tamponade, the cardiac size on the chest radiograph is slightly to markedly increased. The heart may have a water-bottle appearance in which both sides are rounded and displaced laterally (Figure 9-4). The differential diagnostic considerations for a water-bottle heart are global cardiomegaly, large anterior mediastinal mass, or pericardial effusion. If you are lucky, you may see the Oreo™ cookie sign on the lateral chest x-ray (Figure 9-5). In this sign, a radiolucent stripe behind the sternum (pericardial fat), then a more radiopaque stripe (pericardial effusion), followed by yet another radiolucent stripe (epicardial fat) will be noticed.

FIGURE 9-4 Recurrent chronic pericarditis. A, The large heart shadow represents several liters of pericardial fluid surrounding a normal-sized heart. B, Barium in the esophagus is not displaced posteriorly, indicating that the left atrium is of normal size. Given the overall size of the mediastinum, it is not possible for the heart itself to be this large without left atrial enlargement, so the primary diagnosis must be pericardial effusion.

FIGURE 9-5 Pericardial effusion. A, Lateral chest x-ray demonstrates two retrosternal vertical lucencies (white arrows indicate epicardial and pericardial fat stripes; black arrows indicate pericardial fluid) separated by a more radiopaque vertical stripe denoting pericardial fluid or thickening. This appearance is referred to as the “Oreo™ cookie sign.” B, Lateral and frontal view of real Oreo™ cookies. C, Sagittal computed tomography reconstruction illustrating the Oreo™ cookie sign. D, Computed tomography image with small pericardial effusion. The middle arrow describes the course of x-ray beams crossing through the more radiopaque effusion, resulting in the radio-opaque middle stripe on the lateral chest x-ray (cream in Oreo™ cookie). The arrows in front of and behind the fluid travel mainly through radiolucent fat, causing the two lucent stripes on the radiograph.
Appearance of Effusion on Computed Tomography and Magnetic Resonance Imaging
The appearance of a pericardial effusion on CT and magnetic resonance images depends on the type of fluid. When blood is in the pericardial cavity, CT will show dense material with Hounsfield units above 40. A simple pericardial effusion typically has CT numbers in the range of 10 to 20 Hounsfield units.
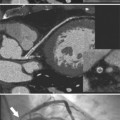
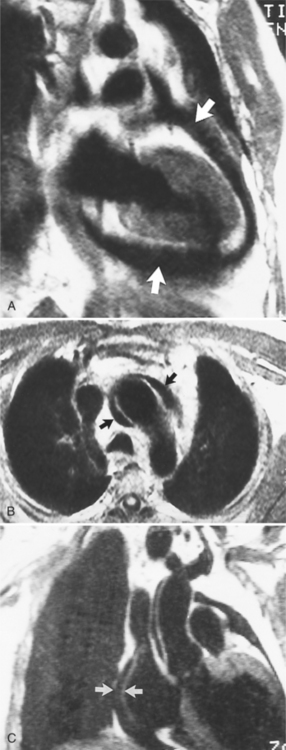
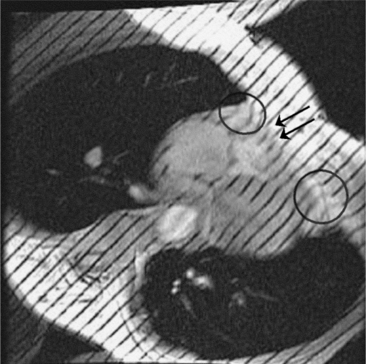
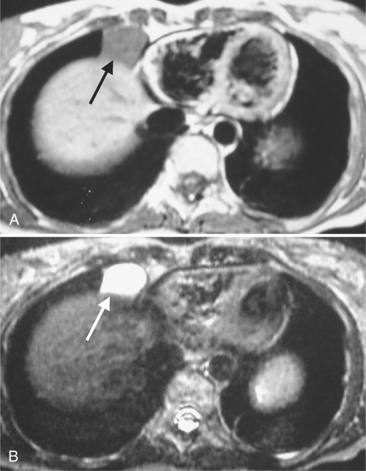
In MRI on spin echo sequences, pericardial effusions are of low signal intensity, which in part is from low protein content and from the motion of the fluid, which causes phase dispersion (Figure 9-6). Although T2-weighted images demonstrate high signal intensities for fluid in other areas of the body, they are not useful for characterizing pericardial fluid because the motion of the fluid causes signal loss. Gradient echo images depict any fluid in motion with high signal; therefore, pericardial effusion will be bright. Phase contrast images allow for quantification of flow and can be helpful in the characterization of pericardial fluid. The appearance of pericardial hematomas depends heavily on the type of hemoglobin present (e.g., oxyhemoglobin, deoxyhemoglobin, and methemoglobin).

FIGURE 9-6 Magnetic resonance imaging of pericardial effusion with spin echo pulse sequences. A, Pericardial effusion is the region with signal void (arrows) around the left ventricle, which is covered by a layer of fat. The pericardial space extends superiorly into the aortic-pulmonary window and beneath the main pulmonary artery. B, An axial view shows the pericardial fluid (arrows) layering anteriorly around the ascending aorta. The mediastinum has lipomatosis. C, The pericardial space extends laterally to the right atrium (arrows). The effusion in the space between the aorta and the superior vena cava outlines the pericardium extending into the top of the aortic arch.
Pericardial Effusion Syndromes
Infection, Collagen Disease, Metabolic Disease, and Tumors
Many infectious and metabolic diseases, tumors, radiation, drug reactions, and collagen disorders, such as systemic lupus erythematosus and scleroderma, typically cause small pericardial effusions. Uremic pericarditis occurs in about 50% of patients with chronic renal failure and is an indication for dialysis. Most effusions do not lead to cardiac tamponade. Common diseases that form pericardial effusions are listed in Box 9-1. Infectious agents that cause pericarditis with resultant effusions are usually coxsackievirus group B and echovirus type 8. Tuberculous pericarditis is uncommon except in patients with acquired immune deficiency syndrome (AIDS).
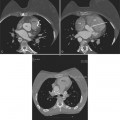
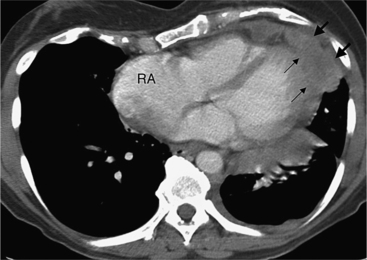
Although many bacterial, viral, or fungal agents can cause pericarditis, the most common organisms are Staphylococcus, Haemophilus influenzae, and Neisseria meningitidis (Figure 9-7). In addition to a hematogenous source, pericardial infections result from extension from a myocardial abscess related to infective endocarditis, from mediastinal abscess caused by fistula, and from carcinoma of the lung and the esophagus. A loculated pericardial fluid can represent hematoma, abscess, or lymphocele or may be secondary to fibrous adhesions from previous pericarditis. Loculated pericardial effusions can appear similar to pericardial cysts. Neoplastic pericardial effusions are usually related to systemic metastatic disease. The pericardium demonstrates nodular thickening with enhancement of the nodules. Infiltration of the epicardial or pericardial fat, myocardium, or adjacent vascular structures may be seen (Figure 9-8).

FIGURE 9-7 Pyopericardium. A, Posteroanterior chest radiograph shows markedly and irregularly enlarged cardiomediastinal silhouette. B and C, Computed tomography images through the aortic root level demonstrate a large collection of low attenuation material (asterisks in B), representing purulent loculated pericardial fluid. Note the enhancing septations (arrows). At a lower level there is a large loculated pus collection (asterisk in C) that causes mass effect with significant compression of the right atrium and ventricle.
(Courtesy Nitra Piyavisetpat, MD.)

FIGURE 9-8 Neoplastic pericardial effusions. Nongated computed tomography of a patient with breast cancer and small pericardial effusion shows several areas of nodular thickening and invasion of the epicardial and pericardial fat (arrows) indicating metastatic spread to the pericardium. Note enlarged right atrium (RA), suggesting an element of constriction.
Myocardial Infarction (Dressler Syndrome)
The most common cause of pericardial effusion is myocardial infarction with left ventricular failure. An increase in either right or left heart pressure may also cause a pericardial effusion. About 5% of patients with acute myocardial infarction develop a pericardial effusion. Dressler syndrome is the development of pericardial and pleural effusions 2 to 10 weeks after a myocardial infarction (Figure 9-9). These effusions may be hemorrhagic and can result in cardiac tamponade, particularly if the patients have been given anticoagulant medication.

FIGURE 9-9 Dressler syndrome. A, A large, pericardial effusion and bilateral pleural effusions developed 6 weeks after myocardial infarct. Note the unusual rounding of the pericardium over the left atrial appendage. B, The lateral film shows a dense anterior mediastinum, reflecting the tense upward bowing of the pericardium.
(With permission from Miller SW: Imaging pericardial disease, Radiol Clin North Am 27:1113-1125, 1989.)
Postpericardiotomy Syndrome
Patients with postpericardiotomy syndrome develop fever, pericarditis, and pleuritis more than 1 week after the pericardium has been incised. Pericardial effusions alone are quite common after cardiac surgery; therefore, the diagnosis requires pleural effusions and typical pericardial chest pain. Like Dressler syndrome, the etiology is presumably on an autoimmune basis.
Radiation Pericarditis
Radiation pericarditis is a complication of radiation therapy used for breast carcinoma, Hodgkin disease, and non-Hodgkin lymphoma. The complication occurs with the delay of at least several months after radiotherapy in patients who have received a mediastinal dose of more than 40 Gy. A secondary sign on CT that may suggest radiation-induced pericarditis is fibrosis in the portions of the lungs adjacent to the mediastinum, which may have been within the radiation port. However, an effusion from recurrent tumor can be difficult to distinguish from one caused by radiation.
Constrictive Pericarditis
Constrictive pericarditis is caused by adhesions between the visceral and parietal layers of the pericardium. It occurs after pericarditis from any etiology but is more frequently ascribed to viral or tuberculous pericarditis, uremia with pericardial effusion, and after cardiac surgery. Dense fibrous tissue covers the outer surface of the heart, obliterates the pericardial space, and causes the thickening of the pericardial contour as seen on magnetic resonance and CT. Later calcification may occur. The fibrous adhesions prevent the valve plane from moving toward the cardiac apex in systole and therefore restricts diastolic filling of the heart. Effusive-constrictive pericarditis is a disease in which hemodynamic signs of constriction remain after a pericardial effusion has been aspirated (Table 9-1).
TABLE 9-1 Radiologic criteria for constrictive pericarditis
Modality | Sign |
---|---|
Chest x-ray | Eggshell calcification of pericardium |
Computed tomography | Thickened pericardium |
Pericardial calcifications | |
Magnetic resonance | Thickened pericardial contour imaging (>4 mm) in the absence of freeflowing pericardial effusion |
Septal bounce on cine magnetic resonance images | |
Pericardial adhesions proven by tagged cine magnetic resonance imaging | |
Enhancing pericardium |
Calcifications
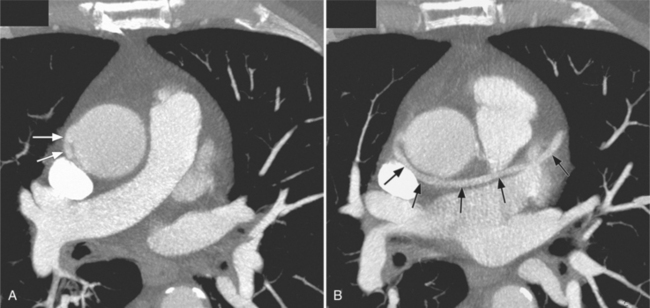
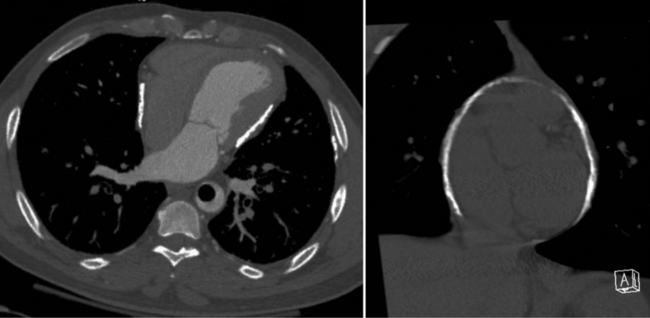
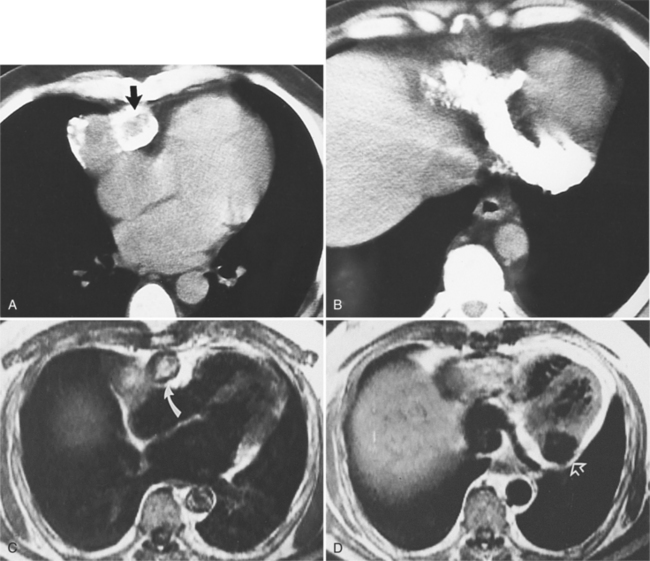
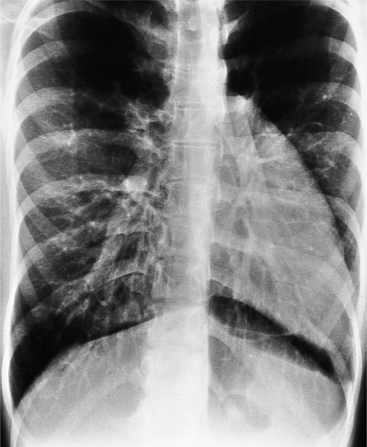
On the chest radiograph or CT, constrictive pericarditis may be suggested by the presence of pericardial calcification. The calcium may be quite thin and linear and appear as “eggshell calcification” around the margins of the heart (Figures 9-10, 9-11). Care must be taken to differentiate this pattern from the calcifications within the myocardium in old infarcts. The etiology of the pericardial calcifications in constriction is speculative, but it is seen mainly after viral and uremic pericarditis. A second type of pericardial calcification is a shaggy, thick, and amorphous deposition, which historically was rather specific for tuberculosis (Figures 9-12, 9-13). The calcium is particularly obvious in regions of the heart in which normal fat is found, namely in the atrioventricular grooves. Calcium in the atrioventricular region may indent the heart focally, producing “extrinsic” tricuspid and mitral stenoses. However, a calcified pericardium does not necessarily imply that constriction exists.

FIGURE 9-10 Constrictive pericarditis with eggshell calcification. A and B, “Eggshell calcification” outlines the heart border (arrows) over both ventricles and the right atrium.

FIGURE 9-11 Computed tomography of pericardial calcification. Left, A band of calcium extends from the right atrium via the anterior left ventricular wall to the left ventricular lateral wall near the atrioventricular groove levels. Note the deformity of the left ventricle, which is associated with constrictive physiology. Right, The noncontrast computed tomography shows nearly circumferential calcification of the pericardium.

FIGURE 9-12 Tuberculous pericarditis. A and B, Clumps of calcium developed mainly in the atrioventricular grooves in a patient with tuberculosis.

FIGURE 9-13 Tuberculous pericarditis. A and B, Computed tomography images show dense calcification in the left atrioventricular groove. A tubercular abscess (arrow) with a rim of calcium is in the right atrioventricular groove. C and D, Magnetic resonance images obtained with spin echo pulse sequences and cardiac gating show inhomogeneous signal intensities in the abscess (curved arrow) and a rim of signal void representing the calcification in the left atrioventricular groove (open arrow). The heart is covered by a 5- to 10-mm layer of fat. The calcium in the left atrioventricular groove has no signal.
(Reprinted with permission from Miller SW: Imaging pericardial disease, Radiol Clin North Am 27:1113-1125, 1989.)
Comparison with Restrictive Cardiomyopathy
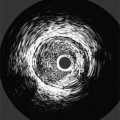
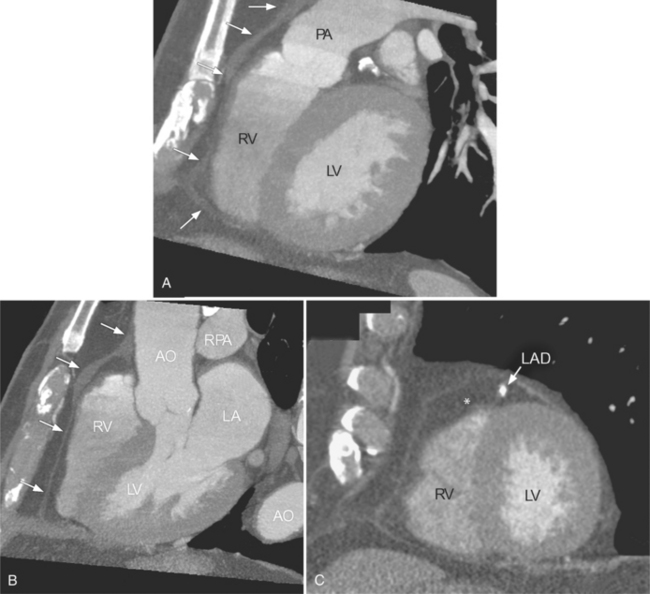
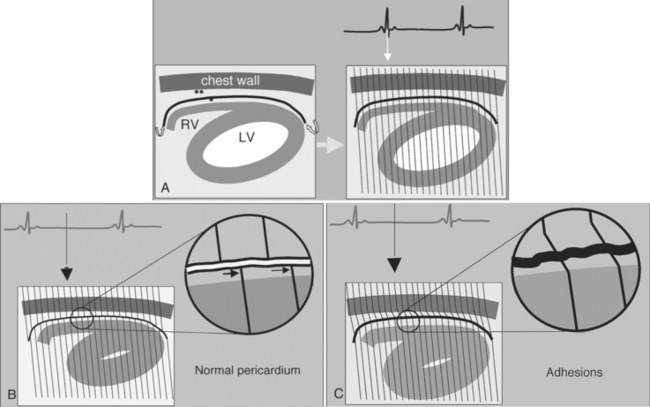
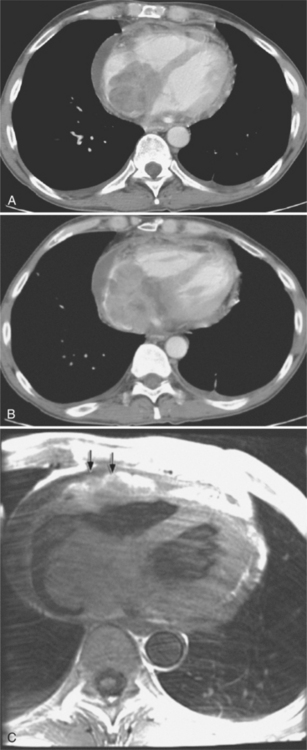
Constrictive pericarditis may be impossible to distinguish from restrictive cardiomyopathy based on hemodynamic tracings alone (see Table 9-1). Although MRI and echocardiography may show an abnormally thick pericardium, CT is the best imaging procedure to reveal calcified pericardium (see Figure 9-11). The pericardium in a restrictive cardiomyopathy does not calcify. Although the presence of pericardial calcium is strong evidence that a constrictive and not a restrictive physiology is present, the absence of calcification does not rule out constriction. Patients with constrictive pericarditis typically have a pericardial thickness greater than 4 mm (Figure 9-14). However, a thickened pericardial contour alone does not necessarily mean that constriction is present. The most reliable sign indicating constriction is the presence of pericardial adhesions. MRI can be used to determine if adhesions are present. Cine gradient echo movies with tag lines placed orthogonal to the pericardium would have to be prescribed. These black tag lines are placed early in systole and then move with the tissue during the cardiac cycle. Along normal pericardium the tag lines are expected to break because the two layers of pericardium can freely move with respect to each other. In constriction, adhesions limit the motion between the pericardial layers, and the tag lines do not break across the pericardium but have a stretched appearance (Figures 9-15, 9-16). Cine images may also show a paradoxical motion of the ventricular septum.

FIGURE 9-14 Constrictive pericarditis. Axial (A) and short-axis (B) views through the ventricles show moderate to severe thickening of the pericardial contour in a patient with pericardial constriction.

FIGURE 9-15 Pericardial adhesion. Schematic representation of axial-tagged cine images illustrating breaking of tag lines in normals and stretching of the lines without breaking in individuals with pericardial adhesion. A, The tag lines are applied at the beginning of systole. B, In end systole the tag lines are interrupted at the site of the freely movable pericardium, indicating absence of adhesions. C, In the presence of pericardial constriction, the tag lines are continuous and appear stretched along the pericardium, indicating the presence of adhesion. Curved arrows indicate the pericardium. *, epicardial fat, **, pericardial fat; LV, left ventricle; RV, right ventricle.

FIGURE 9-16 Constrictive pericarditis. Axial magnetic resonance imaging cine image with tag lines demonstrates distortion of the tag lines (circles) without interruption at the pericardial contour, indicating pericardial adhesions. In some areas, the tag lines are interrupted at the level of the pericardium (arrows), indicating normal pericardial sliding function in foci that are free from adhesions.
Because of the restriction to right ventricular filling, the right atrium, venae cavae, and hepatic veins are dilated. A pitfall in examining calcific pericarditis with MRI is that the calcified pericardium has a signal void (see Figure 9-13).
Congenital Absence of the Pericardium
Location of Defects
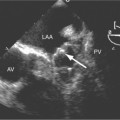
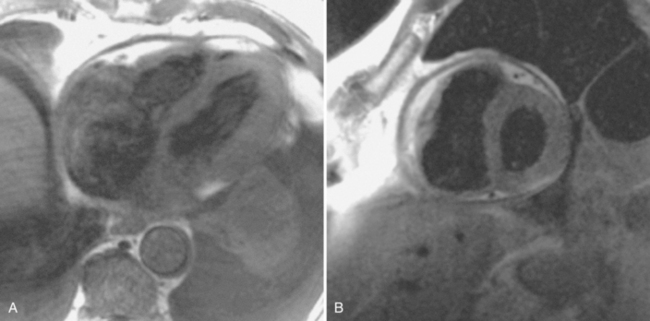
Congenital absence of the pericardium may involve all or part of the parietal pericardium. Most defects are partial and involve a defect over the left atrial appendage and adjacent pulmonary artery (Figure 9-17). Defects in the diaphragmatic part of the pericardium and partial defects over the right atrium and superior vena cava are much less common, and total absence is extremely rare (Figure 9-18). About 20% of patients with pericardial defects have associated heart and mediastinal abnormalities, including atrial septal defect, patent ductus arteriosus, tetralogy of Fallot, bronchogenic cysts, and pulmonary sequestration. Patients with partial pericardial defects are at risk for having part of the heart herniate through the defect, which could cause local strangulation of that part of the heart. In partial absence over the left side, the left atrial appendage may be strangulated.

FIGURE 9-17 Partial absence of the pericardium. The unusual shape of the left mediastinal contour about the heart does not readily conform to either the pulmonary artery segment or the left atrial appendage. The concave aortic-pulmonary window helps to exclude valvular pulmonary stenosis and right ventricular enlargement from pulmonary artery hypertension.

FIGURE 9-18 Partial absence of the pericardium. The lucency beneath the heart is interposition of lung between the heart and the diaphragm. The left border is unusually convex and the mediastinum is shifted to the left. The aortopulmonary window has an acute angle with lung in the left side of the mediastinum usually occupied by the pericardium. Shunt vasculature is also present from an atrial septal defect.
Radiologic signs
Most of these defects can be identified on the plain chest film (see Figures 9-17, 9-18). Defects on the left side of the mediastinum rotate the heart in that direction, producing levocardia. The radiologic signs of absent pericardium include:
Pericardial Masses
Focal masses in the pericardium may originate in the heart, in the pericardium, or in adjacent structures. Pericardial metastases are common (Figure 9-19). They are found in half of patients dying from breast or lung carcinoma. Primary pericardial masses are usually cysts or lipomas. Cysts in pericardial teratomas contain all three germ layers, whereas intrapericardial bronchogenic cysts contain two germ layers. Some 70% of cysts occur in the right cardiophrenic angle; the rest occur in the left cardiophrenic angle and in the anterior mediastinum (Figure 9-20).

FIGURE 9-19 Pericardial metastasis. Atrial lymphoma. A and B, Nongated computed tomography images demonstrate a lobulated, enhancing, broad-based mass arising from the interatrial septum and multiple remote pericardial masses representing pericardial metastasis. C, Axial spin echo black blood gated magnetic resonance image demonstrates a pericardial effusion and pericardial metastasis invading the epicardial fat (arrows).

FIGURE 9-20 Pericardial cyst. A, Axial T1-weighted black blood spin echo image demonstrates a well-defined low signal mass in the right cardiophrenic angle. B, T2-weighted image demonstrates homogeneously high signal within the mass and confirms the diagnosis of a cyst.
(Courtesy Curtis E. Green, MD.)
Not all pericardial masses are tumors. Bronchogenic cysts develop in the neonate and are quite rare. Herniation of abdominal contents into the pericardium can occur through a partial absence of the diaphragm. Purulent pericarditis can progress to a pericardial abscess (see Figure 9-7).

Full access? Get Clinical Tree

