CLINICAL OVERVIEW
The pericardium is a fibro-serous sac located in the mediastinum that encases the heart and the proximal portion of the great vessels and pulmonary veins. It is composed of two layers: an external fibrous layer composed of collagen and elastin fibers and a thinner internal layer formed by secretory mesothelial cells that folds creating a parietal and a visceral surface, separated by 20–40 mL of transudative fluid that is continuously produced and drains through the lymphatic system into the thoracic duct. The pericardium is a fibroelastic surface that serves as a “shock absorber” against chest trauma, regulates acute changes in load, and acts as a barrier that limits the local spread of tumors and infection. Neuroendocrine and mechanoreceptors in the pericardial surface also provide feedback to the brain, kidney, and endocrine glands that help regulate intravascular volume and pressure. The intrapericardial volume-pressure relationship follows an exponential curve, limiting cardiac distension in response to acute changes in cardiac volume. Changes in intrathoracic pressure are partially transmitted into the pericardial space, resulting in limited variability in left and right chamber volumes during the normal respiratory cycle. The normal pericardium has a thickness between 2 and 4 mm, and it is often visualized as a single layer by either ultrasound, cardiac computed tomography (CCT), or cardiac magnetic resonance (CMR) imaging, except in small recesses around the great vessels, atrial appendages, and atrioventricular groove. These and other noninvasive imaging modalities are used to define both anatomical and physiologic characteristics of the pericardium in health and disease and are useful to establish specific pathological diagnoses and guide therapeutic interventions.
DIAGNOSTIC STRATEGY AND THERAPEUTIC IMPLICATIONS
Congenital Anomalies
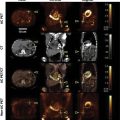
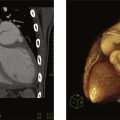
Partial or complete absence of the pericardium ( Fig. 10.1 ) is a rare condition that is often recognized as an incidental finding on a chest x-ray or evaluation of an abnormal ECG axis. Infrequently, partial absence of the pericardium may cause herniation of a cardiac chamber resulting in symptoms of atypical chest pain, dyspnea, or syncope. Ventricular dysrhythmias and sudden cardiac death rarely occur due to strangulation of the coronary vessels. Associated congenital cardiac defects include atrial and ventricular septal defects, bicuspid aortic valve, Tetralogy of Fallot, and patent ductus arteriosus. Pectus excavatum is also frequently found. Most frequently, congenital absence of the pericardium is partial, usually involving the left side of the heart, resulting in posterior and right axis deviation on the ECG. Complete absence is often associated with RV dilatation and secondary tricuspid regurgitation. Reproduced from a CMR obtained from a patient with complete congenital absence of the pericardium shows the absence of a parietal pericardial layer anterior to the RV ( arrow ) and displacement of the cardiac chambers toward the left hemithorax.

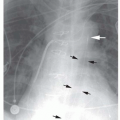
Pericardial cysts are most often congenital in origin but may also develop after infection, chest surgery, or trauma. They represent the most common primary pericardial mass. Congenital pericardial cysts appear as smooth saccular structures generally with one lobe, ranging from 1 to 5 cm in diameter and filled with a transudate ( Fig. 10.2 ,  ). They often present as incidental findings or during the evaluation of atypical chest pain or dyspnea. They are usually located in the right costophrenic angle, the left costophrenic angle, or the anterior mediastinum. A pericardial diverticulum may mimic the imaging features of a pericardial cyst; however, communication with the pericardial space is the distinguishing feature of a pericardial diverticulum.

The noninvasive imaging characteristics found in common congenital pericardial anomalies are listed in Table 10.1 .
| Partial Absence | Complete Absence | Pericardial Cyst | |
|---|---|---|---|
| Chest x-rays |
|
|
|
| Echocardiography |
|
|
|
| Computed tomography |
|
|
|
| Magnetic resonance imaging |
|
|
|
a Main pulmonary artery, LA appendage, RA appendage, etc.
c Higher attenuation suggests traumatic, infectious, or malignant etiology.
Pericardial Effusion
A small amount of pericardial fluid may be visualized in asymptomatic normal subjects. Pathological fluid accumulation may occur in inflammation, trauma, or malignancy. Large pericardial effusions may be suspected on chest x-ray films. However, most pericardial effusions are detected by echocardiography in the clinical setting. Images and videos obtained from three patients evaluated for dyspnea demonstrate the distinct echocardiographic characteristics of a pericardial effusion ( Fig. 10.2A ,  ), a pleural effusion ( Fig. 10.2B ,
  ), and ascites ( Fig. 10.2C ,
  ). Posterior pericardial effusions appear anterior to the descending aorta, whereas pleural effusions are located posteriorly. Ascites are most often seen from the subcostal acoustic window below the diaphragm. Both CT and MRI can detect even small amounts of pericardial fluid and compared to echocardiography, may more accurately quantify the amount of fluid. Large effusions may appear as a zone void of radiotracer around the cardiac silhouette in nuclear scintigraphy studies (
  ). The association between the size of pericardial effusion, symptoms, and hemodynamic effect, depends on the etiology and the rate of fluid accumulation. In acute trauma, a small amount (25–50 mL) of blood may result in a significant increase in intrapericardial pressure. Conversely, transudative pericardial effusions associated to metabolic, endocrine disorders, and hepatic failure may increase in volume gradually distending the pericardial space without causing significant hemodynamic compromise. Exudates, having high protein and cell content, have high intensity on T1 and low intensity on T2-weighted images ( Fig. 10.4 ). Hemorrhagic effusions are characterized by high signal intensity on T1-weighted images and inhomogeneous low signal intensity on cine SSFP images ( Fig. 10.5 ). On CT studies, transudative effusions have low attenuation (0–10 HU), whereas exudative effusions and blood have higher attenuation values.


The noninvasive imaging characteristics found in transudative, exudative, and malignant pericardial effusions are listed in Table 10.2 .
| Transudative | Inflammatory-Exudative | Malignancy | |
|---|---|---|---|
| Chest x-rays |
|
|
|
| Echocardiography |
|
|
|
| Computed tomography |
|
|
|
| Magnetic Resonance imaging |
|
|
|
| Nuclear scintigraphy |
|
|
|
Cardiac Tamponade
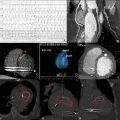
When a pericardial effusion results in a significant increase in pericardial pressure, venous return to the atrial chambers is compromised, resulting in increased central venous pressure, and decreased cardiac output. The classic features of cardiac tamponade in imaging studies reflect the hemodynamic alterations consisting of elevated central venous, reduced stroke volume, and ventricular interdependence. However, localized cardiac tamponade affecting a single cardiac chamber may present with partial or atypical features and be more difficult to diagnose. Establishing the diagnosis and guiding therapy in cardiac tamponade relies almost exclusively on Echocardiography. Two-dimensional imaging is used to identify the presence of chamber collapse ( Fig. 10.6 ,  ). With increasing levels of intrapericardial pressure, first the RA, followed by the RV, LA, and in extreme situations the LV-free walls, will invaginate during diastole. The IVC will increase in diameter and remain distended during force inspiration, indicating elevated RA pressure. Pulsed Doppler recordings will demonstrate exaggerated variability during the respiratory cycle. It is important to consider that these diagnostic features may be diminished in hypovolemia or exaggerated in respiratory failure or during mechanical ventilation.

The noninvasive imaging characteristics found in cardiac tamponade are listed in Table 10.3 .
| Cardiac Tamponade | Pericardial Constriction | Effusive-Constrictive | |
|---|---|---|---|
| Chest x-rays |
|
|
|
| Echocardiography |
|
|
|
| Computed tomography |
|
|
|
| Magnetic resonance imaging | Not indicated |
|
|
| Nuclear scintigraphy | Not indicated |
|
|
Related posts:
Stay updated, free articles. Join our Telegram channel

Full access? Get Clinical Tree


