Pulmonary Edema, the Acute Respiratory Distress Syndrome, and Radiology in the Intensive Care Unit
Pulmonary Edema, the Acute Respiratory Distress Syndrome, and Radiology in the Intensive Care Unit
W. Richard Webb
Chest radiographs are obtained daily in critically ill patients in the intensive care unit. Radiographs are used to detect significant changes in cardiopulmonary status; to search for pleural abnormalities; to evaluate the position of the numerous tubes, lines, and catheters used in monitoring and treatment; and to detect complications arising from the use of monitoring and support devices.
Radiographs obtained routinely or following placement of a tube or catheter show significant abnormalities not suspected clinically in 35% to 65% of patients in the ICU, and these findings often result in an intervention or change in treatment. The American College of Radiology (www.acr.org) recommends daily portable radiographs in patients requiring mechanical ventilation and in those with acute cardiac or pulmonary disease. Radiographs are also recommended following placement of support and monitoring devices such as endotracheal tubes, tracheostomy tubes, central venous catheters, nasogastric tubes, chest tubes, pacemakers, and intraaortic balloon pump.
RADIOGRAPHIC TECHNIQUE
Adequate radiographs are difficult to obtain in the ICU. Portable chest radiographs usually are done using relatively low kilovoltage, long exposure times, no grids, and short source (tube)-to-detector (film or digital medium) distance. These result in high-contrast films, often with portions of the mediastinum or pulmonary parenchyma poorly seen (note: digital techniques help solve this problem), motion-related blur, and increased scatter radiation. The American College of Radiology has recommended technical standards for the performance of bedside portable radiographs (Table 11-1).
Even if the technique is optimized, it often is not possible to obtain optimal radiographs because of the patient’s inability to cooperate. Patients in the ICU often are too ill to be positioned perfectly for radiographic examinations. Portable radiographs are performed in the anteroposterior (AP) projection, usually supine or semierect rather than upright. Position must be taken into account in interpreting radiographs for the presence of cardiomegaly, pulmonary vascular congestion, and pleural effusion. Furthermore, variation in patient position from day to day also must be considered.
PULMONARY DISEASE IN THE CRITICALLY ILL PATIENT
Common pulmonary complications that occur in critically ill patients include pulmonary edema (hydrostatic; increased capillary permeability), acute lung injury (ALI) and the acute respiratory distress syndrome (ARDS), atelectasis, pneumonia, aspiration, pulmonary embolism, and pulmonary hemorrhage. To some extent, the radiographic distribution of pulmonary disease, the time course of radiographic abnormalities, and associated radiographic findings may help in reaching a useful differential diagnosis. However, the radiographic findings in a patient in the ICU with acute pulmonary disease may be nonspecific, and knowledge of the clinical history or physical findings often is essential in suggesting the appropriate diagnosis.
TABLE 11.1 American College of Radiology Technical Standards for Bedside Portable Radiographs
72-in. source to image distance and upright position when possible (although this is uncommonly possible in ICU patients), or
40-in. or more source to image distance for supine or semierect radiographs in uncooperative patients
kVp of 70-100 should be used in radiographs obtained without a grid
kVp of more than 100 may be used for radiographs obtained with a grid
Exposure times as short as possible
Technical parameters such as mAs, kVp, distance, and patient position should be recorded (to allow consistency in performance)
The radiographic beam should be collimated to limit radiation exposure
PULMONARY EDEMA AND THE ACUTE RESPIRATORY DISTRESS SYNDROME
Pulmonary edema often is classified as either hydrostatic (cardiogenic) or due to increased capillary permeability (noncardiogenic). It should be recognized, however, that it is not always possible—or entirely appropriate—to make a simple distinction between hydrostatic edema and permeability edema. A classification as (1) hydrostatic edema, (2) increased permeability edema associated with diffuse alveolar damage (DAD), (3) increased permeability edema without associated DAD, and (4) mixed edema agrees better with pathology, physiology, and radiology. Although these types of edema cannot always be distinguished on the basis of plain film or CT findings, their appearances do tend to differ.
HYDROSTATIC PULMONARY EDEMA
Hydrostatic pulmonary edema results from alterations in the normal relation between intra- and extravascular hydrostatic and oncotic pressures. In most cases, an increased intravascular pressure due to pulmonary venous hypertension is the predominant cause, resulting in loss of fluid into the interstitium. This may result from left heart failure, left atrial or pulmonary venous obstruction, volume overload in renal failure, or overhydration. Low intravascular oncotic pressure resulting from hypoalbuminemia, liver failure, or renal failure also can result in an increased interstitial transudation of fluid.
Radiographic abnormalities associated with hydrostatic or cardiogenic pulmonary edema may be difficult to evaluate on portable radiographs. Heart size is difficult to determine accurately on portable AP radiographs, particularly when lung volume is reduced. Pulmonary vascular congestion also may be difficult to identify with certainty because of patient position. Upper lobe vessels appear larger than normal when patients are supine or semierect. Similarly, dilatation of the azygos vein, useful as a sign of increased right atrial pressure, occurs normally in the supine position. The apparent width of the mediastinum (vascular pedicle) is increased by supine position, AP projection, and decreased inspiratory level. Associated pleural effusion is common, but may be difficult to see on supine radiographs.
In patients with hydrostatic pulmonary edema, plain radiographs and high-resolution CT (HRCT) may show findings of interstitial or air-space edema or both.
Interstitial Edema
Interstitial edema is manifested on chest radiographs by (1) Kerley’s A or B lines, (2) thickening of the fissures, (3) “peribronchial cuffing,” and (4) poor definition of pulmonary vessels or “perihilar haze.” On CT, these findings correspond to the presence of (1) smooth interlobular septal thickening, (2) subpleural edema, (3) thickening of the peripbronchovascular interstitium, and (4) ground-glass opacity.
Kerley’s Lines (Thickening of Interlobular Septa)
Kerley’s B lines visible on chest radiographs result from thickening of interlobular septa (Fig. 11-1; see also Fig. 10-1 in Chapter 10). They are horizontal, 1 to 2 cm in length, touch the pleural surface, and are best seen laterally in the costophrenic angles. Their characteristic appearance results from the regular organization of pulmonary lobules at the lung bases.
Kerley’s A lines (see Fig. 11-1; see also Fig. 10-2 in Chapter 10) are less commonly seen. They are oblique, several centimeters in length, and are seen within the central or perihilar lung. They also represent thickened septa, but their appearance is different from that of B lines because of the different organization of lobules in this location.
In patients with Kerley’s lines visible on radiographs, HRCT shows smooth interlobular septal thickening (Fig. 11-2; see also Fig. 10-15 in Chapter 10).
Thickening of the Fissures (Subpleural Edema)
The subpleural interstitial space is contiguous with peripheral interlobular septa. If interlobular septal thickening and Kerley’s lines are present, subpleural interstitial thickening is often visible as well. It is recognized as thickening of the fissures on both chest radiographs and CT (see Figs. 11-1B and 11-2). This finding also may be due to pleural effusion thickening the fissure.
Peribronchial Cuffing (Thickening of the Peribronchovascular Interstitium)
Thickening of the peribronchovascular interstitium often occurs in patients with interstitial edema, resulting in apparent bronchial wall thickening on chest radiographs, or peribronchial cuffing (see Fig. 11-2). Peribronchial cuffing is easiest to recognize in the perihilar regions where bronchi are seen end-on; sometimes lines radiating outward from the hila reflect the thickened peribronchial interstitium. On CT, thickening of the peribronchovascular interstitium resembles bronchial wall thickening; pulmonary arteries adjacent to the bronchi appear increased in diameter because the thickened interstitium surrounds them as well.
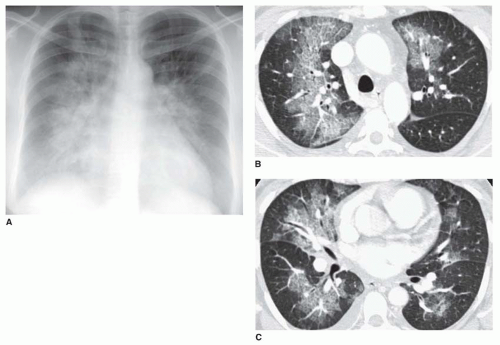
FIG. 11.1. Acute hydrostatic pulmonary edema with Kerley’s lines in a patient with aortic stenosis and fluid overload. A: Baseline chest radiograph is normal. B: One hour later, after rapid infusion of fluid, Kerley’s A and B lines are visible, with a perihilar predominance. Thickening of the right minor fissure also is visible (arrow) as a result of subpleural edema. The patient was acutely short of breath. C: Detail view of the left lower lobe shows interlobular septal thickening.
Poor Definition of Perihilar Vessels and Perihilar Haze (Ground-glass Opacity)
On chest radiographs, edema fluid surrounding pulmonary vessels blurs their margins, making them difficult to see or poorly defined on chest radiographs. This finding is easiest to recognize when comparison films are available. Poor definition of lower lobe vessels usually is the first abnormality noted in pulmonary edema and may be seen when Kerley’s lines are unrecognizable.
Poor definition of hilar or perihilar vessels is a common finding in patients with mild pulmonary edema (Fig. 11-3). On radiographs, this finding, sometimes referred to as perihilar haze, is often useful in diagnosing pulmonary edema in bedridden patients with lower lobe atelectasis or pneumonia in whom the lower lobe vessels cannot be assessed. This appearance may progress to a frank “batwing” pattern of pulmonary edema.
An overall increase in lung water or interstitial thickening often is recognizable as a poorly defined, generalized increase in lung density, or ground-glass opacity. It may be difficult to recognize on chest radiographs in the absence of comparison films, but is easily seen on HRCT (Fig. 11-4). In patients with perihilar haze visible on chest radiographs, ground-glass opacity often is seen on HRCT.
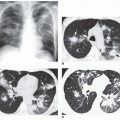
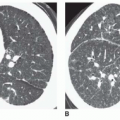
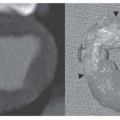
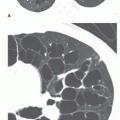
FIG. 11.2. Interlobular septal thickening on HRCT in acute hydrostatic pulmonary edema in two different patients. A: There is extensive thickening of interlobular septa. Subpleural edema results in thickening of the fissures (large arrow). Apparent parahilar bronchial wall thickening (“peribronchial cuffing”) results from edema fluid thickening the peribronchovascular interstitium (small arrows). Bilateral pleural effusions also are present. B: Interlobular septal thickening and thickening of the left major fissure are visible. Peribronchial cuffing (arrows) is well seen in this case. Patchy areas of increased lung attenuation represent ground-glass opacity, which may be seen with or without septal thickening in patients with interstitial edema.
FIG. 11.3. Poor definition of perihilar and lower lobe vessels (“perihilar haze”) in two patients with hydrostatic edema. A: Chest radiograph in a patient with congestive heart failure and cardiomegaly shows poor definition of perihilar and lower lobe vessels as the first sign of pulmonary edema. B: In another patient with cardiomegaly and pulmonary edema, hazy opacity obscures perihilar and lower lobe vessels.
On HRCT, ground-glass opacity due to edema may be perihilar and perivascular (see Fig. 11-4B), peripheral and subpleural (see Fig. 10-31A in Chapter 10), patchy (Fig. 11-5) and lobular, or centrilobular in distribution. It may be seen in isolation or in combination with septal thickening (see Fig. 11-2B).
FIG. 11.4. Hydrostatic edema with ground-glass opacity. A: Chest radiograph in a patient with edema shows poor definition of perihilar vessels and a subtle increase in lung density. B: HRCT shows patchy perihilar ground-glass opacity. Thickening of the fissures and small pleural effusions are present, but septal thickening is absent in this patient.
FIG. 11.5. Hydrostatic pulmonary edema with a perihilar or “batwing” appearance of consolidation. A: Chest radiograph shows perihilar consolidation with air bronchograms. B and C: HRCT at two levels show ground-glass opacity in a perihilar distribution.
Air-space Edema
With an increase in interstitial pressure and a worsening of edema, fluid overflows the interstitium and fills the alveoli. Findings of air-space edema are the same as those of air-space consolidation. They include ill-defined or confluent opacities with obscuration of underlying vessels and “acinar” or air-space nodules. Air bronchograms may be seen in some patients, but are not always visible. HRCT may show frank consolidation or dense ground-glass opacity in patients with the appearance of consolidation on plain radiographs. Homogeneous dense consolidation is unusual on HRCT in patients with edema unless atelectasis is associated.
Air-space edema may be patchy, multifocal, or diffuse, but usually it is bilateral and symmetric. In upright patients, a basal distribution often is visible. A perihilar “batwing” or “butterfly” distribution occurs occasionally, often related to rapid accumulation of edema fluid (Fig. 11-5). This pattern also has been attributed to better clearance of edema fluid in the lung periphery because of a richer lymphatic network in this region, but why it is seen in some patients and not in others is unclear.
Unilateral or Asymmetric Edema
Hydrostatic edema usually is bilateral and symmetric. In patients with edema, variations in the distribution of the edema fluid may result from variations in blood flow or hydrostatic pressure (or other mechanisms). Unilateral or asymmetric edema may result (Table 11-2).
The most common cause of unilateral edema is the decubitus position (Fig. 11-6). Right upper lobe edema may be seen in patients with papillary muscle rupture and mitral regurgitation; this is caused by a jet or regurgitant blood directed into the right superior pulmonary vein (Fig. 11-7).
TABLE 11.2 Unilateral Pulmonary Edema
Unilateral edema associated with ipsilateral abnormalities
Decubitus position
Reexpansion edema
Pulmonary vein occlusion
Congenital or acquired systemic to pulmonary artery shunt (e.g., Blalock-Taussig)
Papillary muscle rupture and mitral regurgitation with a jet effect
Unilateral edema associated with contralateral abnormalities
Hypoplastic pulmonary artery or interruption of the pulmonary artery
Swyer-James syndrome
Unilateral emphysema or bullae
Transient atelectasis
FIG. 11.6. Unilateral left-sided pulmonary edema. Postoperative radiograph in a patient who had a right nephrectomy in the left lateral decubitus position. Note free air under the right hemidiaphragm secondary to surgery.
Patients with decreased blood flow to one lung (e.g., pulmonary artery occlusion) tend to develop edema on the opposite side. This also may be seen in patient with unilateral lung abnormalities resulting in decreased blood flow, such as pulmonary embolism or Swyer-James syndrome (Fig. 11-8).
Course and Clearing of Hydrostatic Edema
Hydrostatic edema may appear rapidly in association with acute heart failure or fluid overload (see Fig. 11-1). Often the radiograph becomes abnormal at the same time that symptoms appear. However, it is important to recognize that hydrostatic edema may be visible on chest radiographs before the symptoms develop (clinical lag) or after pulmonary venous pressure has returned to normal (radiographic lag).
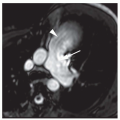
FIG. 11.7. Right upper lobe edema due to acute myocardial infarction with papillary musclce rupture, prolapse of the posterior leaflet of the mitral valve, and acute mitral regurgitation. Note cardiomegaly.
FIG. 11.8. Left-sided Swyer-James syndrome with predominant right-sided pulmonary edema. A: Baseline chest radiograph shows a hyperlucent and hypovascular left upper lobe. This appearance is typical of Swyer-James syndrome. B: Subsequently, congestive heart failure with cardiomegaly is associated with pulmonary edema. The edema spares the left upper lobe.
Because hydrostatic edema is relatively low in protein, it may show rapid clearing with improvement in patient status. Similarly, a gravitational shift in the distribution of edema fluid may occur within minutes to hours of a change in patient position. Air-space edema reacts more slowly than interstitial edema to changes in patient status.
Although a progression of edema from an interstitial to an air-space pattern may be seen with worsening, this is not always the case. Many patients show air-space edema as the initial finding. Similarly, in patients with air-space edema, the edema does not typically assume an interstitial appearance as it clears.
INCREASED PERMEABILITY EDEMA WITH DIFFUSE ALVEOLAR DAMAGE: ACUTE LUNG INJURY AND THE ACUTE RESPIRATORY DISTRESS SYNDROME
Permeability edema is a manifestation of capillary endothelial injury with resultant loss of fluid and protein into the lung interstitium. It results in a high-protein edema and, therefore, is slow to clear. It often is associated with respiratory epithelial injury, and diffuse alveolar damage (DAD). This combination often results in the clinical entities known as acute lung injury (ALI) and the acute respiratoy distress syndrome (ARDS).
ALI and ARDS are characterized by progressive dyspnea and hypoxemia over a period of hours to days. Their definitions differ only in the degree of hypoxemia. Specific criteria for the diagnosis of ALI and ARDS include the following:
Acute onset of respiratory failure
Diffuse bilateral infiltrates on chest radiographs
Absence of left atrial hypertension (pulmonary artery occlusive pressure* [PAOP] ≤ 18 mm Hg) or no clinical evidence of left atrial hypertension
Hypoxemia is defined as
PaO2/FIO2 300 mm Hg or less (ALI)
PaO2/FIO2 200 mm Hg or less (ARDS)
where FIO2 is the fraction of inspired O2
ALI and ARDS can be related to a variety of pathologic processes, including the following:
Infection (e.g., pneumonia and sepsis)
Inhalation or aspiration of toxic or irritating substances
Trauma with lung or extrathoracic injury
Hemodynamic abnormalities (e.g., shock, high altitude, anaphylaxis)
An idiopathic form of ALI or ARDS is termed acute interstitial pneumonia (AIP). AIP is discussed in Chapter 13.
Most simply, the mechanism of lung injury in ALI and ARDS may be considered to be direct, in which the lungs themselves are injured (e.g., pneumonia, aspiration, and inhalational injury) or indirect, in which extrapulmonary abnormalities (e.g., sepsis, shock, pancreatitis) lead to lung injury (Table 11-3).
TABLE 11.3 Direct and Indirect Causes of ALI and ARDS
Usual interstitial pneumonia with acute exacerbation
Indirect injury
Sepsis (particularly gram negative organisms)
Shock
Toxic shock syndrome
Disseminated intravascular coagulation
Extrathoracic trauma
Burns
Neurogenic edema
Drugs
Anaphylaxis
Transfusion reactions
Leukoagglutinin reactions
Diabetic ketoacidosis
Pancreatitis
Uremia
High altitude
TABLE 11.4 The Stages of ALI and ARDS
Time Frame
Stage
Pathologic Findings
Radiologic Findings
Hours
Days
Early exudative (injury)
Late exudative (injury)
Endothelial edema, early edema
Progressive endothelial injury, necrosis of alveolar lining cells, progressive alveolar edema and hemorrhage
Normal
Patchy consolidation, often peripheral, progressive confluence, dependent atelectasis
Weeks
Proliferative (reparative)
Proliferation of alveolar lining cells, organization of alveolar exudates, fibroblast proliferation in alveolar walls
Slow resolution of consolidation, development of reticular opacities
Months
Fibrosis
Depending on the degree of injury, resolution or fibrosis
Persistence of reticular opacities and honeycombing, often anterior
The Stages of ALI and the Acute Respiratory Distress Syndrome
ALI and ARDS are considered to occur in stages, within the time frame of hours, days, weeks, and months (Table 11-4), which have close pathologic and radiographic correlates.
Pathologic Abnormalities
Pathologic abnormalities in ARDS are similar regardless of its cause. The histologic abnormalities occurring in ARDS are usually referred to as DAD.
Hours. Within hours of the precipitating insult, endothelial cell edema, widening of intracellular junctions, congestion of capillaries, and limited interstitial pulmonary edema and hemorrhage are present. These manifestations represent the early exudative (injury) stage of ALI and ARDS.
Days. The period from a day to a week after the initial insult is characterized by progressive capillary endothelial injury, necrosis of alveolar lining cells (type I pneumocytes), proteinaceous interstitial and alveolar edema, and hemorrhage. Hyaline membranes form within the alveoli. This represents the late exudative (injury) stage.
Weeks. The proliferative (reparative) stage usually occurs from 1 week to 1 month following the onset of ARDS. It is characterized by proliferation of type II pneumocytes, which reline the denuded alveolar walls, organization of the alveolar exudates, fibroblast proliferation within the alveolar walls and interstitium, and deposition of collagen.
Only gold members can continue reading. Log In or Register to continue
Oct 10, 2016 | Posted by drzezo in CARDIOVASCULAR IMAGING | Comments Off on Pulmonary Edema, the Acute Respiratory Distress Syndrome, and Radiology in the Intensive Care Unit