The goals of imaging in valvular heart disease are as follows:
Identification of stenosis or insufficiency of one or more valves.
Estimation of the pressure gradient (or valve orifice area) and severity of regurgitation (regurgitant fraction).
Quantification of ventricular volumes, mass, and function.
Sequential monitoring of ventricular volumes, mass, and function. Determination of response to therapy.
Exclusion of significant coronary artery disease, especially prior to surgery.
Echocardiography is the most commonly used technique for the evaluation of valvular disease. For the most part, it has replaced cardiac catheterization for definitive diagnoses and assessment of severity of valvular dysfunction. The echocardiographic aspects of valvular heart disease are the topic of a number of chapters in other textbooks. The current role of angiography is the exclusion of significant coronary artery disease before surgery or as a contributing factor for heart failure in these patients. In the future, noninvasive imaging of coronary arteries by multidetector CT may suffice for these purposes.
All valvular lesions exert a stress on the supporting ventricle. Valvular stenosis exerts a pressure overload, which involves the compensatory mechanism of myocardial hypertrophy. Regurgitation exerts a volume overload, which involves chamber dilatation. Eventually, these compensatory mechanisms are dissipated, and in the end stage of valvular heart disease, myocardial failure and low cardiac output state ensue.
AORTIC STENOSIS
Aortic stenosis usually is described at three anatomic levels: supravalvular, valvular, and subvalvular. The classification of the types of aortic stenoses is presented in
Table 32-1.
Supravalvular stenosis nearly always is a congenital anomaly, either as an isolated lesion or as part of the Williams’ syndrome. The supravalvular narrowing has roughly three configurations: focal constriction at the sinotubular junction (hourglass configuration) with post-stenotic dilation of the mid and distal ascending aorta, focal membrane at the sinotubular junction, and tubular narrowing from the sinotubular junction to just below the origin of the innominate artery. The Williams’ syndrome is characterized by hypercalcemia, elfin facies, variable mental retardation and characteristic personality (“cocktail party personality”), hypertension, and additional peripheral arterial stenoses.
Concomitant cardiovascular lesions variably associated with supravalvular aortic stenosis include (1) aortic and pulmonary valvular stenoses, (2) peripheral pulmonary arterial stenoses, (3) diffuse hypoplasia of the aorta, (4) discrete stenoses of branches of the aortic arch and abdominal aorta, and (5) stenoses at origin of the coronary arteries. However, the coronary arteries usually are ectatic because they originate below the obstruction at the sinotubular junction and are thereby subjected to elevated pressure.
Rarely, supravalvular stenosis is acquired. This can be a sequelae of aortitis. Another possible cause is exaggerated scarring at the site of aortotomy performed for aortic valve replacement.
Valvular aortic stenosis may have either a congenital or acquired etiology. The congenital cause most often is a bicuspid aortic valve. A less common cause is a unicuspid valve; this type of valve causes more severe stenosis, usually presenting in the first year of life. A rare pathology is the primitive valve, usually consisting of a hypoplastic annulus containing a ring of gelatinous tissue. This lesion also presents most often during infancy. Rheumatic valvular aortic stenosis commonly occurs in association with mitral stenosis or regurgitation. Degenerative aortic stenosis is now the most frequent cause of calcific aortic stenosis in the adult. Although degenerative aortic stenosis once was considered to be a result of premature fibrosis and calcification of a bicuspid aortic valve, it is now recognized as degeneration of tricuspid aortic valves in elderly patients. The bicuspid aortic valve degenerates into hemodynamically significant aortic stenosis in the fourth and fifth decade; the tricuspid aortic valve degenerates into hemodynamically significant stenosis usually after the sixth decade. With the aging of the population, this type of aortic stenosis is becoming the most commonly encountered type. All types of acquired aortic stenosis are characterized by heavy calcification (calcific aortic stenosis).
Subvalvular aortic stenosis: Congenital subvalvular stenosis is caused most commonly by a thin membrane situated within 1 cm beneath the aortic cusps. Other
types consist of a discrete fibromuscular ring or tunnellike narrowing of the left ventricular (LV) outlet region. Redundant gelatinous tissue attached to the anterior mitral valve leaflet also may rarely cause subvalvular stenoses, either alone or as part of an endocardial cushion anomaly. Muscular subaortic stenosis is caused by the asymmetric form of hypertrophic cardiomyopathy. It is due to the combination of asymmetric hypertrophy of the upper septum and systolic anterior motion of the anterior leaflet of the mitral valve.
Radiography
The findings on chest x-ray in
valvular aortic stenosis depend on the severity and level of the obstruction and the age at presentation (see
Table 30-6 in
Chapter 30). The x-ray image in infants presenting with symptoms of heart failure is characterized by pulmonary edema and cardiomegaly. Cardiomegaly without pulmonary edema also may occur. On the other hand, x-rays in older children and adults may display only enlargement of the ascending aorta. In the presence of severe LV hypertrophy (reduced ventricular compliance) or with the onset of myocardial failure, pulmonary venous hypertension or edema may become evident. This usually occurs late in the natural history of uncomplicated valvular aortic stenosis. The extent and density of aortic valvular calcification roughly parallel the severity of the stenosis in adults before the seventh decade. On the other hand, ascending aortic dilation does not correlate with severity of stenosis and may be substantial with a nonobstructive bicuspid valve.
Supravalvular aortic stenosis may cause a narrow base of the heart with inconspicuous ascending aortic region (right superior mediastinum; see
Chapter 31). With
subvalvular aortic stenosis, enlargement of the ascending aorta often is not evident on the chest x-ray. Ascending aortic enlargement is discernible in about 50% of patients with the membranous type of subvalvular stenosis.
Magnetic Resonance Imaging
Magnetic resonance imaging (MRI) can be used to identify valvular dysfunction and to assess the effect of the lesion on ventricular volumes, mass, and function (
Table 32-2). In addition to identifying stenosis and regurgitation, the gradient across stenotic valves and volume of valvular regurgitation can be quantified. Sequential MRI studies can be used for monitoring the severity of the valvular lesion and ventricular function over time and in response to therapy.
Identification of Aortic Stenosis
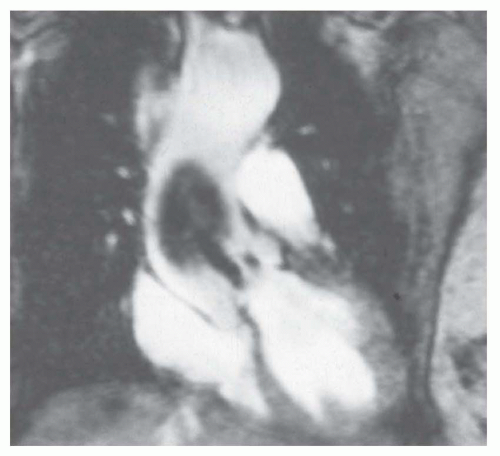
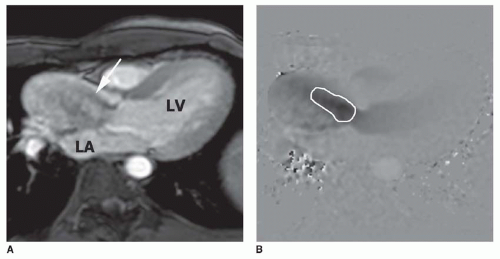
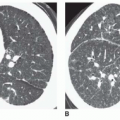
Aortic stenosis is identified using cine MR images. Cine MR imaging consists of multiple gradient echo (GRE) or balanced steady-state free precession (b-SSFP) images in which the blood under normal flow conditions has bright (white) signal intensity. High-velocity jet flow, such as occurs with the flow across a valvular stenosis or the retrograde flow across a regurgitant orifice, produces a signal void (low-signal region within the bright signal of the blood pool) on GRE cine. Identification of valvular stenosis on GRE images is based on the typical appearance of the downstream chamber or great artery. The signal void of a dysfunctional valve appears as an area of diminished or absent signal persisting for most of systole or diastole. Aortic stenosis is detected readily on images in coronal, axial, and vertical long-axis planes, which display an area of signal loss distal to the valve during ventricular systole (
Fig. 32-1).
Recognition of the signal void on cine MR images is critically dependent on the TE value employed. The signal void diminishes in area with decreasing TE value. Indeed, the signal void may not be discernible with TE values of less than 6 ms. For depiction of the signal void, a TE value of 12 or greater is generally used.
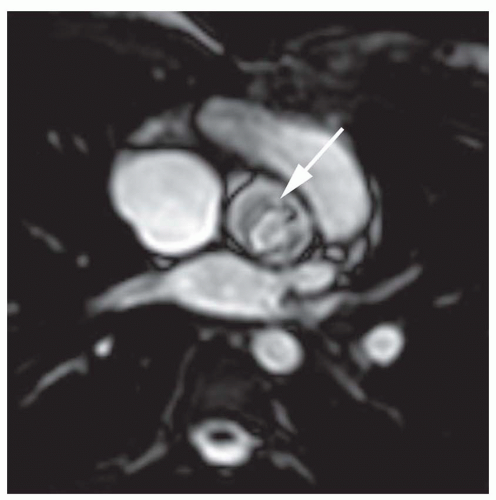
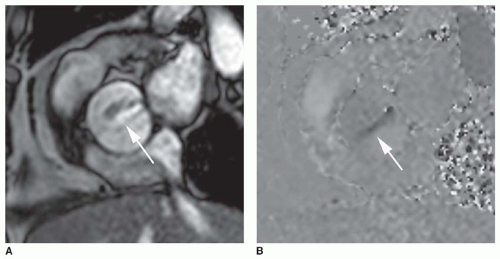
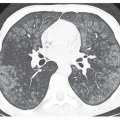
In recent years, the SSFP cine sequence has replaced GRE cine. With the former sequence, the high-velocity signal void is minimized and more complex. At moderately increased
velocities, the flow jet has increased signal (
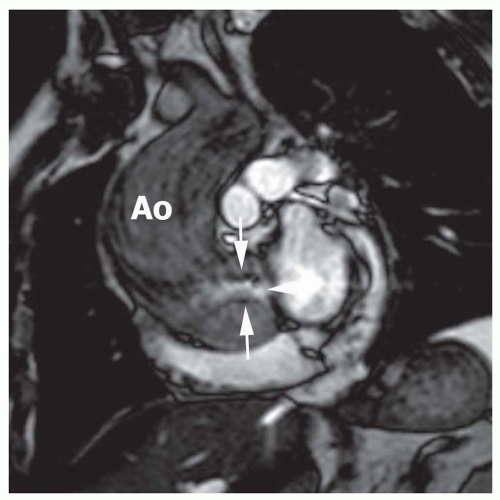
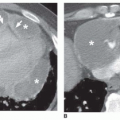
Fig. 32-2), but at very high velocities, the center of the jet shows high signal while the periphery may show a signal void (
Fig. 32-3).
Estimation of the Valve Gradient
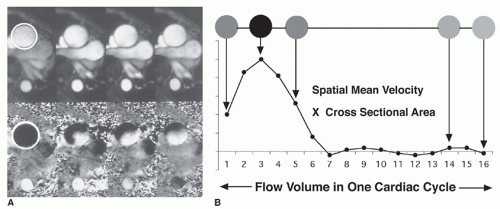
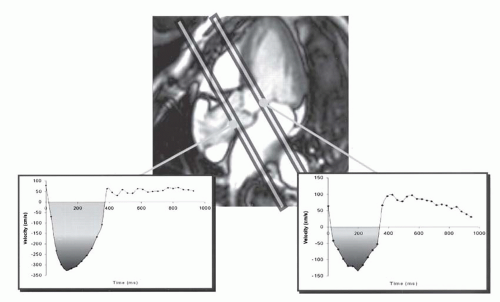
The valve gradient is estimated using velocity-encoded cine (VEC; phase contrast) MRI. VEC MRI measures the phase shifts that accumulate as hydrogen nuclei move through a magnetic field gradient. The net phase shifts of protons within various voxels are displayed in gray levels, in proportion to the degree of phase shift. Because phase shift is basically proportional to motion over time, VEC MRI can be used to measure flow velocity. Reconstruction of VEC data provides a magnitude image (anatomic information) and a phase image (velocity information in selected direction;
Fig. 32-4A). The velocity-encoding direction can be selected in any orientation or in all three dimensions. The crosssectional area of the vessel can be measured by drawing a region of interest on the magnitude (amplitude) image. The same region of interest is then applied on the corresponding phase image, where spatial mean velocity is measured. The product of area and spatial mean velocity provides the instantaneous flow volume for a specific time frame of the cardiac cycle. Integration of all instantaneous flow volumes throughout the cardiac cycle (usually 16 or higher) gives volume flow per heartbeat (see
Fig. 32-4B). This technique has been validated in vitro with flow phantoms and in vivo by comparing flow measurements in the pulmonary artery and the aorta with left and right stroke volumes measured by cine MRI in healthy volunteers.
The signal void on cine GRE caused by turbulence allows identification of stenosis or regurgitation. The currently employed SSFP cine sequence mitigates the signal
void of high-velocity flow. The high-velocity jet of aortic stenosis may cause a central hyperintense jet with low signal or signal void at the edges of the jet (
Fig. 32-3). The central hyperintensity corresponds to the vena contracta. Peak systolic jet velocities over 5.0 m/s have been measured with this technique in patients with aortic stenosis. These values determined by phase-shift GRE have correlated with Doppler flow and catheter measurements. The peak velocity is determined by identifying the voxel with highest velocity on the phase contrast image in peak systole (
Fig. 32-5). Using
the measurement of peak velocity by VEC MR imaging, the pressure gradient can be estimated by the modified Bernoulli equation as Δ
P = 4
V2, where Δ
P = pressure drop across the stenosis (mm Hg) and
V = peak velocity (m/s). An example of the use of VEC to estimate the gradient across valvular aortic stenosis as derived from VEC measurement of a peak velocity of 4 m/s looks like this:
ΔP = 4V2
ΔP = 4(4)2
ΔP = 64 mm Hg
However, it should be noted that this measurement by VEC has limitations. The number of images reconstructed for a cardiac cycle may lack temporal resolution for capturing the exact instant when peak velocity occurs. The direction of flow encoding may differ from the flow direction of the jet. These limitations can be minimized by using three-dimensional flow encoding, but this further reduces temporal resolution.
Calculation of the Aortic Valve Orifice Area
The estimated gradient is dependent on the stroke volume, ejection time, and aortic pressure. It provides an incomplete assessment of severity of aortic stenosis. Indeed, depression of LV myocardial contractile state may cause the gradient to decline when heart failure ensues in end stage decom pensated aortic stenosis. Consequently, it is important to determine the aortic valve area. Severe AS is defined as an aortic valve area less than 1.0 cm
2 (less than 0.60 cm
2/m
2). Perpendicular cine views through the aortic valve can show the number of valve leaflets, excursion of leaflets, and the aortic valve orifice. These images can be used to measure the aortic valve area. For this measurement, the area of flow through-plane at the level of the origin of the flow jet is used (
Fig. 32-6). As an alternative, application of the continuity equation on VEC MRI profiles in the LV outflow tract (LVOT) (velocity measured below the valve) and aorta (Ao) (just above the valve in the aorta) can also be used (
Fig. 32-7). The velocity time integral (VTI) is measured for systolic forward flow in both planes (planes perpendicular to LVOT and Ao,
Fig. 32-7). The aortic valve area
A (centimeters squared) is given by
AAO =
ALVOT (VTI
LVOT/VTI
AO) where
ALVOT = LVOT area in cm
2, VT
ILVOT is LVOT VTI, and VTI
Ao is A
O VTI.
Quantification of LV Volumes, Mass, and Function
Ventricular mass and function can be measured precisely from a three-dimensional set of cine MR images that can be acquired in any plane. In contrast to echocardiography and cineangiocardiography, MR imaging does not rely on geometric assumptions or calculations based on partial sampling of the cardiac volume. Typically, a set of contiguous tomograms encompassing the entire heart from the apex to the bifurcation of the pulmonary artery is acquired. Cine MR images typically are acquired at 16 phases of the cardiac cycle. These images can be laced together and displayed in a cinematic format. When viewed in the cinematic format, it is possible to assess global right ventricular (RV) and LV function and to assess wall thickening and motion to define regional myocardial function. In recent years, hybrid echo planar and b-SSFP sequences have been
developed that provide more images (frames) per cardiac cycle and substantially reduce image acquisition time. The optimal technique for maximizing contrast between blood and myocardium is the use of b-SSFP sequences—true fast imaging with steady precession, balanced fast-field echo, and FIESTA (
Figs. 32-8 and
32-9). This sequence has replaced the cine GRE.
Ventricular cavity volumes are simply calculated as the sum of the cavity area times the slice thickness (
Fig. 32-9). Interobserver variabilities for LV end-diastolic volume and LV end-systolic volume have been shown to be less than 5% and 10%, respectively. Mass measurements are highly accurate, with excellent interstudy and interobserver variabilities for LV mass of less than 5%. Because interstudy variabilities of ventricular volumetric and mass measurements by cine MR imaging are small, this technique is ideal for monitoring the effectiveness of therapy in patients with aortic stenosis.