Pericardial Diseases
Charles B. Higgins
Karen Ordovas
Pericardial disease may be primary and involve the pericardium alone. It is also frequently a manifestation of a wide variety of systemic diseases or secondary to cardiovascular disease.
There are several imaging techniques that are effective for the diagnosis of pericardial diseases. The imaging modality initially and most frequently utilized is transthoracic echocardiography. Asymptomatic abnormalities of the pericardium are occasionally identified on computed tomography (CT) of the thorax.
The imaging modality of choice for initial evaluation of patients with suspected pericardial effusion is transthoracic echocardiography. This widely available and relatively low-cost method has a high accuracy for detection of pericardial effusion and signs of tamponade. It is also a good method for guiding diagnostic or therapeutic pericardiocenteses. The main limitation of echocardiography in pericardial diseases is its inability to assess the entire pericardial extension. It is also not very accurate for depiction of pericardial thickening, because echogenicity of the pericardium is similar to adjacent tissues.
Major indications for further investigation with CT or magnetic resonance imaging (MRI) are the visualization of loculated pericardial effusion; evaluation of complicated pericardial effusion (hemorrhagic vs. nonhemorrhagic); measurement of pericardial thickness; assessment of enhancement of the pericardium and characterization of pericardial masses.
CT and MRI provide excellent delineation of the mediastinal anatomy, with high soft-tissue contrast and spatial resolution. The visualization of the entire chest can also give important information for differential diagnosis and extent of pericardial diseases. Both methods provide some information on tissue characterization, which is useful for the diagnosis of pericardial masses and pericardial inflammation.
CT is the best method for depiction of pericardial calcification, a finding suggestive of constrictive pericarditis in the appropriate clinical setting. CT-guided pericardiocenteses is a well-established technique for management of loculated pericardial effusions. Electrocardiogram-gated CT can eliminate the artifacts related to cardiac motion and is superior to nongated studies for the evaluation for pericardial abnormalities.
MRI has the advantage of avoiding iodinated contrast media and ionizing radiation as well as providing imaging in multiple planes. The major indication for MRI is the measurement of pericardial thickness, which is useful for diagnosis of constrictive pericarditis in patients with constrictive/restrictive physiology. Cine MRI can usually differentiate a small pericardial effusion from pericardial thickening, which can be misinterpreted by CT.
TECHNIQUES
Multidetector CT imaging with cardiac gating is ideally used to assess pericardial anatomy and cardiac function with adequate temporal and high spatial resolution. However nongated multidetector CT is usually adequate for diagnosis of pericardial disease.
Electrocardiogram-gated MRI studies with morphologic and functional sequences allow a complete evaluation of the pericardium with high soft-tissue contrast and spatial resolution. Images of the entire heart can be acquired with a few breath holds or during free-breathing. New techniques with a phased-arrayed coil can image the heart with a high temporal resolution.
Turbo spin-echo (SE) T1-weighted images are usually acquired at least in the axial and coronal planes for morphologic assessment of the pericardium. SE or inversion recovery gradient-echo (GRE) images after administration of gadolinium chelates may be used to detect enhancement caused by inflammatory processes of the pericardium. Cine MR images using GRE or steady-state free precession sequences are acquired to evaluate ventricular function, ventricular sliding motion over the pericardium, and diastolic ventricular septal motion.
NORMAL PERICARDIUM AND PERICARDIAL RECESSES
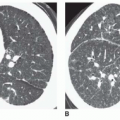
The pericardium is a compliant sac that envelops the heart and the origin of the great vessels. It is attached to the sternum anteriorly and to the diaphragm inferiorly. The left atrium is only partially covered by the pericardium. Parietal pericardium consists of fibrous tissue with an inner layer of mesothelial cells that reflect in the regions of pericardial attachment and cover the surface of the heart, forming the visceral pericardium. On MRI and CT studies, the normal pericardium is usually less than 2 mm thick (Figs. 34-1 and 34-2). A thickness greater than 4 mm is considered abnormal. CT can overestimate pericardial
thickness in the presence of isodense effusion. Visualization of the pericardium on both CT and MRI is possible because of its position between two fat planes (epicardial and pericardial). Although the pericardium is visible over the right cardiac chambers in most studies, it may not be visible over the lateral and posterior walls of the left ventricle.
thickness in the presence of isodense effusion. Visualization of the pericardium on both CT and MRI is possible because of its position between two fat planes (epicardial and pericardial). Although the pericardium is visible over the right cardiac chambers in most studies, it may not be visible over the lateral and posterior walls of the left ventricle.
 FIG. 34.1. Normal pericardium on CT. Cardiac gated axial images before (left) and after (right) iodinated contrast media show normal appearance of a thin pericardium, best seen adjacent to the right ventricular free wall (arrows). |
The pericardial cavity normally contains up to 50 mL of serous fluid that distributes diffusely around the heart surface and inside the pericardial recesses. The complex configuration of the pericardial cavity can be understood as two connected complex spaces surrounding the heart and great vessels. The first region surrounds the proximal two thirds of the ascending aorta and pulmonary artery out to its bifurcation, and is known as transverse sinus (Fig. 34-3). The second region surrounds the attachment of the inferior vena cava, superior vena cava, and pulmonary veins, delineating a cul-de-sac behind the left atrium called oblique sinus (Fig. 34-4). The pericardial cavity has several recesses that can be recognized on CT and MR images: These are the superior and inferior aortic recesses, left and right pulmonic recesses, posterior pericardial recess, left and right pulmonary vein recesses, and postcaval recess (Fig. 34-5).
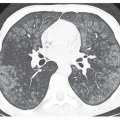
 FIG. 34.2. Normal pericardium. Computed tomography (CT) (A) and axial spin-echo (SE) images (B) show the normal appearance of the pericardium (arrows). |
Knowledge of the cross-sectional anatomy of the pericardial recesses is essential for its differentiation from lymph nodes or abnormalities of adjacent mediastinal structures. In the setting of malignancy, a misinterpretation of a normal recess as lymphadenopathy could lead to inappropriate staging of tumors. Occasionally, one of the recesses can be much more prominent than the others, increasing the chances of misinterpretation (Fig. 34-6).
Normal pericardial fluid resides in the recesses of normal individuals. Fluid is invariably observed in one or more recesses on CT and MR in the absence of a pericardial effusion. One or more recesses may be particularly prominent in some normal subjects.
The pericardium is composed of fibrous tissue and appears dark on T1- and T2-weighted SE images (Fig. 34-2). In the area of the right ventricle, it is located between the bright mediastinal and subepicardial fat, which provides a natural high level of contrast, so that the sensitivity for the visualization of the pericardium in this region is 100%. In regions adjacent to the lung, the natural contrast is lower, so that the sensitivity for visualization in the area of the lateral wall of the left ventricle is lower. The thickness of the pericardium on MR images ranges from 1 to 3 mm. Anatomic studies have shown the thickness of the pericardium to be in the range of 0.4 to 1 mm. The overestimation on MRI has been presumed to result from motion-induced signal loss of the normal pericardial fluid, which cannot be readily distinguished from the pericardium itself. Pericardial thickness depends also on the anatomic level and increases toward the diaphragm. This effect results from the ligamentous insertion of the pericardium into the diaphragm and from its tangential direction to the imaging plane. Consequently, the measurement of pericardial thickness is most reliable at the midventricular level.
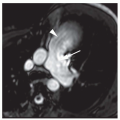
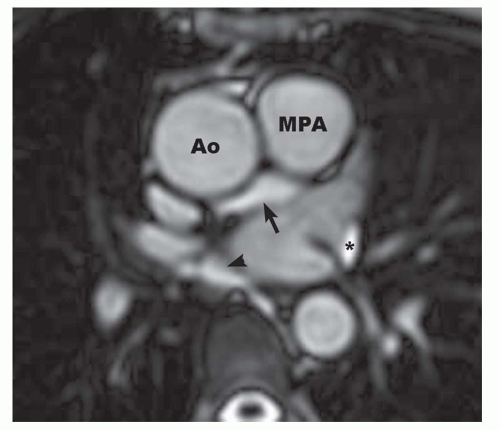 FIG. 34.3. Transverse sinus of the pericardium. Axial cine magnetic resonance (MR) image at the level of the main pulmonary artery (MPA) and ascending aorta (Ao) shows the transverse sinus of the pericardium (arrow). Note that the pericardial fluid inside the sinus has the same signal intensity of the flowing blood. Also shown are the oblique sinus (arrowhead) and left pulmonic vein recess (asterisk). |
 FIG. 34.4. Oblique sinus of the pericardium. Contrast-enhanced CT image at the level of the right pulmonary artery (RPA) shows fluid inside the oblique sinus of the pericardium (arrow). Note that a fat plane separates this pericardial sinus from the anterior esophageal wall. |
 FIG. 34.5. Pericardial recesses. Axial cine MR (A) and axial SE (B) images at the level of the pulmonary artery bifurcation show the anterior (black arrow) and posterior (arrowhead) portions of the superior aortic recess and the left pulmonic recess (white arrow). Axial SE image (C) and contrast-enhanced CT (D) at the level of the left pulmonary artery also show the anterior (arrow) and posterior (arrowhead) portions of the superior aortic recess. |
 FIG. 34.6. Prominent superior aortic recess. Contrast-enhanced CT at the level of the carina shows more than usual volume of pericardial fluid inside the posterior portion of the superior aortic recess (arrow). |
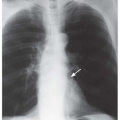
 FIG. 34.7. Pericardial effusion on CT. CT image (A) demonstrates homogeneous small pericardial effusion with water density (asterisk). Contrast-enhanced CT (B) shows a large pericardial effusion (asterisk). |
TABLE 34.1 Etiologies of Pericardial Effusions | |
|---|---|
|
PERICARDIAL EFFUSION
The pericardial space normally contains 10 to 50 mL of fluid. In most normal subjects, pericardial fluid can be identified in the pericardial recesses on CT and MRI. The numerous etiologies of pericardial effusion are listed in Table 34-1. For many pericardial effusions, the etiology is never established. The effusion is recognized as an incidental finding on echocardiography, CT, or MRI. The procedure of choice for evaluation of the presence and size of pericardial effusion is transthoracic echocardiography. Collections of fluid within the pericardial cavity can represent transudate or exudates. The latter include serous, fibrinous, purulent, and hemorrhagic or (rarely) chylous pericardial effusion.
Simple pericardial effusion (transudate) has a density close to water on CT (Fig. 34-7). The typical appearance on MRI is low signal on T1-weighted SE and high signal intensity on T2-weighted SE, cine-GRE, and steady state free precession sequences (Fig. 34-8).
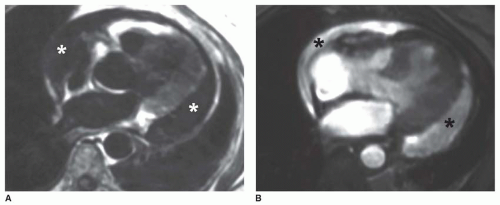 FIG. 34.8. Pericardial effusion on magnetic resonance imaging (MRI). Axial T1-weighted SE image (A) shows the low signal intensity of a pericardial effusion (asterisk). High signal intensity of the effusion (asterisk) is observed on axial cine MR image (B). |
Differentiation of transudate from exudates is usually not possible based on imaging appearance alone. However, increased fluid density and heterogeneity on CT suggest exudates, on MRI, intermediate signal on T1-weighted spin echo images suggest exudates (Fig. 34-9).
The appearance of pericardial hematoma depends on the age of the pericardial blood. Acute hemopericardium has a high density on CT, whereas subacute hematomas present with a heterogeneous density (Fig. 34-10). MRI of acute pericardial hematoma shows a high signal intensity on SE T1-weighted sequences and a low signal intensity on cine-GRE images. Subacute and chronic hematomas are usually heterogeneous with both high-and lowsignal intensity regions on T1-weighted images (Fig. 34-11). Distinguishing features of pericardial hematoma compared to nonhemorrhagic effusion are summarized in Table 34-2.
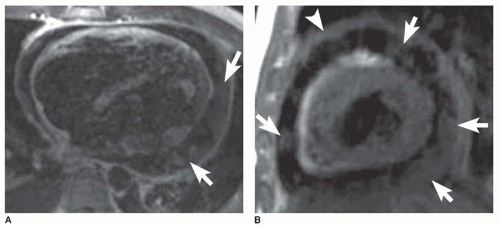 FIG. 34.9. Pericardial exudate. SE MR images in the axial (A) and sagittal (B) planes show a heterogeneous pericardial effusion with areas of intermediate signal in the fluid (arrows). A thickened pericardium is also visible (arrowhead), consistent with an inflammatory process. |
Chylous effusion is extremely rare. It has been described as a low-density pericardial collection on CT.
Small amounts of pericardial fluid can be misinterpreted on CT imaging because of similar appearance to pericardial thickening. MRI can distinguish between the high intensity of a small simple effusion and the adjacent low signal of normal parietal pericardium. However, small volume of fluid and pericardium may be indistinguishable on spin echo MR and thereby simulate pericardial thickening. Pericardial effusion shows no increase in signal on T1-weighted images after administration of gadolinium chelate. This feature aids in distinguishing between pericardial fluid and pericardial or myocardial tumor on T1-weighted SE images. CT and MRI are very sensitive for the detection of generalized or loculated pericardial effusions. CT and MRI can detect pericardial effusion as small as 30 mL. Both provide information on the location of pericardial effusion and are especially effective for demonstrating loculated effusions (Fig. 34-11A). Because of uneven distribution, the total fluid volume cannot be calculated from the width of the pericardial space by applying a simple formula. However, a semiquantitative estimation can be obtained by measuring the width of the pericardial space in front of the right ventricle. A moderate effusion is associated with a width of more than 5 mm. Loculated effusion occurs when fluid is trapped by adhesions between the parietal and visceral pericardium. MRI is more sensitive than echocardiography in detecting loculated effusion because of its wide field of view.
Related posts:
Stay updated, free articles. Join our Telegram channel

Full access? Get Clinical Tree


