Key Points
- ▪
CCT is a superb test for assessing the structural aspects of pericardial diseases, including thickening, calcification, effusion, cysts, absence, masses, and malignancy.
- ▪
CCT is a poor test for identifying the functional aspects of pericardial diseases.
- ▪
CCT is best able to image the normal pericardium over the right ventricular free wall, where it is most likely to be offset by under- and overlying fat layers.
- ▪
Pericardial thickening can be seen by CCT, but this is not synonymous with constriction, because
- ▪
Thickened pericardium may not constrict the heart.
- ▪
About 20% of cases of constriction do not appear to have thickened pericardium.
- ▪
Older definitions of pericardial thickening by CCT (and MRI) were not realistic and were actually misleading. Normal pericardial thickness is 1 mm. Current CCT imaging is able to depict pericardium nearly as it exists.
- ▪
Pericardial diseases are numerous and diverse, and imaging has a central role in their evaluation. Currently, echocardiography is the principal test for pericardial disease assessment, because two-dimensional imaging and Doppler assessment are highly feasible by echocardiography, the test is portable, and it can be used to guide drainage procedures. However, several forms of pericardial disease—notably pericarditis and constrictive pericarditis, as well as cysts and congenital absence of the pericardium—remain elusive to delineation by echocardiography. With regard to pericardial diseases in general, the drawbacks of echocardiography include limited field of view and poor tissue plane recognition.
Pericardial diseases are usually investigated with combined physiologic and anatomic approaches. Cardiac catheterization offers only assessment of physiology (as well as depiction of calcium), whereas echocardiography and cardiac MR (CMR) offer assessment of physiology and anatomy, and CT offers depiction of anatomy and very limited surrogate markers for physiology. The choice of which test or combination of tests to use is determined by the disorder and its findings.
Normal Pericardium
The normal pericardium consists of:
- □
A thin (<1 mm) fibrous layer (the parietal pericardium) that limits displacement of the heart within the chest, provides a barrier to disease (infection, inflammation and malignancy), and also limits distention of the heart chambers
- □
15 to 50 mL of pericardial fluid that serves as a lubricant
- □
An extremely thin layer (cell monolayer—the “visceral pericardium”) on the epicardial surface of the heart itself and on the inside of the parietal pericardial layer
There is potentially a space between the layers of the pericardium that may accumulate fluid if forces that favor fluid formation exceed those that favor removal.
The anatomic extent of the pericardium is complex: the pericardium and its space extend up along all of the vessels that connect to the heart:
- □
Up the ascending aorta to the innominate artery
- □
Up the pulmonary artery to or past the bifurcation
- □
Up the superior vena cava a few centimeters
- □
Down the inferior vena cava (IVC) a few centimeters
- □
Back along the pulmonary veins for a few centimeters
Thus, pericardial fluid can accumulate in numerous recesses well away from the heart chambers. Lack of knowledge of pericardial anatomy can lead to confusion regarding the cause of this fluid when it is present.
In addition, the covering of the heart proper by the pericardium is complex: a small part of the posterior aspect of the left atrium is extra pericardial (i.e., not within the pericardial space).
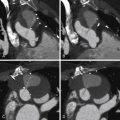
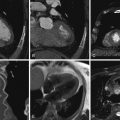
True normal pericardial thickness is less than 1 mm. The medical literature previously stated that “normal” pericardial thickness by MRI and by CT is less than 4 mm, in contradistinction to what is seen in the operating room every day: normal pericardium has the thickness of paper. The older CT literature struggled with imaging that inevitably included translational artifact due to inadequate temporal resolution; therefore, the motion of the pericardium during acquisition rendered its image thicker than it truly was. Current cardiac CT (CCT) has much better spatial and temporal resolution and is capable of depicting the pericardium at close to its true thickness. By current ECG-gated CCT, normal pericardial thickness is about 1 mm.
Over some surfaces of the heart, usually the right heart, the parietal pericardium is sandwiched between layers of underlying epicardial fat and overlying pericardial fat, and when it is, the parietal pericardium can be distinguished from the myocardium and adjacent lung by its higher attenuation coefficient. In the absence of either the over- or the underlying fat layer, the thickness of the parietal pericardium cannot be established. In the absence of both underlying epicardial and overlying pericardial fat, the parietal pericardium cannot be identified as present or absent.
Pericardium over the left ventricular (LV) free wall may not be evident on CT, because there is little fat to make the pericardium stand out. Potential thickening is therefore usually assessed over the right ventricular (RV) free wall.
For CCT images of normal pericardium, see Figures 15-1 and 15-2 .


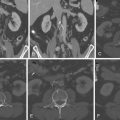
Pericardial Calcification
CCT is the preeminent test for detecting cardiac calcification, including pericardial calcification. Pericardial calcification is not synonymous with pericardial constriction. For CCT images of pericardial calcification, see Figures 15-3 through 15-7 .


Pericardial Thickening
CCT is the best test for detecting pericardial thickening. It is important to recall that pericardial thickening is not present in 20% of constriction cases and that it may be present in the absence of constrictive physiology. Pericardial calcification is not synonymous with pericardial constriction. For CCT images of pericardial calcification, see Figure 15-8 .

Pericarditis
Pericarditis is defined as inflammation of either or both of the pericardial layers. It usually occurs with little or no increase in the amount of pericardial fluid and only mild pericardial thickening; hence, imaging modalities have little to contribute directly toward the diagnosis of the average case of pericarditis. MRI is superior to CCT in distinguishing pericardial fluid from pericardial thickening. However, due to its increased spatial resolution, CCT may, in fact, be superior in identifying subtle pericardial nodularity. Subtle “stranding” of the epicardial fat also may be seen as a marker of peri- or epicardial inflammatory change and is better appreciated on CCT than on CMR.
For CCT images of pericarditis, see Figure 15-9 and

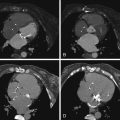
Pericardial Effusions
Echocardiography, CCT, and MRI are all capable of depicting pericardial effusions, and, importantly, of distinguishing them from pleural effusions, which have no risk of tamponade. Echocardiography and MRI are superior to CCT in distinguishing pericardial fluid from pericardial thickening. CCT also is less able to characterize pericardial fluid by appearance than are echocardiography and MRI. Fine specular echoes seen on either transthoracic or transesophageal echocardiography are strongly suggestive of blood, and wobbly, fine specular echoes are suggestive of blood clot. Low T1-weighted signal intensity on MRI is consistent with transudative effusions, and medium or high T1-weighted signal intensity on MRI is consistent with exudative and hemorrhagic effusions. Simple pericardial fluid, as in simple pleural effusions, has a uniform, low attenuation value, usually less than 20 HU. Pericardial effusions with attenuation values greater than 20 HU should be considered complicated until proven otherwise. Use of a threshold as low as 10 HU is not clinically accurate. Hemorrhagic pericardial effusions often demonstrate heterogeneous mixed attenuation, with regions measuring more than 50 HU. Often a complicated pericardial effusion provides the corollary of the “split pleura” sign where a complex pericardial effusion demonstrates enhancement of the parietal and visceral pleura.
For CCT images of pericardial effusions, see Figure 15-10 .

Related posts:
 Overview of the Process, Exclusions and Risks, and Preparation
 CTA Assessment of Saphenous Vein Grafts and Internal Thoracic (Mammary) Arteries
 Determination of Coronary Calcium
 Assessment of Left Ventricular Structural Abnormalities
 Cardiac and Paracardiac Masses
 Caval Anatomy: Variants and Lesions
Stay updated, free articles. Join our Telegram channel

Full access? Get Clinical Tree


