PET-CT and SPECT-CT Body Scans: Artifacts, Normal Variants, Pitfalls, and Findings of Uncertain Pathologic Relevance
Gustav K. von Schulthess
Identifying pathology on images requires knowledge of the normal. In nuclear molecular imaging, issues regarding normal scans can be broadly divided into two categories: technical issues related to the performance of a single imaging system or a combination of systems and physiological and pathophysiological issues related to a specific radiopharmaceutical. By their nature, technical issues can be treated in more general terms, whereas issues related to radiopharmaceuticals are largely radiopharmaceutical specific.
Technical issues in positron emission tomography (PET) and single-photon emission computed tomography (SPECT) are mainly related to attenuation correction and to reconstruction of low photon flux images. Computed tomography (CT) artifacts relevant on a daily basis are mainly due to beam hardening. Both types of imaging systems are influenced by the presence of metallic implants in the body. The introduction of PET-CT and SPECT-CT generates additional technical problems because of the interplay of these two technologies, particularly the use of CT data for attenuation correction. The problems arising are due, for example, to the fact that x-ray contrast agents do not function as such at PET photon energies, which can lead to erroneous corrections. A combination of technical and physiological problems are relevant here as well, because although CT acquires data much faster than the breathing cycle, PET and SPECT average over many breathing cycles. The resulting artifacts in integrated scans have to be recognized and are described in this chapter.
Fluorodeoxyglucose (FDG) is still the primary and most important radiopharmaceutical in PET body imaging (see Fig. 33.2). FDG accumulates in the brain and is excreted through the kidneys and urinary collecting system. FDG uptake into heart and skeletal muscles is variable and related to the fasting state and the exercise level, respectively. Extended bowel uptake is variable and cannot be reduced significantly by drug interventions. There is menstrual cycle–dependent FDG uptake into the female genital organs and breast tissue and usually little uptake into the hemopoietic and lymphatic systems, except thymic uptake in children. Patients, particularly after tumor therapy, may show increased FDG uptake into the axial skeleton and into brown fat, which is located mostly in the posterior neck and shoulder region, the costovertebral joints of the cervicothoracic spine, and around the large organs of the upper abdomen. These normal accumulations are responsible for imaging pitfalls and have to be recognized. Additional pitfalls are related to inflammatory tissue, which also takes up
FDG, uptake in exercised muscle, and urine, which can all mimic tumor foci in oncologic patients. There are many findings on FDG-PET scans that have no clinical significance for scan interpretation, and they are described here as well. An example is FDG joint uptake, which increases with age and is probably related to the increasing prevalence of osteoarthritis in the aging population. CT in PET-CT and SPECT-CT greatly help in avoiding pitfalls.
FDG, uptake in exercised muscle, and urine, which can all mimic tumor foci in oncologic patients. There are many findings on FDG-PET scans that have no clinical significance for scan interpretation, and they are described here as well. An example is FDG joint uptake, which increases with age and is probably related to the increasing prevalence of osteoarthritis in the aging population. CT in PET-CT and SPECT-CT greatly help in avoiding pitfalls.
Other PET compounds are starting to be used, and a great variety of SPECT compounds are used in daily clinical practice. For the PET compounds, still little information is available on pitfalls, and the discussion here is brief. The SPECT compounds in daily clinical use are well known, but a detailed discussion of their distribution is beyond the scope of this book. Thus, the reader is referred to other relevant publications.
Introduction
When interpreting any images of a medical imaging modality, distinguishing the normal from the abnormal is the first step to master (1,2). Like any other imaging modality, positron emission tomography (PET) and single-photon emission computed tomography (SPECT) have their own artifacts, pitfalls, and lesions of physiological or irrelevant pathological significance (PIPS). This problem is compounded in PET-CT (computed tomography) and SPECT-CT, because the use of CT data for attenuation correction of PET or SPECT data can generate additional findings that require knowledge for proper image interpretation. It is therefore not surprising, that newcomers to the field of PET and SPECT imaging often have difficulty classifying lesions as relevant or irrelevant with respect to the diagnostic questions asked by the clinicians. As a result, newcomers to PET tend to generate a substantial number of false-positive findings. However, the data show that the number of findings that can be classified unequivocally as normal, pitfall, or PIPS lesion has much increased with the use of fluorodeoxyglucose (FDG) PET-CT (3).
Writing on artifacts, pitfalls, and PIPS lesions in PET and SPECT is doubly challenging, because in a sense every radiopharmaceutical generates its own problems. In order to deal with the wealth of diverging information, we need to restrict our focus. Here, only examinations that cover extended fields of view (FOVs) of the body are considered; corresponding remarks on brain- and heart-focused studies are presented in Chapters 21 and 28. Although some of the problems of image interpretation are reiterated in the ensuing chapters, here we focus on problems of image interpretation generated by common radiopharmaceuticals. Some examinations use radiopharmaceuticals that can be used only as PET tracers or only as SPECT tracers, such as 18F-FDG (used in PET), whereas other examinations are performed with radiopharmaceuticals that are available as both PET and as SPECT tracers. In PET and PET-CT, FDG and [18F]choline belong to the first group. We will briefly consider other PET agents as well, notably F-ethyl tyrosine. Compounds used as PET and SPECT tracers are bone-seeking agents and the octreotide imaging agents. In SPECT and SPECT-CT, applications are just emerging. The emphasis will be on iodine, iodine analogs, which are lung and sentinel node agents, along with a few words on SPECT inflammation markers and iodine 123 (123I) and 131I-MIBG. The normal scan appearance for these SPECT examinations will be discussed in later chapters where appropriate.
In this chapter, artifacts are considered to be related to the imaging technologies per se, whereas pitfall and PIPS lesions are related to the interaction of radiopharmaceuticals with physiologic or pathophysiologic processes. Artifacts, being due to imaging technology issues, are common to all types of examinations. Different radiopharmaceuticals have little or no influence on these artifacts, and thus more general statements can be made on artifacts than on pitfalls and PIPS lesions, which are typically radiopharmaceutical specific.
Artifacts
Artifacts due to system malfunction are partially treated in Chapters 3, 4, and 6. In line with the clinical nature of this chapter, artifacts are discussed here in a clinical context. First artifacts are discussed, which are specific to a modality or appear both in emission and transmission computed tomography. Then artifacts resulting from the integration of PET or SPECT with CT are presented.
PET and SPECT: Photon Attenuation by Body Tissue Artifacts
PET and SPECT are both emission techniques, and the artifacts discussed here are specific to emission techniques. In an emission scan, the photons traveling to the detectors are attenuated more strongly when they are located more centrally in a transaxial section of a patient than when they are located more superficially. The attenuation decreases exponentially with the distance traveled in the tissues (see Chapter 3). Due to differences in the detection technologies, these attenuation artifacts differ somewhat in PET and
SPECT. The result, however, is basically the same: if the images are not corrected for body attenuation, central foci with the same activity appear to be less active than superficial foci, and the foci are distorted (4). This has to be taken into consideration when scans not corrected for attenuation are clinically interpreted.
SPECT. The result, however, is basically the same: if the images are not corrected for body attenuation, central foci with the same activity appear to be less active than superficial foci, and the foci are distorted (4). This has to be taken into consideration when scans not corrected for attenuation are clinically interpreted.
To eliminate attenuation effects, the PET and SPECT emission images have to be corrected using an attenuation map. This map is obtained either by gamma radiation–emitting sources in PET or SPECT systems rotated around the patient as a second part of the examination. In PET-CT and SPECT-CT systems, the map is obtained by the CT scanner. With the advent of PET-CT, the acquisition of transmission scans to correct for differences in attenuation has become much less time consuming; thus PET images from a PET-CT scanner are nowadays rarely viewed without attenuation correction. The only exception is when body regions containing metallic implants are evaluated (see “Attenuation Artifacts due to Beam Hardening” later). If a PET-only scanner is used for partial- or whole-body scanning, issues of patient throughput may prevent performances of one from carrying out a transmission scan, as it takes about 30% of the entire imaging time. Although not optimal, it may still be appropriate to view non-attenuation-corrected scans. In SPECT, attenuation correction was introduced successfully into myocardial perfusion scanning a few years ago, but the standard in SPECT imaging for other purposes is still to use uncorrected scans. This may change soon, as various manufacturers are now starting to offer SPECT-CT systems, in which acquisition of a attenuation scan is much faster than with conventional SPECT systems.
In SPECT, collimation is done with lead collimators. In this detection process, activity on the surface of the patient is seen more prominently, because there is less body tissue between the radiation source and the detector system to attenuate the emitted gamma rays (Fig. 33.1A). Furthermore, the spatial resolution decreases with increasing distance from the detector; therefore, the radiation detected by an opposing detector in a dual-detector gamma camera will not contribute much to the image. As a result, for the same activity, superficial lesions appear to be of higher activity and less blurred than deep foci. In PET, the situation is somewhat different. Each gamma ray is subject to the same attenuation as in SPECT, but the coincidence detection mechanism detects two gamma rays, both of which are attenuated differently because the path of the two gamma rays through the body differs (Fig. 33.1A). If the sum distance of the length in the body through which both opposing gamma rays travel is equal, for two decay events located in different body regions, as in the example shown, the net attenuation is the same independent of the location of the radiating focus along the line connecting the two coincidence-detecting detectors, and thus the attenuation is independent of the location of the activity focus. The difference in attenuation of gamma rays from peripheral versus deep foci in PET is due to the fact that more rays are attenuated slightly or not at all for a peripheral focus than for a deep focus (Fig. 33.1B). Unlike SPECT, PET has a better central than peripheral spatial resolution (see Chapter 3). Artifacts due to lack of attenuation are seen in Figure 33.1C.
These types of artifacts are not relevant for CT, as attenuation is in fact the physical principle by which CT images (or x-ray images in general) have contrast in them.
PET and SPECT: Low Photon Flux Artifacts
PET and SPECT data typically are based on low photon flux, and the images are noisy. When such images are reconstructed with projection reconstruction algorithms, streaks cross the axial section FOV, particularly when there are great differences in contrast in the image. They are noted only when the lower threshold of image display is set very low. Modern PET and SPECT scans are mostly reconstructed using iterative algorithms, which do not lead to these artifacts (see Chapter 3).
PET and SPECT: Partial-Volume Artifacts
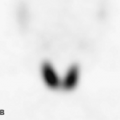
As discussed in Chapter 3, each real imaging system is not able to depict a point source as a point, but the signal is spread to give rise to the so-called point spread function. There are two situations that are useful to distinguish. In the first situation, the focus is as large as or larger than a single voxel. Particularly when the activity or signal in a focus is much higher than that of the surroundings, some of the activity “spills over.” In the images, activity thus is also seen in neighboring voxels, and the lesion appears larger than it actually is. This effect is frequently noted in PET scans with the ureters, which are typically thin and less than 5 mm in diameter but can contain very high activity (Fig. 33.2E–G). In SPECT, this effect is frequently seen in thyroid SPECT scans of remnant thyroid tissue, where again the activity noted on the SPECT scan extends beyond the morphological confines of the activity focus.
The second situation occurs when the lesion is smaller than the voxel or when the voxel is located at the edge of a lesion. Partial-volume effects occur in all tomographic examinations but have different linear scales, as the spatial resolution of PET is on the order of 5 mm, the spatial resolution of SPECT is on the order of 15 mm, and in the anatomic imaging modalities it may be less than 1 mm. In PET and SPECT, many relevant lesions seen in the body, such as lymph nodes, may be smaller than a single voxel, and they might not be detected due to limited spatial resolution. Nevertheless, in both PET and SPECT, smaller lesions can be detected if their specific activity is high (this is also true for the anatomic imaging modalities, but to a lesser extent, because contrast differences are typically not as high as they are in PET and SPECT). The point spread function smears a focus out over the entire voxel. As an example, let us assume, first, that a voxel in a PET examination has linear dimensions of 10 mm and thus a volume of 1,000 mm3; second, that the minimal activity a focus needs to have to become detectable is two times higher than its surroundings; and third, that the
background activity has a value of 1 (arbitrary unit). If a focus has an activity eight times higher than the background, a focus that is only 5 mm in diameter and has a volume of 125 mm3 will still generate an apparent activity that is 8 × 125/1,000 = 1 above the background activity. The voxel containing that focus will then have an activity twice that of the background, which is readily detectable. Hence, a lesion with a volume only 1/8 of the voxel can be detected when its activity is eight times that of the background. The activity of the focus, however, is artificially reduced to 2. In general, partial-volume effects make very small lesions undetectable, but lesions somewhat smaller than the voxel can still be detected, although they will have an artificially lowered activity. In PET, this effect is particularly relevant in the case of small pulmonary metastases, which either may escape PET detection because of their size or appear to have a low SUV despite the fact that the primary tumor has a high SUV. Analogous arguments can be made for the detection of a focus in CT, but scaled to the resolution of CT.
background activity has a value of 1 (arbitrary unit). If a focus has an activity eight times higher than the background, a focus that is only 5 mm in diameter and has a volume of 125 mm3 will still generate an apparent activity that is 8 × 125/1,000 = 1 above the background activity. The voxel containing that focus will then have an activity twice that of the background, which is readily detectable. Hence, a lesion with a volume only 1/8 of the voxel can be detected when its activity is eight times that of the background. The activity of the focus, however, is artificially reduced to 2. In general, partial-volume effects make very small lesions undetectable, but lesions somewhat smaller than the voxel can still be detected, although they will have an artificially lowered activity. In PET, this effect is particularly relevant in the case of small pulmonary metastases, which either may escape PET detection because of their size or appear to have a low SUV despite the fact that the primary tumor has a high SUV. Analogous arguments can be made for the detection of a focus in CT, but scaled to the resolution of CT.
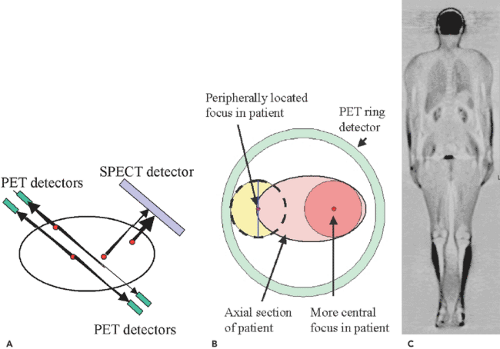 Figure 33.1 A: Attenuation of photons in SPECT and PET imaging. Rays coming from foci located centrally in an axial section will have to travel through more tissue (light pink ellipse) to reach the detectors than those located peripherally A: (size of arrows representing differential absorption) Hence their radiation is more strongly absorbed, and the focus will appear attenuated. Although this conclusion is correct for SPECT, it is too simplistic for PET, where two photons are needed for an event to be detected. It turns out that as long as the combined path of photons in tissue is equal, attenuation for the sum of both coincident rays is equal. B: The reason for central decrease of apparent activity is seen here. A peripheral focus will have most photons nonattenuated (yellow circle), whereas a centrally located one will have most attenuated (dark pink circle). C: The coronal section of an nonattenuated section of a whole-body PET scan shows relative enhancement of activity at the skin surface (most prominently in the neck region) and the liver surface, with some apparent activity in the lung, which is also artificial. Activity in the calf muscles is due to exercise prior to scanning. |
Reconstruction: Beam-Hardening Artifacts
Beam hardening occurs whenever polychromatic rays are traveling through dense material. In this situation, only the higher-energy photons are transmitted, while the lower-energy photons are absorbed. The spectrum of PET and SPECT gamma rays is close to monochromatic, whereas in CT polychromatic x-rays are used; thus beam hardening does not affect PET and SPECT images much but can severely deteriorate CT images. In CT, images affected by beam hardening show areas of higher and lower density, which is a result of CT spatial resolution insufficient to depict the interface of the high-density and low-density material and the lack of lower-energy photons, which have
been filtered out by the high-density material in the FOV (Figs. 33.3B and 34.15A). Furthermore, high- or low-density streaks, mostly in the left to right patient axis, can be noted even distant from the beam-hardening object in the image (Fig. 33.24D,F). These artifacts are noted frequently at the skull base and in the shoulder region, where the horizontal plane the bony shoulder girdle presents a substantial bulk of high-density absorption material. Any body portion containing a metallic implant, most notably hip prostheses and metallic dental work, will also generate beam-hardening artifacts. With low photon flux, these artifacts tend to be more prominent. As in PET-CT and SPECT-CT, frequently low-dose CT images are acquired, and the issue of image quality versus diagnostic necessity has to be carefully weighed.
been filtered out by the high-density material in the FOV (Figs. 33.3B and 34.15A). Furthermore, high- or low-density streaks, mostly in the left to right patient axis, can be noted even distant from the beam-hardening object in the image (Fig. 33.24D,F). These artifacts are noted frequently at the skull base and in the shoulder region, where the horizontal plane the bony shoulder girdle presents a substantial bulk of high-density absorption material. Any body portion containing a metallic implant, most notably hip prostheses and metallic dental work, will also generate beam-hardening artifacts. With low photon flux, these artifacts tend to be more prominent. As in PET-CT and SPECT-CT, frequently low-dose CT images are acquired, and the issue of image quality versus diagnostic necessity has to be carefully weighed.
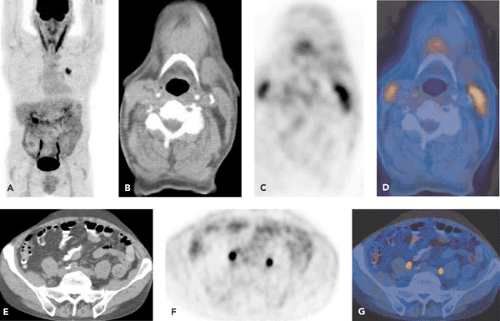 Figure 33.2 Maximum intensity projection of a normal transmission-corrected FDG-PET scan of a patient with left-sided bronchial carcinoma (focal uptake in the left hemithorax) (A). Note normal activity in the brain, the ureters (B–D), and the bladder. There is weak FDG uptake into soft-tissue structures such as the mediastinum and heart, the liver, the bowel, and the vessels of the extremities, most notably the femoral vessels. There is some periarticular uptake into the hip joints. Finally, there is some uptake into the lymphatic tissue of the head and prominent activity in the sternocleidomastoid muscles (V-shaped uptake in the neck) (E–G) and the laryngeal muscles (two foci close to the caudal end of the sternocleidomastoids). (See Case 75.) |
As stated, there are many other technical artifacts that can occur. They are related to partial loss of detector function, misalignment of the rotation center of the system, and many other causes. They are not discussed here, as they do not interfere with image interpretation when the system functions properly.
Strong CT beam attenuation by metallic implants will affect the quality of PET or SPECT emission images reconstructed using CT attenuation maps. Thus such attenuation affects not only CT images but also images of the integrated systems.
Artifacts Due to Integration of PET or SPECT with CT
The most relevant artifacts occurring as a result of the integration of PET or SPECT and CT are due to a limited axial FOV in CT or to erroneous attenuation values introduced from CT attenuation maps into attenuation-corrected PET and SPECT images. Some of the basic issues concerning these artifacts are covered in Chapters 7 and 8. Here, the clinical implications are emphasized.
Limited Axial Field-of-View Artifacts
In a CT scanner, a limited axial FOV can cause linear craniocaudal streaks, which prominently appear on the lateral edges of the coronal PET sections’ maximum-intensity projection images (Fig. 33.4). In wide patients, particularly in the shoulder region, the most lateral body portions will not be in the CT fan beam when it cuts through
the patient in the anteroposterior and posteroanterior positions. These artifacts have to be recognized but are hardly a problem for image interpretation as long as the pathology evaluated is not located very laterally. This problem is obviously nonexistent when using gamma ray sources in PET- and SPECT-only systems, as the beam coverage for the emission and attenuation-correction scans are the same. Most recent reconstruction algorithms are able to suppress these artifacts.
the patient in the anteroposterior and posteroanterior positions. These artifacts have to be recognized but are hardly a problem for image interpretation as long as the pathology evaluated is not located very laterally. This problem is obviously nonexistent when using gamma ray sources in PET- and SPECT-only systems, as the beam coverage for the emission and attenuation-correction scans are the same. Most recent reconstruction algorithms are able to suppress these artifacts.
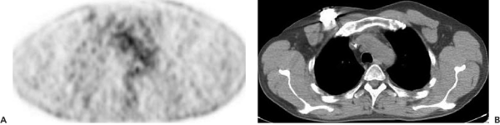 Figure 33.3 Patient with a right anterior chest chemotherapy reservoir producing a slight artificial increase of activity on the PET scan (A), while the CT scan (B) shows beam-hardening artifacts around the metallic object and some low-density streaks in the right anterolateral chest region. |
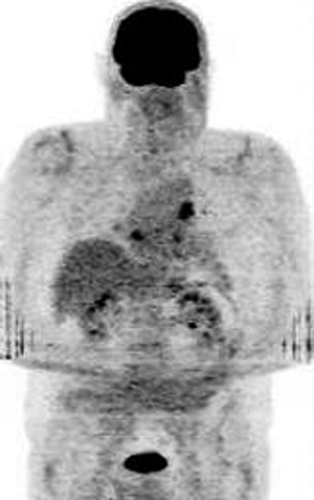 Figure 33.4 A 65-year-old male patient with bronchial carcinoma. The vertical stripe artifacts near both elbows are a result of the patient’s width, which in this region extends beyond the CT field of view. Such artifacts are typically observed in heavier patients. Also note the activity in the acromioclavicular and the glenohumeral joints (with emphasis on the right side), which is due to chronic osteoarthritis. |
There are several causes that introduce erroneous attenuation values from CT scans into the algorithm correcting PET or SPECT images for attenuation:
Use of CT scans with beam-hardening artifacts for attenuation correction,
Erroneous attenuation in metal-containing regions,
Erroneous attenuation in regions containing high-concentration x-ray contrast agents, and
Erroneous attenuation due to physiological movements between CT and PET or SPECT data acquisition.
The errors associated with these causes of improper attenuation correction are discussed in the following paragraphs.
The basic principle for all the causes listed is the same. If the CT data suggest lower attenuation in a certain region than really exists, the PET or SPECT activity in this region will not be adequately enhanced by the attenuation correction algorithm, leading to an apparent photon deficit. Conversely, if the CT data suggest higher attenuation than actually exists, the attenuation correction algorithm will increase the PET or SPECT activity of that region too much, leading to an apparent activity accumulation.
Attenuation Artifacts Due to Beam Hardening
As stated earlier, beam hardening occurs when x-rays travel through high-density material such as extended areas of bone (see Fig. 33.24D,F), or, more importantly, prosthetic metallic implants. The artifacts are stronger the higher the density (z-value) of the object. Due to beam hardening, the CT data have either artificially higher or lower Hounsfield unit pixels surrounding the actual object. As a result, CT-corrected PET and SPECT images show artificial activity in these pixels, which depends somewhat on the SPECT or PET reconstruction algorithm used. Because of these artifacts, it is difficult to obtain meaningful diagnostic information from PET-CT or SPECT-CT images in the immediate surrounding of a metallic implant. In daily practice, this problem is mostly seen in patients with metallic implants (5), most notably metal dental work (Figs. 33.5 and 34.15A) (6). The definition of the extent of a floor-of-the-mouth tumor near dental metal work may
be impossible, or activity along the shaft of a hip prosthesis may suggest the presence of an infection. Diagnostic improvement in these situations can be obtained by also examining the emission scans not corrected for attenuation. Artificial lesions will disappear or fade, while real lesions will persist (Fig. 33.5A,B).
be impossible, or activity along the shaft of a hip prosthesis may suggest the presence of an infection. Diagnostic improvement in these situations can be obtained by also examining the emission scans not corrected for attenuation. Artificial lesions will disappear or fade, while real lesions will persist (Fig. 33.5A,B).
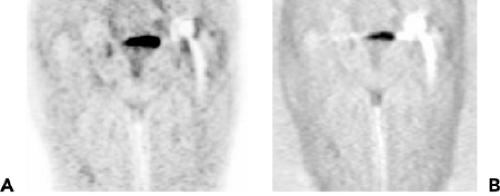 Figure 33.5 A: Normal hip prosthesis in a scan corrected for attenuation showing significant apparent FDG uptake, which might be interpreted as infection or inflammation but is actually an artifact. B: Virtually no artifact is present in this uncorrected emission scan. |
Attenuation Artifacts Due to Metallic Objects
In the location of a metallic object in the CT image, the Hounsfield units may be properly represented or come out to high or too low (see Fig. 33.3). How an actual metal object is depicted in a PET or SPECT scan is thus somewhat unpredictable, but also irrelevant, because by definition there will be no activity concentration within the metallic object.
Attenuation Artifacts Due to Extrinsic Contrast Material
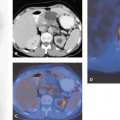
These artifacts, which occur when CT contrast material with high Hounsfield units is present in CT scans, are discussed in Chapter 7. Briefly, the contrast material used in CT is a good contrast agent for distinguishing soft tissues from contrasted structures at CT photon energies of around 100 keV and also for the most frequently used technetium 99m (99mTc)-based SPECT agents. However, at PET photon energies of 511 keV, the CT contrast agents provide no contrast to soft tissues: they attenuate no more than water. Areas containing CT contrast material thus look like soft tissue for the PET photons. But on the basis of the CT scan, an overcorrection of the activity in the region in the attenuation correction process of the PET scan makes this region appear to have higher activity than in reality. These effects are only relevant when the contrast focus on CT exceeds around 200 Hounsfield units, as only beyond this CT density do relevant apparent SUV increases above 5% occur in the PET images (7,8,9). Clinically, the presence of dilute oral contrast agent in the bowel is thus hardly ever a problem, while concentrated bowel contrast remaining from a previous abdominal contrast examination with conventional or CT techniques may cause an artificial focus (Fig. 33.6). We also do not recommend use of CT scans that have been acquired during dynamic intravenous CT contrast infusions, as the Hounsfield units measured in the large arterial vessels may exceed the critical level of 200. Thus, in our institution, dynamic intravenous-enhanced CT scans are always acquired as an add-on after a (low-dose) nonenhanced initial CT attenuation-correction scan and the PET emission scan (see Chapter 19).
Attenuation Artifacts Due to Physiological Motion
Physiological misregistration artifacts occur when the PET or SPECT emission scan are displaced relative to the CT scan used for attenuation correction. This is not only relevant when CT attenuation maps are used but can also be relevant when attenuation correction in PET or SPECT systems is done with rotating radioactive sources emitting gamma rays or x-rays. These artifacts can be caused by a misalignment of the PET or SPECT scanner relative to the CT scanner, which represents a technical problem that should be corrected immediately. In everyday scanning, these artifacts are related mostly to physiological motion. One source of physiological motion is patient movement between the examinations. This occurs relatively frequently in the head and neck regions. Fixation of the patient’s head
is useful for minimizing this type of motion. Artifacts due to such motion are particularly striking around metallic implants (5). There are software tools, such as the PMOD program (http://www.pmod.com), that can be used to eliminate such artifacts by simply translating or rotating the image sets after the acquisition to counteract the translation or rotation the patient underwent between the CT scan and the PET or SPECT scan. Because oncologic patients are usually cooperative and hold their body still during the 20 or so minutes of image acquisition, this type of physiological motion does not frequently introduce image artifacts.
is useful for minimizing this type of motion. Artifacts due to such motion are particularly striking around metallic implants (5). There are software tools, such as the PMOD program (http://www.pmod.com), that can be used to eliminate such artifacts by simply translating or rotating the image sets after the acquisition to counteract the translation or rotation the patient underwent between the CT scan and the PET or SPECT scan. Because oncologic patients are usually cooperative and hold their body still during the 20 or so minutes of image acquisition, this type of physiological motion does not frequently introduce image artifacts.
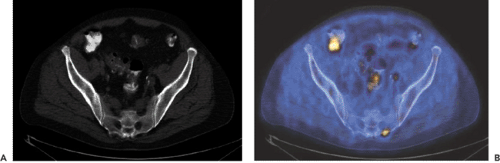 Figure 33.6 Increased PET focal activity due to a contrast agent. A: A CT section demonstrates accumulation of the contrast agent in the ascending colon, with no evidence of a solid tumor in the bowel. B: The corresponding PET-CT image shows artificially increased FDG uptake in that region. |
The major source of misregistration artifacts is involuntary physiological motion. Involuntary movements occur in the trunk of the body and are related to respiration, cardiac contraction, peristalsis, and bladder filling between scan acquisitions. Because in PET-CT, CT data are obtained at a speed much faster than a respiratory cycle, they depict images in a specific phase of the respiratory and the cardiac cycles. The much longer PET and SPECT data acquisition averages over all respiratory and cardiac positions. Note that the early SPECT-CT systems use slow CTs, and so cardiac and respiratory misregistration is no problem in such systems. Peristaltic bowel motions are slower and rarely a problem of misregistration. If necessary, bowel motility–reducing drugs can be given prior to scanning. Bladder filling is a nonissue if CT data acquisition and acquisition of emission data in the bladder region are done right one after the other, because then there will be not much bladder filling between scans. Because the heart is not an organ of diagnostic relevance in partial-body imaging, the only cause of physiological misregistration of major concern is respiration. Respiratory effects are most marked around the diaphragm. The most prominent artifact induced by this motion is an artifact I like to call the “banana artifact” because on coronal PET sections near the central body axis scans it looks like two low-activity bananas overlying the diaphragm (Fig. 33.7A–C). Although PET or SPECT will depict the average tidal breathing position of the diaphragm, in CT the diaphragm may be caudally displaced relative to this position when the CT is acquired with the patient close to end-inspiration or in end-inspiratory breath-hold. Such a CT used for attenuation correction will erroneously place lung tissues in the cranial abdominal regions, where on coregistered PET or SPECT there are soft tissues. As the lung CT pixel values are low and result in a low attenuation correction, this region will appear as having less activity than it actually has. The cranial areas of the liver and the spleen thus appear as if they would be part of the lung on the PET or SPECT scans.
 Figure 33.7 PET-CT coronal sections showing breathing misregistration artifacts in the supradiaphragmatic parts of a CT attenuation-corrected PET scan in a patient who shows two foci of a splenic lymphoma. A: MIP-PET scan showing the two lesions. B: In a central coronal section, banana-shaped zones of low activity overlie the diaphragm. C: One focus appears to lie above the diaphragm, but the actual location of the diaphragm is at the level of the red line. CT (D) and PET-CT (E) sections at the level of that lesion, with a discrete hypodense area noted on the CT scan (arrow). (See Case 80.) |
Although misregistration of peridiaphragmatic structures between PET or SPECT scan acquisition and CT scan
acquisition can introduce image artifacts, it can also introduce diagnostic errors, because the lesions noted in the emission images do not superimpose onto the correct anatomic structure on CT. Focal activity such as metastases in the cranial portions of the liver or spleen may thus appear as lung foci (Fig. 33.7C). Respiration-related misregistration can be minimized by giving the patient proper breathing instructions. We have found that instructing the patient to hold the breath at end-expiration will minimize the artifact (10). Unfortunately, patient instruction is somewhat time consuming. Also, frequently patients getting the order to hold their breath at end-expiration will take a deep breath due to apprehension, and thus end-inspiration CT images are acquired, resulting in the maximum diaphragmatic discrepancy in the emission scans. As a consequence, we have stopped instructing patients and acquire CT data during tidal breathing. This is acceptable with fast multi-slice CT data acquisition but may still cause problems with the lower-end CTs more frequently used in SPECT-CT systems.
acquisition can introduce image artifacts, it can also introduce diagnostic errors, because the lesions noted in the emission images do not superimpose onto the correct anatomic structure on CT. Focal activity such as metastases in the cranial portions of the liver or spleen may thus appear as lung foci (Fig. 33.7C). Respiration-related misregistration can be minimized by giving the patient proper breathing instructions. We have found that instructing the patient to hold the breath at end-expiration will minimize the artifact (10). Unfortunately, patient instruction is somewhat time consuming. Also, frequently patients getting the order to hold their breath at end-expiration will take a deep breath due to apprehension, and thus end-inspiration CT images are acquired, resulting in the maximum diaphragmatic discrepancy in the emission scans. As a consequence, we have stopped instructing patients and acquire CT data during tidal breathing. This is acceptable with fast multi-slice CT data acquisition but may still cause problems with the lower-end CTs more frequently used in SPECT-CT systems.
As shown in Figure 33.7, this misregistration is relevant not only for peridiaphragmatic attenuation correction but also for misplacement of lesions on the anatomic CT map. While this may result in problems in the upper abdomen, it hardly causes a difficulty in the chest (11). When a lesion is noted on an emission image, like a lung metastasis on a FDG-PET scan, and no corresponding lesion is found on CT, we know that the lesion is not real. The rule in the lung, which contains mostly air, is simple: if a lesion shown on an emission scan truly exists, it must be present on the CT scan, because the spatial resolution is much better in CT than in emission scans. A search for an anatomic focus in the vicinity of the focus on the emission image will have to demonstrate the anatomic lesion. This rule also applies in a situation that we have noted in very few FDG-PET scans and that could potentially occur in SPECT and with other radiopharmaceuticals as well. Slight problems with the injection of the radiopharmaceutical may result in the formation of a radioactively labeled micro blood clot. If this lodges in the lung as a micro embolus, a very high specific activity lesion may be apparent. Such a clot may fool one into thinking that a pathological focus is present. An inability to find a corresponding anatomic lung lesion will suggest this explanation for the focus (Fig. 33.8).
Related posts:
 PET Radiopharmaceuticals: Perfusion Compounds [13N]Ammonia, [15O]Water, [82RB]Rubidium, and Other Generator Products of Clinical Relevance
 The Normal Brain Scan
 Integrated SPECT-CT and PET-CT in Cardiac Imaging
 PET-CT and SPECT-CT of Bone Metastases
 SPECT and PET in Benign Thyroid and Parathyroid Disease
Stay updated, free articles. Join our Telegram channel

Full access? Get Clinical Tree


