Basics of PET Scanning
Cyrill Burger
David W. Townsend
Positron emission tomography (PET) involves the administration to a patient of a radioactive, positron-emitting nuclide, which tags a biomolecule specific to the physiologic process under investigation by PET. This so-called radiopharmaceutical is usually injected intravenously. If not confined to the intravascular space, it will be partially or completely extracted into the tissues during passage through the capillaries, where it may be metabolized or become bound at a specific receptor site. The ultimate fate of the PET tracer will depend on the outcome of these processes: it may be trapped irreversibly or washed out of the tissue. The radioactive tag allows the path of the pharmaceutical to be mapped noninvasively. The unstable, neutron-deficient nuclide decays by emitting a positron, which will annihilate with a nearby electron to create two 511-keV photons emitted opposite to each other. Detection of the two photons within a narrow time window is called a coincidence event, and the assumption is that the photons originated from a single annihilation occurring along the line of response defined by the direction of the photons (see Fig. 3.1). A PET scanner collects many such coincidence events within the field of view. The events are summed for each line of response and sorted into parallel projections of the positron-emitting distribution. By using standard reconstruction techniques, the underlying radiotracer distribution can then be recovered from the projection data. In principle, with adequate corrections for scattered and attenuated photons and random coincidences, the absolute tracer concentration can be measured by PET in units of kBq/mL averaged over the acquisition duration. Random coincidences arise when a pair of photons is detected within the coincidence time window and acquired as a true coincidence when the photons actually originated from different positron annihilations—hence the terms “random” or “chance” coincidence.
PET is intrinsically a three-dimensional (3-D) imaging technique. Initially, PET scanner designs incorporated lead septa that limit acceptance to photons within transverse planes only. This approach has the additional advantage of limiting the acceptance of scattered photons and requiring only a 2-D reconstruction algorithm, although this is achieved at the expense of reduced sensitivity. Removal of the septa typically increases the scanner sensitivity by a factor of 5, although the fraction of scattered events and the complexity of the reconstruction algorithm will increase.
Introduction
The basic principle of positron emission tomography (PET) involves the administration to a patient of a pharmaceutical tagged with a positron-emitting isotope. The pharmaceutical is chosen to target a particular metabolic pathway, and the decay of the positron-emitting isotope allows the metabolism to be monitored by detecting the annihilation radiation emitted from the patient. Intravascular tracers such as carbon monoxide (labeled either as 11CO or C15O) remain in the blood, whereas most other radiopharmaceuticals will be partially extracted into the tissue during the passage through the capillaries or will diffuse freely, such as oxygen 15 [15O]water. After extraction, a tracer will either follow a particular metabolic pathway or bind to a particular receptor system before being washed out of the tissue. Generally, the process is dynamic, and the tracer concentration in the tissue will change continuously with time. One exception is the widely used glucose analogue fluorodeoxyglucose (FDG) (2-fluorine 18 [18F]fluoro-2-deoxy-D-glucose), which becomes trapped in the tissue and reaches a near equilibrium state approximately 60 to 90 minutes after injection. More frequently, the injected tracer is metabolized into other chemical forms, so the radioactive tag may also label metabolites in addition to the original pharmaceutical. The PET scanner,
however, measures the total radioactivity in each image voxel, summed over the scan duration, without distinguishing between the different chemical forms. A metabolite analysis of arterial blood samples may be required in addition to the PET images to understand fully the physiologic behavior of the radiopharmaceutical.
however, measures the total radioactivity in each image voxel, summed over the scan duration, without distinguishing between the different chemical forms. A metabolite analysis of arterial blood samples may be required in addition to the PET images to understand fully the physiologic behavior of the radiopharmaceutical.
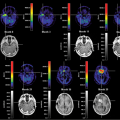
The kinetics of a tracer can be monitored dynamically in the PET scanner by acquiring multiple image frames as a function of time. The duration of each frame is related to the tracer kinetics and radionuclide half-life. Typically, short-duration frames are acquired immediately after injection to follow the rapidly changing kinetics, whereas longer-duration frames are acquired later in the scan, once the metabolism or binding of the tracer slows or is completed. Each pixel in each frame represents the tracer concentration in the tissue averaged over the scan duration and corrected for nuclide decay. By applying an appropriate kinetic model to the pixel time-activity curves derived from the PET images, absolute functional maps can be derived that measure tissue perfusion in milliliters per minute per milliliter of tissue or glucose utilization in milligrams per minute per 100 milliliters of tissue (see Chapter 13).
The annihilation radiation from an injected PET tracer is emitted in all directions from the patient, so PET is intrinsically a volume-imaging technique. However, early PET scanners accepted photons from transverse cross sections only, restricting the allowable incident photon directions by interplane septa between the detector rings. Over the past decade, PET scanners without septa, or with retractable septa, have become standard, allowing PET data to be acquired fully in 3-D. Once the volume has been acquired, it also can be either displayed as stacked 2-D transverse sections or resliced into coronal or sagittal sections for viewing. The isotropic spatial resolution of many modern PET scanners facilitates reslicing even in arbitrary oblique directions without disturbing artifacts.
Principles of PET Scanners
Localization of the Annihilation: Coincidence Events
PET radiopharmaceuticals are labeled with neutron-deficient, positron-emitting isotopes (see Chapter 2). When a positron is emitted from the nucleus, it interacts randomly with the surrounding tissue, losing energy until it annihilates with an electron, producing two photons of 511 keV, corresponding to the rest masses of the electron and positron. The distance traveled by the positron before annihilation is called the “positron range.” The two photons are emitted essentially in opposite directions at an angle of 180 degrees, although the angle may be slightly less when the electron–positron system is not at rest. The two photons are detected in coincidence by the PET scanner (Fig. 3.1). The locations of the two points of interaction with the scintillators form a line of response (LOR), whereas the actual location of the positron annihilation along the line is unknown. The distribution of positron emissions and hence the distribution of annihilation photons reflect the distribution of the radiopharmaceutical. Although the exact location of a single annihilation point cannot be known, the acquisition of a large number of coincidence events along all lines of response can provide enough information to reconstruct the underlying distribution of the radioisotope. Coincident events are defined as two photons detected within a very short time interval, or coincidence window, typically set at approximately 6 to 12 nanoseconds.
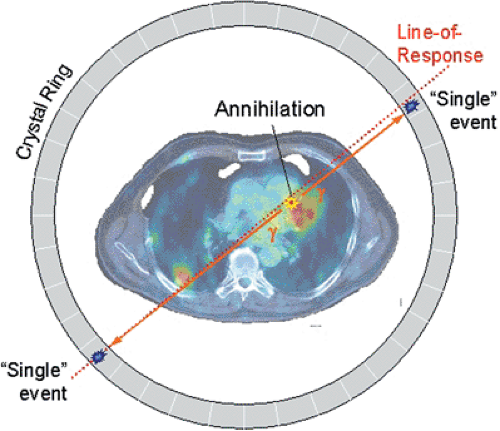 Figure 3.1 The localization of a positron annihilation and the definition of a line of response (LOR). Annihilation photons occur in pairs, traveling in opposite directions. Detection of two 511-keV photons in coincidence suggests that an annihilation occurred somewhere on the LOR between the two detectors involved. An LOR connects any pair of opposing detectors that are linked with coincidence electronics. |
The Full-Ring Positron Emission Tomography Scanner Design
Annihilation photons are emitted in all directions from PET tracer distributed in the body. To make maximum use of the emitted radiation, the PET scanner should cover as large a solid angle as possible. Photons emitted along lines outside the acceptance angle of the scanner are not used in the formation of the PET image, even though they still deliver a radiation dose to the patient. A typical PET scanner design comprises many individual detectors arranged in a cylindrical geometry of detector rings (Fig. 3.2). The region of the body to be imaged, such as the brain, is centered within the scanner. Each detector is in coincidence with a fan of opposing detectors (Fig. 3.3), and the arrival of a photon in a detector initiates a search for the corresponding photon within the appropriate opposing fan. When a pair of photons is identified within the fixed coincidence window, a
coincident event is recorded for the corresponding LOR, and the event count within the LOR is incremented.
coincident event is recorded for the corresponding LOR, and the event count within the LOR is incremented.
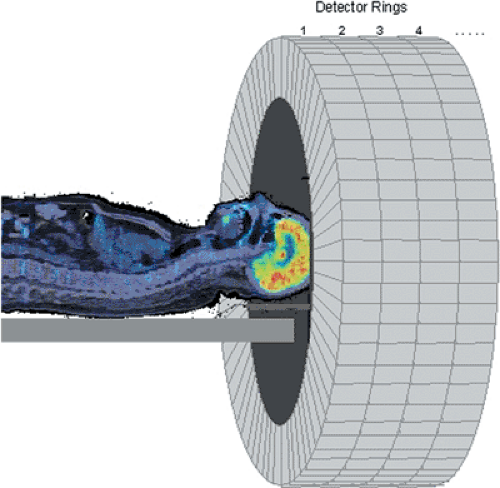 Figure 3.2 A schematic drawing of a full-ring PET scanner. A cylindrical field of view is enclosed by rings of detectors that record the annihilation photons. The axial extent covered by the detector rings is typically ∼15 to 25 cm. |
Modern PET scanners acquire data in either 2-D or 3-D mode. In practice, all PET scanners can acquire coincidence data in 3-D, whereas scanners that incorporate retractable septa can acquire data in either 2-D or 3-D. In 2-D mode, only LORs between detectors in the same or immediately adjacent rings are acquired. Coincident events acquired within a detector ring contribute to direct planes, whereas oblique LORs contribute to cross planes, as shown in Figure 3.4. The cross planes interleave the direct planes, sampling the region between two contiguous direct planes. For the direct planes, the sensitivity has a triangular profile, being highest at the center of the plane and decreasing to zero at the edge. The sensitivity profile of the cross planes is different, as shown in Figure 3.4. In 2-D mode, the detector rings are shielded by lead-tungsten septa positioned between the rings (Fig. 3.5A). Photons
incident at angles larger than those of the cross planes are largely absorbed by the septa, reducing the singles rate on the detectors. Typically, in 2-D mode, 1% or fewer of the annihilation events occurring in the camera field of view (FOV) are used in the formation of the PET images because of the small effective solid-angle coverage in 2-D.
incident at angles larger than those of the cross planes are largely absorbed by the septa, reducing the singles rate on the detectors. Typically, in 2-D mode, 1% or fewer of the annihilation events occurring in the camera field of view (FOV) are used in the formation of the PET images because of the small effective solid-angle coverage in 2-D.
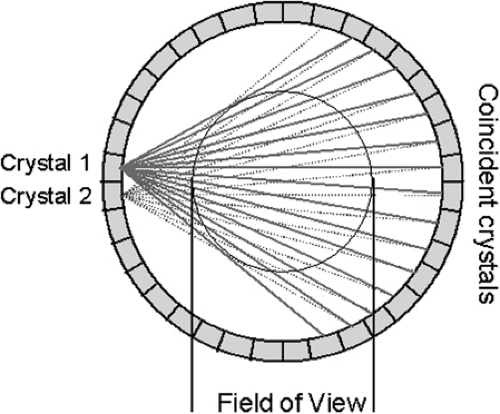 Figure 3.3 The LOR of one detector (crystal) in coincidence with a fan of opposing detectors. Coincidence logic links the detector with the set of opposing detectors in the fan. Coincidence fans are shown for two of the detectors in the ring. |
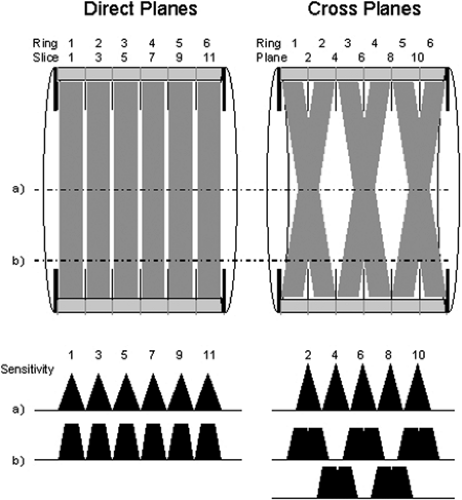 Figure 3.4 Slice definition of a multi-ring PET system operating in 2-D mode, as described in the text. The profiles in the lower section indicate the system sensitivity at the indicated positions in the scanner field of view. Apart from the illustrated high-resolution mode, there also is a high-sensitivity mode in which additional coincidences between more distant rings also are accepted. For example, coincidences between rings 1 and 3 would also be counted for direct plane 2 in the high-sensitivity mode. |
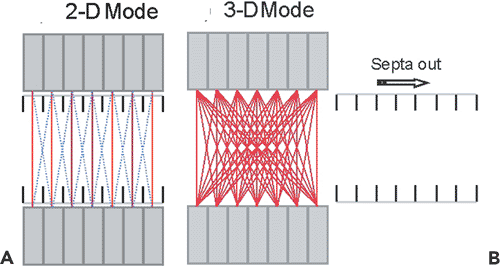 Figure 3.5 Acquisition modes of PET scanners with ring geometry. A: 2-D acquisition. Tungsten septa stop photons traveling at oblique angles. Coincidences between neighboring rings are accepted to increase sensitivity and define cross slices. B: For the 3-D acquisition mode, the septa are retracted, and coincidences allowed for large axial acceptance angles. |
The 3-D imaging mode for PET scanners has been available since the late 1980s. In 3-D mode, the LORs between any pair of detector rings are active, rather than only adjacent detector rings, as in the 2-D mode (Fig. 3.5B). The implementation of the 3-D method required hardware modifications to the scanner to acquire all LORs, the development of suitable 3-D reconstruction algorithms, and an accurate scatter-correction model. The reason for the latter is that, even though the count rate increases by a factor of up to 8 when the septa are removed, the number of scattered coincidences increases by a factor of 3, from a 10% effect up to a 30% to 40% effect. Therefore for accurate quantification, it is essential to implement a scatter-correction model. The reason for the increase in scatter is the absence of septa in 3-D, which in 2-D prevent most of the scattered photons from reaching the detectors. The net increase in true coincidences is therefore about a factor of 5, owing to the increase in scatter and randoms (Fig. 3.6).
As shown in Figure 3.5, from the geometry of 3-D acquisition, the increase in sensitivity is greatest at the center of the axial FOV and decreases toward the edges. The signal-to-noise ratio in 3-D in the axial end slices may even be less than that in 2-D, because there is an increase in scatter without any corresponding increase in true coincidences (1). Further, in the absence of septa, activity located outside the FOV will emit photons into the detectors, increasing the level of random coincidences and scatter. For brain imaging, the use of a simple annular shield inserted into the patient port to reduce the diameter can effectively reduce the randoms rate by a factor of 2 in [15O]water activation studies (2). Effective shielding presents a greater problem for whole-body imaging in 3-D, and on scanners with retractable septa, many whole-body oncology studies are still acquired in 2-D, even with the reduced sensitivity. A performance evaluation of the GE Advance scanner operated in 3-D showed that the in-plane resolution was the same as that in 2-D for the central part of the axial FOV, degrading by approximately 10% in the end sections (3). The axial resolution in 3-D degraded by approximately 20% compared with that in 2-D, owing to the increased axial length of the crystals compared with the in-plane dimension.
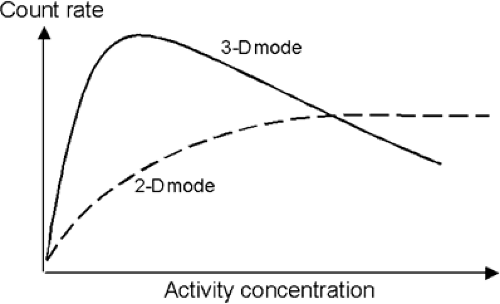 Figure 3.6 The schematic relation between activity in the field of view of a PET scanner and the measured count rate. The figure demonstrates that in 3-D mode the optimal performance is achieved with low activity concentrations and that PET systems can become saturated at high activity levels. |
The development of the 3-D method also required more complex procedures for detector normalization and attenuation correction (4). Originally, the large data-set sizes in 3-D and the long reconstruction times were something of a drawback, but more recently significant increases in storage capacity and processing power have essentially removed these limitations. Over the past decade, the 3-D approach has been used extensively for brain studies, particularly activation and neuroreceptor studies, owing to the ability to shield the scanner FOV from external sources of activity. The use of 2-D for whole-body and cardiac imaging may still be preferred when accurate quantification is required, although, as discussed in the next section, many of the large installed base of clinical PET scanners operate in 3-D mode only.
The Emission Scan
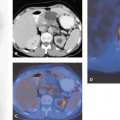
The objective of a PET scan is to determine the spatial distribution of the tracer within the FOV averaged over the duration of the scan. Such an acquisition is usually termed a “frame.” When the kinetics of the tracer is to be followed, multiple short-duration frames are acquired from the moment of injection up to maybe 60 to 90 minutes after injection, depending on the actual tracer kinetics and the half-life of the nuclide. To measure tissue perfusion, [15O]water is injected and followed up dynamically for several minutes after injection. Perfusion values are extracted by modeling the tracer kinetics, as shown in Figure 3.7. As described, emission scans can be acquired in 2-D with septa extended or fully in 3-D with septa retracted. Scanners used primarily for clinical studies are often 3-D only, such as the Philips Allegro (PET)/Gemini (PET-CT) or the Siemens ACCEL (PET)/Biograph (PET-CT). A clinical oncology study usually comprises a single-frame emission acquisition at multiple bed positions covering 100 cm or more of axial length. The objective is to survey the body of the patient for disease, particularly the presence of metastases. After the acquisition at multiple bed positions, the reconstructed images are combined into a single data set covering the entire volume scanned. The images can be viewed in transverse, coronal, or sagittal orientation.
Related posts:
 Design Criteria for PET Scanners: What is Important and Why
 11C-Based PET- Radiopharmaceuticals of Clinical Value
 Brain Tumors: Astrocytoma, Oligodendroglioma, and Glioblastoma Images with PET and SPECT
 Sentinel Node Imaging in Head and Neck Tumors
 PET-CT and SPECT-CT of Bone Metastases
 SPECT and PET in Benign Thyroid and Parathyroid Disease
Stay updated, free articles. Join our Telegram channel

Full access? Get Clinical Tree


