Brain Tumors: Astrocytoma, Oligodendroglioma, and Glioblastoma Images with PET and SPECT
Lutz W. Kracht
Karl Herholz
Stefan Vollmar
Andreas H. Jacobs
Primary brain tumors arise from different types of brain cells: glial cells, neurons, neuroglial precursor cells, pinealocytes, the meninges, choroids plexus, pericytes of the vessels, hypophysis, and lymphocytes. The most common primary brain tumors in adults are gliomas and meningiomas. The grading of brain tumors is based on histopathological changes according to the World Health Organization (WHO), the most common and also most fatal being the glioblastomas, corresponding to WHO grade IV. A better understanding of glial tumorigenesis is crucial for the development of specific molecular therapeutic targets to overcome current therapeutic limitations. Molecular alterations have been identified that indicate the therapeutic response of patients and thus are prognostically relevant. All therapeutic interventions are palliative and therefore must preserve or improve brain function rather than sacrifice it for some tumor treatment of limited efficacy. On the other hand, tumor treatment should be as aggressive and effective as possible to save years of life. Current therapeutic strategies in the treatment of brain tumors, such as stereotactic radiation therapy, stereotactic brachytherapy, and neuronavigation in open surgery, rely on preoperative imaging data. As therapeutic strategies improve in the coming years and patient therapy becomes more and more individually adapted, it will be of utmost importance to gather full information from the different anatomic, metabolic, and functional imaging modalities for therapy planning.
Introduction
Primary brain tumors arise from different cell types of the brain: glial cells, neurons, neuroglial precursor cells, pinealocytes, the meninges, choroids plexus, pericytes of the vessels, hypophysis, and lymphocytes. The incidence of primary brain tumors varies between the different subtypes. The most common primary brain tumors in adults are gliomas and meningiomas. For gliomas, the incidence is 6 to 8 in 100,000, with approximately 50% belonging to
malignant subtypes. Lower-grade tumors tend to occur in younger patients, whereas higher-grade tumors are more frequent in older patients. Gliomas are divided histologically into astrocytomas, oligodendrogliomas, mixed oligoastrocytomas, ependymal tumors, and tumors of the choroids plexus. Grading is based on histopathological changes according to the World Health Organization (WHO). The most common and also most fatal primary brain tumors are the glioblastomas, corresponding to WHO grade IV (1). Together with all intracranial neoplasms, the glioblastoma is the second most common cause of death due to an intracranial disease after stroke. Despite aggressive multimodal treatment strategies (surgery, radiation, chemotherapy), the median survival of patients with gliomas is limited, depending on the grade and age at diagnosis; it varies from 1 year for glioblastoma to 2 to 3 years for a grade III glioma and 5 to 10 years for a grade II glioma.
malignant subtypes. Lower-grade tumors tend to occur in younger patients, whereas higher-grade tumors are more frequent in older patients. Gliomas are divided histologically into astrocytomas, oligodendrogliomas, mixed oligoastrocytomas, ependymal tumors, and tumors of the choroids plexus. Grading is based on histopathological changes according to the World Health Organization (WHO). The most common and also most fatal primary brain tumors are the glioblastomas, corresponding to WHO grade IV (1). Together with all intracranial neoplasms, the glioblastoma is the second most common cause of death due to an intracranial disease after stroke. Despite aggressive multimodal treatment strategies (surgery, radiation, chemotherapy), the median survival of patients with gliomas is limited, depending on the grade and age at diagnosis; it varies from 1 year for glioblastoma to 2 to 3 years for a grade III glioma and 5 to 10 years for a grade II glioma.
A better understanding of glial tumorigenesis is crucial for the development of specific molecular therapeutic targets to overcome current therapeutic limitations. A complex series of molecular changes occurs that results in dysregulation of the cell cycle, in alterations of apoptosis and cell differentiation, and in neovascularization as well as tumor cell migration and invasion into the brain parenchyma. During progression from low-grade astrocytoma (WHO grade II) to anaplastic astrocytoma (WHO grade III) and to glioblastoma multiforme (WHO grade IV), a stepwise accumulation of genetic alterations occurs. Whereas TP53 mutation and PDGF and PDGFR overexpression represent early changes during low-grade glioma development, progression to anaplastic astrocytoma is associated with pRB alteration and loss of heterozygocity (LOH) of 19q and further malignant progression to glioblastoma, including LOH 10q and mutations of the PTEN gene (1,2). These secondary glioblastomas, which develop from better differentiated astrocytomas, can be distinguished from primary de novo glioblastomas on the basis of molecular genetic findings, with amplification and/or overexpression of the EGFR, p16 deletion, PTEN mutation, pRB alteration, and LOH 10p and 10q associated with primary glioblastoma (1,2). Most importantly, molecular alterations have been identified that indicate the therapeutic response of patients and thus are prognostically relevant: anaplastic oligodendrogliomas with LOH 1p and/or LOH 19q are characteristically sensitive to PCV (procarbazine, lomustine [CCNU], and vincristine) chemotherapy, and patient survival can be significantly prolonged (3).
In the treatment of brain tumors, the interaction and balance between tumor and brain function is particularly delicate, especially in gliomas, because of their invasive growth and the lack of curative treatment for most of them. Thus, all therapeutic interventions are palliative and therefore must preserve or improve brain function rather than sacrifice it for some tumor treatment of limited efficacy. On the other hand, tumor treatment should be as aggressive and effective as possible to save years of life. Current therapeutic strategies in the treatment of brain tumors, such as stereotactic radiation therapy, stereotactic brachytherapy, and neuronavigation in open surgery, rely on preoperative imaging data. As therapeutic strategies improve in the coming years and patient therapy becomes more and more individually adapted, it will be of utmost importance to gather full information from the different anatomic, metabolic, and functional imaging modalities for therapy planning.
PET and SPECT Tracers
Several PET and SPECT tracers have been used in patients with brain tumors in the past decades, with some success. We will not review all of these tracers but focus on the three tracers that have been shown to be most useful in gliomas.
2-[18F]Fluoro-2-Deoxy-D-Glucose
Glucose consumption measured by 2-[18F]fluoro-2-deoxy-D-glucose (18F-FDG)-PET is increased in most malignant gliomas. Although 18F-FDG uptake correlates with the degree of malignancy, there are concerns about the use of the 18F-FDG model to calculate the cerebral metabolic rate of glucose (CMRGlc) in brain tumors. The lumped constant used in the model to estimate glucose consumption from 18F-FDG uptake seems to be higher in tumors and therefore overestimates the glucose consumption if the value for the normal brain is used. Changes in the lumped constant in tumors compared with normal brain may be due to increased expression of hexokinase II in tumors. Hexokinase II has a higher affinity for 18F-FDG than does hexokinase I, which is expressed in the normal brain (4). Increased transport may also play a role, together with increased glycolysis compared with the oxidative metabolism of glucose.
In clinical routine, 18F-FDG images are analyzed visually or the relative 18F-FDG uptake compared with normal brain structures unaffected by the tumor is calculated. Preferably, uptake in the cerebral cortex or the deep white matter and average uptake in the regions of interest are used to calculate relative uptake ratios.
PET studies at the Max Planck Institute are performed either on an HRRT or ECAT EXACT HR (Siemens CTI, Knoxville, TN) (5,6). For an 8F-FDG investigation, the patient is asked to fast on the day of the exam and is encouraged to drink water to facilitate clearance of the FDG from the body. The standard dose of administered 18F-FDG is 10 mCi for adults. In our institute, a 6- to 10-minute transmission scan (depending on scanner) is performed prior to injection of the tracer. The patient is instructed to keep eyes shut, especially when the tumor is located next to or in the occipital lobe. The tracer accumulation is recorded in 3-D mode over 60 minutes in 47 transaxial slices from the entire brain. Summed activity
from 20 to 60 minutes after tracer injection is used for image reconstruction. Images are reconstructed using Fourier rebinning and filtered back-projection with a ramp filter. Images are corrected for scatter, attenuation, and random coincidences.
from 20 to 60 minutes after tracer injection is used for image reconstruction. Images are reconstructed using Fourier rebinning and filtered back-projection with a ramp filter. Images are corrected for scatter, attenuation, and random coincidences.
Amino Acid Tracers
Several studies using different amino acids tracers demonstrate that increased amino acid uptake in gliomas is not a direct measure of protein synthesis but rather seems to be due to increased transport mediated by type L amino acid carriers (7,8,9). Miyagawa et al. demonstrated in a rat tumor model that facilitated transport of amino acids is up-regulated and suggested that tumors can influence transporter expression in their vasculature (9). At the normal blood–brain barrier, the sodium-independent L-transporter system in the luminal membrane of endothelial cells is the main mechanism of methionine and tyrosine transport into brain tissue (10,11,12,13). Movement of an amino acid across sodium-independent transporter systems is driven by its extra- to intracellular concentration gradient, but it is frequently associated with countertransport of a second amino acid. The gradient of this second amino acid can be established by one of the sodium-dependent carriers, like the A system that is located in the abluminal endothelial cell membrane at the blood–brain barrier and transports amino acids with short polar side chains (11,12,13). Transport system A has been shown to be overexpressed in neoplastic cells and seems to be positively correlated with the tumor cell growth rate (14). This increased growth rate requires an efficient and increased supply of nutrients for protein synthesis, energy metabolism, and proliferation. Therefore, elevated transport of amino acids not only is a result of increased protein synthesis but also reflects the increased demand for the different metabolic activities in the tumor cell. It is well known that tumors can influence the growth of their vasculature and therefore can regulate their increased nutrient supply, including the supply of amino acids (15).
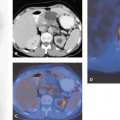
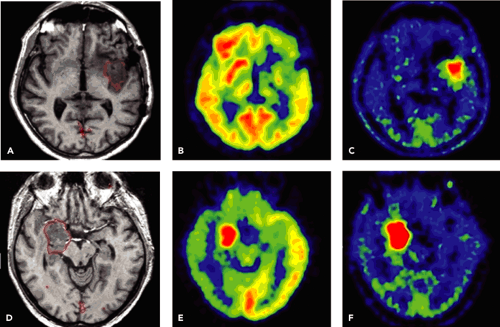 Figure 22.1 MRI (A,D), 18F-FDG- (B,E) and 11C-MET-PET (C,F) in low-grade (A,B,C) and high-grade (D,E,F) gliomas. 18F-FDG clearly distinguishes between the low-grade and high-grade tumors, in contrast to MRI. 11C-MET shows higher uptake in the malignant tumor, but a clear differentiation is not possible in these examples. (See also Cases 81 and 82). (Reproduced with permission from Jacobs AH. PET in gliomas. In: Schlegel U, Weller M, Westphal M, eds. Neuroonkologie. Stuttgart: Thieme Verlag; 2003:72–76. ) |
Amino acid uptake in the normal cortex is higher than in white matter, but relatively low compared with the high background activity of the normal cortex in 18F-FDG-PET (Figs. 22.1 and 22.2).
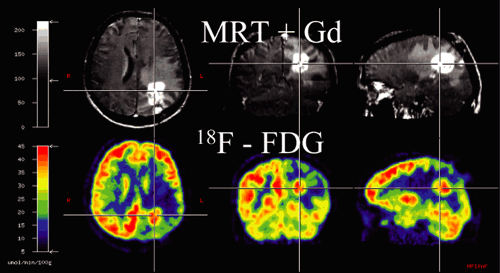 Figure 22.2 Typical pattern of a glioblastoma in 18F-FDG-PET. Uptake is in the range of the normal unaffected cortex colocalized with the contrast enhancement in MRI. The area of high 18F-FDG in the tumor is surrounded by decreased 18F-FDG in the cortex. |
Methyl-[11C]-L-Methionine
The most frequently used radiolabeled amino acid is methyl-[11C]-L-methionine (11C-MET). Radiochemical synthesis is not difficult and provides high levels of radiochemical without the need for complex purification steps (16). Other amino acid tracers, like O-(2-[18F]fluoroethyl)-L-tyrosine (18FET) or (18F)fluoro-Dopa (18F-Dopa), are transported in the brain and tumor, but no further metabolization takes place; thus they reflect transport only. 11C-MET, in contrast, is used in different metabolic pathways: 11C-MET is (a) incorporated into proteins, (b) used for methylation, and (c) is needed for DNA translation.
The ratio of 11C-MET uptake to background activity in tumors is in the range of 1.2 to 6.0 in gliomas. Uptake correlates to cell proliferation in cell culture (17), Ki-67 expression (18), proliferating cell nuclear antigen expression (19), and microvessel density (20), indicating its role as a marker for active tumor proliferation and angiogenesis. The highest uptake in gliomas is observed in anaplastic oligodendrogliomas WHO grade III.
L-3-[123I]Iodo-Alpha-Methyl Tyrosine
L-3-[123I]iodo-alpha-methyl tyrosine (123IMT) is a transport-only SPECT tracer. It is specifically transported via the L-transporter system, but as an artificial amino acid it does not undergo further metabolization or deiodination (21,22,23). In comparison with PET amino acid tracers, the main uptake of 23IMT arises within the first 30 minutes after tracer injection, and the tracer is slowly washed out of tumor tissue (22,23). Tumor-to-background ratios in brain tumors are in the range of 1.5 to 2.5 (24). A study by Langen et al. (25) showed comparable results for 123IMT and 11C-MET in patients with brain tumors.
Other Amino Acid Tracers
Various amino acids have been labeled for tumor imaging, especially with PET. As carbon 11 (11C)-labeled tracers can only be used in centers with an on-site cyclotron, there were several attempts to label amino acids with 18F-fluorine to facilitate a wider use of amino acid tracers. Clinically relevant findings have been obtained mainly with two of them: (a) 18FET showed results similar to those for 11C-MET and (b) 18F-Dopa, a very interesting amino acid tracer that has been successfully used in movement disorders for several years, also showed results comparable to those for 11C-MET in an initial study by Becherer et al. (26,27).
Data Acquisition of Amino Acid Tracers
Images in amino acid studies are usually acquired within the first hour after tracer injection. The main uptake in the tumor arises within the first 20 to 30 minutes after tracer injection, and a steady state is reached within the first 45 minutes (24). Patients should be studied under fasting conditions or should be on a protein-free diet on the day of the investigation, because extracellular amino acid concentrations clearly influence transport. Transport is concentration dependent, and the labeled tracer competes against the unlabeled amino acids at the transporter molecule (10,13).
In our institution, we use the following protocol for 11C-MET: After a 10-minute transmission scan, 740 MBq (20 mCi) are injected intravenously. Tracer accumulation is recorded in 3-D mode over 60 minutes from the entire brain. Summed activity from 20 to 60 minutes after tracer injection is used in our institution for image reconstruction. Images are reconstructed using Fourier rebinning and filtered back-projection with a ramp filter. Images are corrected for scatter, attenuation, and random coincidences. Other protocols use acquisition times from 0 to 20 minutes or from 20 to 40 minutes. For the implementation of 11C-MET images in the neuronavigation system or the stereotactic planning system, excellent image quality is necessary. To minimize influence from blood activity and to optimize imaging statistics, the later and longer acquisition protocol is preferable.
Image Coregistration
Image registration is extremely important for the accurate correlation of abnormalities on the MRI with the findings on the PET or SPECT scan (see also Chapter 10). Different modalities, such as 11C-MET and 18F-FDG, can be coregistered with MRI in glioma patients (see Fig. 22.2). Because we have established a common procedure with the different departments of the University Hospital of the University of Cologne involved in the treatment of patients with gliomas, most of the patients receive a precontrast T1-weighted MR scan, an axial T1-weighted postgadolinium MR scan, and a T2-weighted MR scan with an isotropic voxel size of 1 mm. This procedure not only allows coregistration of the different image modalities but also helps when PET images are used for biopsy planning, neuronavigation-guided surgery, and target volume planning in stereotactic brachytherapy using [125I]iodine seeds. For coregistration and conversion of the different file formats, we use an in-house–developed software called VINCI (28). A fully automated coregistration tool is implemented within this software that allows very fast and robust coregistration of different modalities. The coregistration is based on a mutual information algorithm and is optimized for brain imaging (28). All coregistered images can be stored in different file formats, such as the Stryker-Leibinger format for use in the stereotactic planning system or the DICOM format for use in the BrainLAB neuronavigation system (Fig. 22.3). Other features include a fusion of four different image modalities in the same
display and a semiautomated calculation of areas of increased 11C-MET uptake above a certain threshold.
display and a semiautomated calculation of areas of increased 11C-MET uptake above a certain threshold.
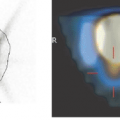
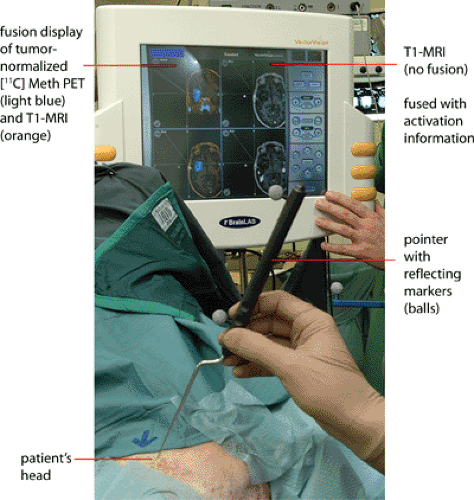 Figure 22.3 Integration of 11C-MET uptake above a threshold of 1.3 compared with a corresponding contralateral region (normalized 11C-MET-PET, light blue area on the screen) into a neuronavigation system to optimize extent of surgery. The position of the tip of the pointer is visualized on the screen (green line). |
If the images are not registered, the determination of the location of a small abnormality on the MR images cannot be accurately identified on the PET and SPECT scans. The registration with MRI permits the accurate characterization of even small MRI lesions. The image registration permits the interpreting physician to be more accurate and confident in the diagnosis.
Applications
Related posts:
 PET Radiopharmaceuticals: Perfusion Compounds [13N]Ammonia, [15O]Water, [82RB]Rubidium, and Other Generator Products of Clinical Relevance
 The Normal Brain Scan
 Sentinel Node Imaging in Head and Neck Tumors
 PET-CT and SPECT-CT of Bone Metastases
 SPECT and PET in Benign Thyroid and Parathyroid Disease
Stay updated, free articles. Join our Telegram channel

Full access? Get Clinical Tree


