PET/computed tomography and PET/MR imaging are used to evaluate the post-treatment neck. Although 18F-FDG is helpful in the staging and treatment response assessment of head and neck cancer, recently developed PET radiotracers targeting specific surface markers are promising for applications of diagnostic problem solving and improved extent delineation. Diffusion-weighted MR imaging is helpful in the differential diagnosis of head and neck neoplasms, and improves the sensitivity and specificity for the detection of certain pathologies. Following standardized imaging parameters for PET/computed tomography and diffusion-weighted imaging in PET/MR imaging improves diagnostic accuracy and allows for future research data mining.
Key points
- •
PET/CT can result in false-positive and false-negative results; it is imperative to understand normal variants of FDG uptake in the head and neck.
- •
Intimate understanding of surgical procedures and expected imaging changes is key to avoid misdiagnosis.
- •
Although 18F-FDG, which visualizes glucose metabolism, is helpful in the staging and treatment response assessment of head and neck cancer, more recently developed PET radiotracers targeting specific surface markers, such as 68Ga-DOTATATE for somatostatin receptor–positive neoplasms including paraganglioma, meningioma, and esthesioneuroblastoma, are promising for applications of diagnostic problem solving and may be a helpful adjunct in the differential diagnosis of head and neck neoplasms, and improve the sensitivity and specificity for the detection of certain pathologies.
Introduction
Head and neck tumors represent 3% of all malignant tumors in the United States. In the United States, there were an estimated 53,000 new cases and 10,860 estimated deaths in 2019, with approximately 1.2% of men and women being diagnosed with this disease. 2-Deoxy-2-(fluorine-18) fluoro- d -glucose (18F-FDG) uptake on PET with computed tomography (CT) is effective for monitoring head and neck cancer. However, variable physiologic FDG uptake and asymmetric FDG distribution in the neck can make image interpretation difficult. This is particularly evident in the post-treatment head and neck region, where alteration of expected anatomy makes diagnosis of recurrence or differentiating between recurrence and post-treatment change particularly challenging.
Thus, having an extensive understanding of the normal variants of FDG uptake, the causes of false-positive (FP) and postnegative results, surgical procedures, and expected imaging changes and imaging protocols and reporting methods are key in avoiding diagnostic pitfalls.
Accurate localization of head and neck cancer primary neoplasms and nodal metastases is critical, particularly in the setting of locoregional advanced disease and in the setting of recurrence. 18F-FDG-PET/CT allows for accurate visualization of lesions with increased metabolism and has been shown to have high diagnostic accuracy in newly diagnosed and recurrent head and neck cancer, and in the context of treatment response assessment. The specificity, sensitivity, positive predictive value (PPV), and negative predictive value (NPV) of PET/CT in the evaluation of the post-treatment neck has been extensively described in the literature. , A meta-analysis by Gupta and colleagues encompassing 51 studies and 2335 subjects determined that, for post-treatment FDG-PET/CT for the primary site, the sensitivity was 79.9%, specificity was 87.5%, PPV was 58.6%, and NPV was 95.1%.
PET/MR imaging has been available in the research setting for the past decade, and in recent years has found its way into clinical practice. PET/MR imaging has the advantage of decreased radiation dose given that MR is used for attenuation correction, obviating the need to acquire a CT; this advantage is of limited importance in the oncologic patient population often undergoing radiation therapy. Another key advantage is the increased soft tissue contrast allowing improved diagnostic performance compared with MR imaging alone or PET/CT alone (diagnostic accuracy of 0.926 vs 0.836 and 0.847; P <.05, respectively). A potential drawback of PET/MR imaging is the decreased detection rate of lung nodules, particularly when they are not FDG-avid. PET requires accurate quantification of radiotracer distribution, which in turn requires accurate attenuation correction. PET/CT accomplishes attenuation correction based on electron density as assessed with low-dose CT, allowing for a linear attenuation coefficient to be assigned based on Hounsfield units. However, MR imaging–based attenuation correction is more complex given that MR imaging signal intensity is dependent on proton density and relaxation times, and does not directly translate to electron density. The two main approaches to address the MR imaging–based attenuattion correction (AC) challenge are segmentation-based methods, which classify tissues based on MR imaging signal intensity into different tissue compartments (eg, air, fat, soft tissue, lung) that are then assigned a predefined linear attenuation coefficient; and atlas-based methods, which rely on a reference database of matching MR and CT images. Additionally, there are reconstruction-based methods with simultaneous reconstruction of attenuation and activity data, based on the so-called maximum likelihood estimation of attenuation and activity algorithm, which relies on deriving the patient’s body contours from non-AC images. However, the maximum likelihood estimation of attenuation and activity based approach is limited in that it relies on nonspecific accumulation of radiotracer in the skin, which is the case for FDG but not necessarily for many other radiotracers. The question of synergy arising from concurrent FDG-PET and MR imaging evaluation remains to be fully answered; however, PET/MR imaging represents a promising approach in the diagnosis and follow-up of head and neck cancer.
Utility of PET/computed tomography in diagnosis of recurrent tumor in the post-treatment neck
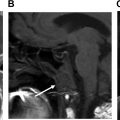
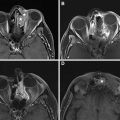
PET/CT performed in the early period after chemoradiation can help differentiate residual tumor from treatment-related changes. , It can help identify locoregional primary or nodal recurrence, new distal nodal, or distal organ metastatic disease, , and also assess response to treatment ( Figs. 1 and 2 ).


Anatomic and physiologic entities in the head and neck that result in false-positive and false-negative findings on 18F-FDG-PET
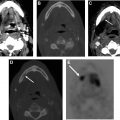
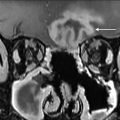
Although PET has a high NPV, it also suffers from several FPs that result in low PPV. This is caused in part by numerous normal anatomic structures demonstrating physiologically increased 18F-FDG uptake. The tonsillar pillars, parotid glands, minor salivary glands in the soft and hard palate, the sublingual and the submandibular glands and nasopharyngeal lymphoid tissues known as Waldeyer ring ( Fig. 3 ) can all demonstrate elevated 18F-FDG avidity. , Such lymphoid and glandular tissue can also be asymmetric and be mistaken for abnormality ( Fig. 4 ).


PEARL: To differentiate tumor from normal metabolic activity in cases of asymmetric 18F-FDG avidity, tonsillar maximum standardized uptake value (SUV) ratios may enable such distinction, with an SUV ratio greater than 1.6 conveying 62% sensitivity and 100% specificity.
Brown adipose tissue (BAT), also known as brown fat, can also demonstrate normal increased FDG uptake because of its high metabolic activity, and must not be confused with lymphadenopathy.
PEARL: BAT is most commonly seen in those with BAT activation on prior studies, lower body mass index, female gender, lower temperatures, late morning scans, and with lower blood glucose.
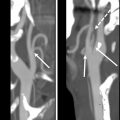
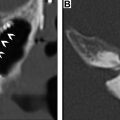
Skeletal muscle can also demonstrate intense metabolic activity because of shivering or tension ( Fig. 5 ). Note than in thin patients with minimal fat planes, intense muscle activity can obscure nodal disease ( Fig. 6 ). An addition, artifacts of attenuation correction, such as calcium and surgical clips, can result in artefactually increased 18F-FDG uptake ( Fig. 7 ). Symmetric vocal cord activity can be seen, especially if the patient is talking or vocalizing during the scan ( Fig. 8 ).


Finally, in about 90% of cases with metastatic cervical lymphadenopathy with primary tumors of “unknown” origin, a small primary in the oropharynx may be obscured by lingual or palatine tonsillar physiologic lymphoid 18F-FDG uptake, which can result in a false-negative (FN) result.
PEARL: Narrow the window significantly to increase tissue contrast.
Special considerations in imaging protocols and reporting systems
PET/Computed Tomography to Follow Quantitative Imaging Biomarkers Alliance Parameters
In order to standardize parameters to improve SUV comparisons across time and equipment, and to allow for big-data analysis, it is highly desirable that all PET/CT units follow the Radiological Society of North America’s Quantitative Imaging Biomarkers Alliance (QIBA) parameters. QIBA, formed in 2007, aims to advance quantitative imaging through a collaboration among clinicians, medical physicists, researchers, health care professionals, and industry. QIBA parameters have a rigorous system of implementation, with FDG-PET/CT as an imaging biomarker for tumor response currently in the most advanced stage of development (stage 3). QIBA Radiological Society of North America profiles for FDG-PET/CT are found in http://qibawiki.rsna.org/images/1/1f/QIBA_FDG-PET_Profile_v113.pdf . This profile provides not only indications for image acquisition, but also the preimaging and postimaging stages, region of interest placement, and calculations.
PEARL: Update your protocols to follow QIBA parameters, which will standardize your data and allow easier data aggregation for research purposes.
Time of Flight PET/Computed Tomography and Digital PET Technique for Improved Lesion Visualization
Although currently standard of care, it is important to be familiar with time-of-flight (TOF) PET/CT and the effect it has of increasing the SUV value of lymph nodes. This knowledge is especially critical if one interprets studies at an institution that has PET/CT units with and without TOF capability.
PITFALL: While comparing a prior study performed without TOF with a current study performed with TOF, one might incorrectly diagnose increased metabolic activity.
Likewise, using digital PET allows for smaller image resolution of 1 to 2 mm and enhanced definition of SUV, thus improving visualization and diagnosis of small nodal or tumoral disease ( Fig. 9 ). This occurs because of improvements in solid state (digital) photodetectors, which allows better detection of the two coincident photons generated by positron annihilation, permitting improved localization of the event.

Contrast-Enhanced PET/Computed Tomography and Value of Performing Dedicated Neck PET/Computed Tomography
Although there are no definitive studies that assess the question of whether there is improvement in diagnostic accuracy with the use of contrast-enhanced CT, contrast is useful in evaluating extracapsular spread of nodal disease and necrosis, which affect management. Dedicated PET/CT acquisition in the head and neck region has been demonstrated to result in improved spatial resolution and increased accuracy of SUV, compared with assessment of the head and neck region based on whole-body PET/CT images alone ( Fig. 10 ).

Neck Imaging Reporting and Data System
In 2016, the Neck Imaging Reporting and Data System (NI-RADS) was established with the purpose of “standardizing assessment and reporting in surveillance imaging for patients with head and neck squamous cell carcinomas and their subsequent management.” The categories have been published by the American College of Radiology. , The role of PET/CT in NI-RADS is to help stratify the imaging results in combination with anatomic imaging findings. Normal 18F-FDG uptake corresponds to NI-RADS 1, mild 18F-FDG uptake is categorized as NI-RADS 2, suspicious high 18F-FDG uptake is NI-RADS 3, and SUV uptake representing definite tumor recurrence is considered NI-RADS 4. The NI-RADS system is evaluated in detail elsewhere in this issue.
PET/MR Imaging Protocol Considerations
MR imaging–based attenuation correction is primarily accomplished on the basis of segmentation-based or atlas-based methods as described previously. For body PET/MR imaging applications, Dixon-based segmentation is the most commonly used approach, because of relatively fast acquisition and processing times and good reproducibility. For Dixon-based segmentation, separate fat- and water-images are acquired coronally and segmented into four compartments (soft tissue, fat, lung, air). , Methodologic challenges include limited bone tissue information, truncation of MR imaging data along patients’ extremities, and the need for additional hardware components that affect AC (eg, radiofrequency coils). Commercially available PET/MR imaging scanners today typically use a 3.0-T MR and a fully integrated PET detector with multiple coils including dedicated head and neck coils, body coils, and spine coils. Patient preparation, radiotracer dose, and uptake period are identical to established PET/CT protocols as detailed previously. Following acquisition of an MR-scout image, whole-body PET is acquired from the vertex to the mid-thigh, with 3 minutes of acquisition time per bed position and simultaneous MR imaging acquisition. Attenuation correction in the body is typically performed based on attenuation maps generated from the two-point Dixon sequence. Dedicated head-and-neck PET with concurrent diagnostic MR imaging is typically additionally acquired with a longer acquisition time of up to 10 minutes; although protocols vary from institution to institution, basic sequences acquired during PET/MR imaging studies are included in Box 1 .
- •
Imaging for attenuation correction (eg, two-point Dixon)
- •
Orthogonal T1 without FS
- •
Orthogonal T2 without FS
- •
Orthogonal STIR/FS T2
- •
DWI or diffusion kurtosis imaging
- •
VIBE 3D or SPACE 3D or MPRAGE a
- •
Simultaneous or sequential 18F-FDG or other radiotracer
- •
DSC/DCE or other perfusion imaging is acquired at some institutions
a If MPRAGE is acquired, orthogonal FS TSE T1-weighted views may also be required.
Related posts:
 Imaging of Complications of Chemoradiation
 Imaging After Sinonasal Surgery
 Surgical Free Flaps and Grafts in Head and Neck Reconstruction
 Imaging of the Postoperative Skull Base and Cerebellopontine Angle
 Imaging of Facial Reconstruction and Face Transplantation
 Imaging of the Postoperative Temporal Bone
Stay updated, free articles. Join our Telegram channel

Full access? Get Clinical Tree


