Fig. 15.1
Degree of coronary stenosis and subsequent cardiovascular events. In the coronary arteries, less obstructive plaques outnumber severely obstructive plaques. Vascular occlusions and cardiovascular events evolve most frequently from plaques that are only mildly to moderately obstructive months to years before infarction (Adapted with permission from a review article by Falk et al. [1])
The paradigm of simultaneous assessment of structure and biology has been successfully performed for over a decade in the field of oncology. Two landmark papers in 2003 demonstrated that combined molecular and structural imaging, using PET and CT, is capable to localize and stage tumors more accurately compared to structural imaging alone [3, 4]. These observations led to the vast proliferation of PET/CT scans and have since fundamentally transformed the practice of oncology. In the study of cardiovascular disorders, the similar paradigm of simultaneous evaluation of structure and biology of atherosclerosis is relatively new and rapidly evolving.
Several features of atherosclerotic plaques that can be visualized noninvasively through imaging have been shown to be associated with a heightened risk of subsequent atherothrombosis [5]. These features include positive remodeling, high lipid content (low-attenuation plaque), thin fibrous cap, evidence of ulceration, intra-plaque hemorrhage, and microcalcification [5, 6]. The biological processes within plaques are also known to be critically important to the progression and rupture of plaques. Among them, inflammation is thought to be a key participant in all stages of atherosclerosis, from plaque initiation to plaque progression to atherothrombosis [7, 8]. Accordingly, imaging of inflammation may also provide important insights into the atherosclerotic milieu.
15.2 FDG-PET/CT Imaging of Oncologic Processes and Inflammation
The commonly employed PET/CT imaging agent, 18F-fluorodeoxyglucose (FDG), is clinically used for identification of neoplasms, screening of tumor metastases, and assessment of response to antineoplastic therapies. Additionally, FDG-PET/CT imaging has been demonstrated to be clinically useful for imaging of various sources of inflammation, including evaluation of device infection, fever of unknown origin, and sarcoidosis. Studies have shown that among the inflammatory cells, macrophages tend to have high uptake of FDG which is comparable to the amount of FDG uptake by tumor cell lines. Moreover, further investigations which were designed to reveal the source of intra-tumoral FDG uptake have demonstrated that the tumor-associated macrophages (TAMs) demonstrate even higher FDG uptake than the tumor cells [9] (Fig. 15.2). Accordingly, a substantial portion of the clinical utility of FDG-PET/CT scan for oncologic imaging relates to the uptake of FDG by macrophages.
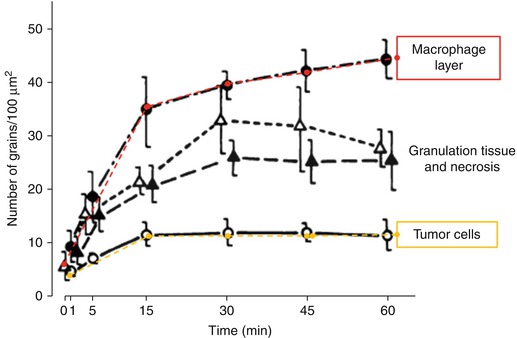

Fig. 15.2
High uptake of glucose analogs in tumor-associated macrophages. The uptake of tritium deoxyglucose ([ 3 H] DG) is demonstrated over time in intra-tumoral cellular components of mammary carcinoma in mice. [3H] DG uptake is determined by microautoradiographic silver grain counting (Adapted with permission from Kubota et al. [9])
The molecular mechanisms underlying FDG uptake by inflammatory cells have been well studied. FDG is a glucose analog that, similar to glucose, enters the cells through glucose transporters (GLUT), a group of membrane proteins that facilitate the transport of glucose over the plasma membrane. Within cells, FDG is phosphorylated by hexokinase to produce FDG-6-phosphate. Similarly, glucose is phosphorylated by the similar enzyme to become glucose-6-phosphate. Since the glucose-6-phosphatase enzyme is absent in most cells (except hepatocytes), the phosphorylated form of glucose/FDG cannot efflux from the cell. Glucose-6-phosphate, which is the natural substrate for the glycolysis pathway, becomes further phosphorylated and participates in glycolysis. However, FDG-6-phosphate is unable to participate further in glycolysis and thus accumulates within cells; hence, FDG accumulates in the cells and the quantity is in accordance with the rate of glycolysis (Fig. 15.3).
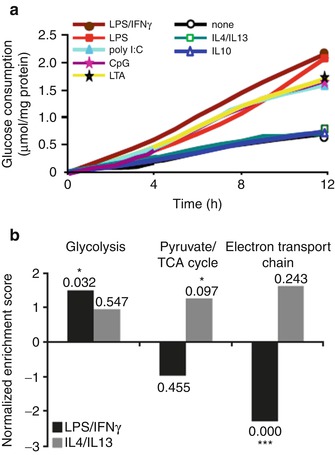

Fig. 15.3
Glycolytic flux in activated macrophages. (a) Metabolic flux (glucose uptake) is demonstrated in macrophages stimulated through the classic activation (induced by lipopolysaccharide and interferon-γ) and alternative activation pathways (induced by IL-4, IL-10, and IL-13). The time course of glucose consumption was determined by sampling the culture medium at periods of 2 h. (b) Gene set enrichment analysis. The normalized enriched scores are shown in the bars. Positive scores indicate upregulated genes, whereas negative normalized enriched scores correspond to downregulated genes (Modified with permission from Rodriguez-Prados et al. [10])
A broad body of research extending over three quarters of a century shows that myeloid cells including macrophages are highly dependent on glycolysis for energy metabolism [11, 12]. In resting macrophages, ATP is generated through the glycolytic and mitochondrial pathways in roughly equal proportions. Activated macrophages manifest a substantial upregulation of ATP production, the vast majority of which is produced through glycolysis. Further, the manner of macrophage stimulation has a significant impact on glycolytic flux [13]. While innate or classic activation (proinflammatory activation or M1 polarization) leads to increased glycolysis, alternative activation (anti-inflammatory activation or M2 polarization) does not [13]. Additionally, with M1 polarization, there is an upregulation of genes which encode glycolytic enzymes, which is accompanied by a downregulation of the genes that encode tricarboxylic acid cycle (TCA) and electron transport chain (ETC) proteins. The opposite occurs with M2 polarization (Fig. 15.4). In congruence with these findings, compared to resting macrophages, deoxyglucose uptake is increased in M1-polarized macrophages but is decreased in M2-polarized macrophages (Fig. 15.5) [14]. It should be noted that these findings are not without controversy. One study suggested that hypoxia, more than proinflammatory activation, drives macrophage glycolysis [16]. However, multiple groups have demonstrated that hypoxia itself is an important driver of both macrophage proinflammatory activation and glycolysis [17]. Moreover, it has been reported that across varying oxygen tensions, including hypoxic conditions, and through varying macrophage stimulatory conditions, a tight relationship exists between glycolytic flux and macrophage proinflammatory activation (measured as TNF alpha production) [18]. Accordingly, the glycolytic rate of macrophage-rich tissues (as assessed by FDG uptake) may provide an index of state of proinflammatory activation.
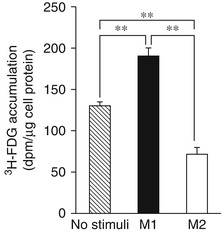
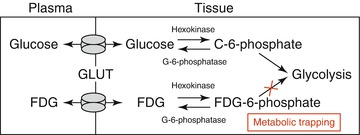

Fig. 15.4
Intracellular 3H-FDG accumulations in human macrophages. Compared to un-stimulated macrophages, classically stimulated macrophages (M1 polarized) accumulate higher amounts of FDG, whereas in the alternatively stimulated macrophages (M2 polarized), the amount of FDG uptake is lower than un-stimulated macrophages (Modified with permission from Satomi et al. [14]. (Asterisks indicate statistical significance)

Fig. 15.5
Metabolic trapping of fluorodeoxyglucose. Fluorodeoxyglucose (FDG) enters the cells through glucose transporters (GLUT) and becomes phosphorylated by hexokinase to produce FDG-6-phosphate. Similarly, glucose is phosphorylated by the similar enzyme to become glucose-6-phosphate. Glucose-6-phosphate, which is the natural substrate for the glycolysis pathway, becomes further phosphorylated and participates in glycolysis. However, FDG-6-phosphate is unable to participate further in glycolysis and thus accumulates within cells; hence, FDG accumulates in the cells and the quantity is in accordance with the rate of glycolysis (Adapted with permission from Rudd et al. [15])
Given FDG accumulation in inflammatory cells, it follows that it may be useful for imaging inflammation. Indeed, in addition to its use as a tracer to characterize oncologic processes, FDG is clinically used for imaging of inflammation and infection. The clinical use of FDG-PET/CT for imaging of inflammation has substantially grown over the years, and recent guidelines provided by the Society of Nuclear Medicine and Molecular Imaging as well as the European Association of Nuclear Medicine suggest the clinical use of FDG imaging of inflammation and infection [19]. The current major inflammatory indications for FDG-PET/CT imaging include evaluation of fever of unknown origin, suspected spinal infections, vasculitides, osteomyelitis, sarcoidosis, device and prosthetic infections, and endocarditis [20].
15.3 FDG-PET/CT Imaging of Arterial inflammation
Imaging of atherosclerotic inflammation using FDG-PET was initially reported in humans in 2002 by Rudd et al. [21]. In their landmark study of individuals with recent strokes, they observed higher FDG uptake in the wall of the symptomatic carotid artery (compared to the contralateral carotid artery plaques; Fig. 15.6). In an analysis of an excised carotid plaque that was incubated with tritiated deoxyglucose, the authors furthermore observed that deoxyglucose localized to foamy macrophages within the lipid core, suggesting that the FDG signal may be reporting on macrophages. Thereafter, several groups reported in animal models that arterial FDG uptake correlates with inflammation which was confirmed by histology [22, 23]. Further, it was soon after shown in humans that PET imaging of FDG uptake within human carotid arteries provided an index of atherosclerotic plaque inflammation [24]. In that study, the authors measured the FDG uptake in carotid plaques of individuals who subsequently underwent carotid endarterectomy. They assessed the correlation between FDG uptake and the macrophage content, measured as CD68 staining by histopathology, on the same plaques that were excised during endarterectomy. In that study, the authors observed a significant correlation between FDG uptake and the macrophage content (Fig. 15.7). Several groups have replicated this observation, and some extended the concept by demonstrating that FDG uptake in the arterial wall also relates to the expression of proinflammatory genes [25, 26].
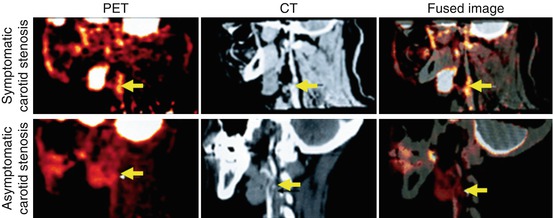
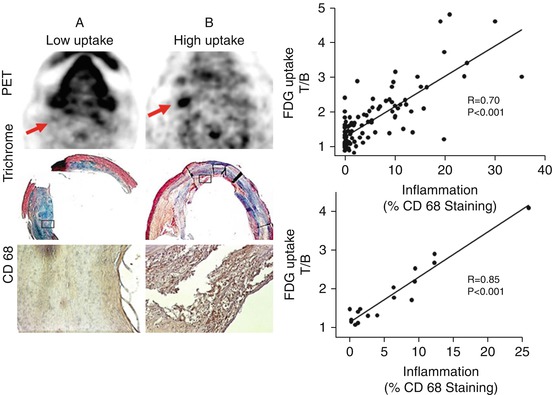

Fig. 15.6
FDG-PET/CT imaging of arterial inflammation. The top row (from left to right) shows PET, contrast-enhanced CT, and co-registered PET/CT images. These images are obtained from a 63-year-old man who had experienced two episodes of left-sided hemiparesis. The bottom row demonstrates a low level of FDG uptake in an individual with an asymptomatic carotid stenosis (Modified with permission from Rudd et al. [21])

Fig. 15.7
FDG-PET imaging and macrophage content of atherosclerotic plaques. Axial positron-emission tomography (PET) images from two patients are demonstrated: Patient A manifested low FDG uptake in the region of the carotid plaque, whereas patient B had a high FDG uptake in that region. The region of the excised carotid plaque is noted with arrows. In patient A, the corresponding trichrome-stained histologic specimen demonstrates a collagen-rich plaque with low lipid content, and CD68 staining on the high-powered images demonstrates limited macrophage infiltration. In patient B, the corresponding trichrome-stained histologic specimen demonstrates a complex plaque with a necrotic core, and the CD68 staining demonstrates intense macrophage infiltration. The boxes in the trichrome-stained images indicate the regions corresponding to the high-powered CD68 stains. The scatter plots demonstrate that carotid plaque FDG uptake in carotid plaques significantly correlated with histologic measure of inflammation in the corresponding sections taken during carotid endarterectomy (Modified with permission from Tawakol et al. [24])
The accumulation of FDG within the arterial wall is inhomogeneous, as would be expected given the inhomogeneous distribution of atherosclerotic plaques and various stages of different atherosclerotic plaques. Figueroa et al. observed that arterial FDG uptake is especially prominent within the plaques that have morphological features suggestive of high-risk potential [27]. In their study, they recruited patients who were scheduled for carotid endarterectomy and performed arterial FDG-PET/CT and contrast-enhanced CT imaging prior to the procedure. They characterized plaque morphology using CT of the carotid arteries and defined high-risk morphological features as plaques with ulceration, low attenuation (which indicates lipid-rich locations), or positive remodeling. These features were selected based on a wealth of clinical data suggesting that those features are associated with an increased risk of subsequent plaque rupture and stroke. Additionally, following carotid endarterectomy, the carotid plaques were examined histopathologically. The authors demonstrated that the distribution of FDG uptake within the carotid arteries was heterogeneous; however, the amount of the FDG that localized to the arterial wall was associated with presence of atherosclerotic plaques. Moreover, they demonstrated that arterial inflammation as assessed by FDG uptake was higher in plaques with high-risk morphological features and depends on the number of high-risk features that each plaque contains (Fig. 15.8). Similarly, the macrophage staining present within those plaques (as measured histopathologically after endarterectomy) also correlated with the number of high-risk morphological features. Accordingly, FDG uptake relates to both inflammation and the presence of high-risk morphological features, which are in turn interrelated.
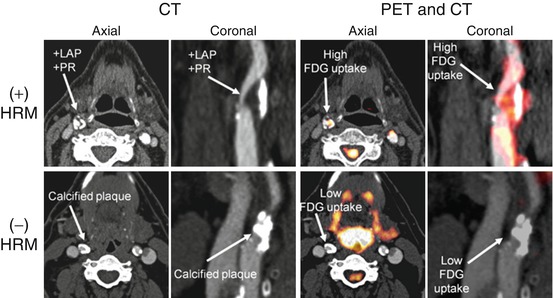

Fig. 15.8
Distribution of FDG uptake correlates with high-risk morphology of atherosclerotic plaques. Axial and coronal sections of computed tomography (CT) and positron-emission tomography/computed tomography (PET/CT) are demonstrated. Top row demonstrates that FDG uptake is higher in the regions of carotid artery with high-risk morphology (HRM) in the atherosclerotic plaques. Low-attenuation plaques (LAP) with positive remodeling (PR) are considered as HRM. The bottom row demonstrates that a predominantly calcified plaque without high-risk morphological feature (HRM) is associated with lower FDG uptake (Modified with permission from Figueroa et al. [27])
15.4 Relationship Between Arterial Inflammation, Disease Progression, and Risk of Cardiovascular Events
Arterial inflammation has been shown to be predictive of subsequent plaque progression in human studies. Abdelbaky et al. observed that arterial wall locations with underlying inflammation (by FDG-PET/CT) subsequently manifested greater arterial calcification (quantified by CT imaging), compared to the locations with less inflammation [28] (Fig. 15.9). In that study, the authors observed that arterial FDG uptake was a strong predictor of subsequent arterial calcification (odds ratio [95 % CI] = 2.59 [1.18–5.7]) after adjusting for other cardiovascular risk factors (e.g., age, hypertension, and dyslipidemia). Similarly, Fayad et al. demonstrated in a large prospective study that arterial segments with increased arterial inflammation (by PET/CT) experienced more volumetric expansion (measured by MRI) over the ensuing 18 months compared to segments with reduced inflammation [29]. These studies present insights about the local consequences of arterial inflammation and thus provide a plausible explanation for observed increased risk of atherothrombotic events in individuals with heightened arterial inflammation.
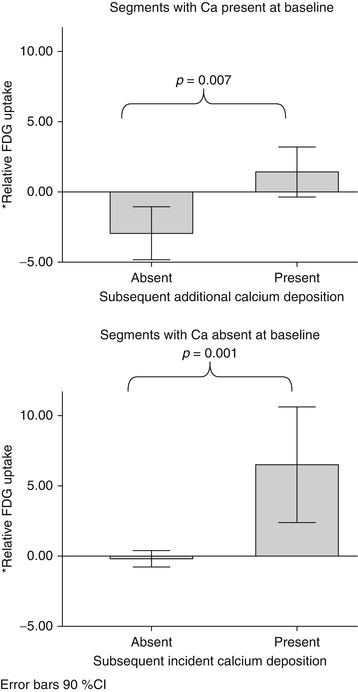

Fig. 15.9
Arterial inflammation and progression of atherosclerosis. This study evaluated the relationship between baseline arterial inflammation and subsequent calcification of the atherosclerotic plaques. The authors used a within-patient analysis where the segmental FDG uptake was expressed relative to the mean FDG uptake for the entire aorta within which that segment resides (as the percent difference between the individual segment SUV and the mean SUV of the whole aorta). They demonstrated that within each patient, the relative baseline SUV was higher in segments that manifested subsequent calcification. This held true in subset analyses of segments with calcium present at baseline (P = 0.007) and segments without calcium at baseline (P = 0.001) (Adapted with permission from Abdelbaky et al. [28])
Measures of arterial inflammation may provide an index of the risk of subsequent atherothrombotic events. In an early retrospective study of individuals who had undergone FDG-PET/CT imaging for clinical (mostly oncologic) indications, Rominger et al. initially demonstrated that arterial inflammation (FDG uptake) was predictive of event-free survival over a 40-month period [30]. However, that particular study did not identify the degree to which imaging of arterial inflammation may add to risk prediction over the standard risk prediction tools such as the Framingham Risk Score (FRS). Indeed, studies have demonstrated an association between FRS and arterial inflammation (FDG uptake) [31]. Recently, one study evaluated the degree to which imaging measures of arterial inflammation (FDG-PET/CT imaging) may refine assessment of risk of cardiovascular beyond the FRS calculation [32]. In a study of 513 individuals who had undergone imaging for clinical indications but who were deemed to be free of active oncologic disease, FDG-PET/CT images were retrospectively analyzed. The authors of that study observed that arterial inflammation (measured as FDG uptake) independently predicted the risk of subsequent cardiovascular disease events. Moreover, they reported a net reclassification improvement of 27.5 % over FRS, with 12.7 % of events correctly reclassified and 14.8 % of nonevents correctly reclassified using noninvasive imaging (Fig. 15.10). Additionally, an association between vascular inflammation and the timing of cardiovascular events was observed, whereby individuals with events occurring within 6 months of imaging had the highest amount of FDG uptake in the index imaging. In contrast, the individuals with more remote events had lower initial arterial inflammatory signals, while those who never developed cardiovascular events had the lowest FDG uptake. In a separate small prospective study of 60 individuals with ischemic stroke, Marnane et al. sought to evaluate whether carotid FDG uptake after a stroke was associated with the risk of short-term (90 days) stroke recurrence. They found that in a Cox regression model including age and degree of stenosis (50–69 % or 70 %), mean plaque FDG uptake was the only independent predictor of stroke recurrence (adjusted hazard ratio, 6.1; 95 % CI, 1.3–28.8; p = 0.02) [33]. While these studies suggest a promising role for PET/CT imaging in risk assessment and stratification in various patient populations, large prospective studies are needed to confirm these findings.
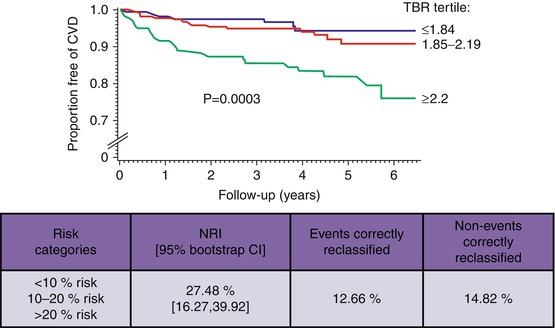

Fig. 15.10
Quantification of arterial inflammation improves the risk assessment of cardiovascular events. Arterial FDG uptake (target-to-background ratio, TBR) is demonstrated to have a significant association with the risk of subsequent cardiovascular events. Moreover, authors showed that it improves the reclassification by 27 % when combined with the Framingham Risk Score (FRS) (Modified with permission from Figueroa et al. [32])
15.5 PET/CT Measures of Arterial Calcification
Large studies have demonstrated that measures of coronary artery calcification, such as the coronary calcium score (assessed by CT), provide potent prediction of subsequent incident cardiovascular events [34]. Molecular imaging has been used to identify calcification of atherosclerotic plaques as well. 18F-sodium fluoride (18F-NaF), which localizes formation of hydroxyapatite crystals in very early stages, has been suggested as a tracer for vascular imaging. Recently, Joshi et al. demonstrated that PET/CT imaging using 18F-NaF might introduce a promising role for this noninvasive imaging modality to identify and localize high-risk coronary plaques [35] (Fig. 15.11). However, the relationship between 18F-NaF uptake and the risk of cardiovascular events is yet undefined. Furthermore, it is still unknown whether arterial 18F-NaF uptake provides an independent measure of risk when added to CT measures of calcium deposition such as the Agatston score. Dweck et al. have employed 18F-NaF PET/CT imaging to identify active calcification and disease progression in aortic valve [36]. It is worth noting that these studies are performed in small patient populations and require larger studies to confirm their findings.
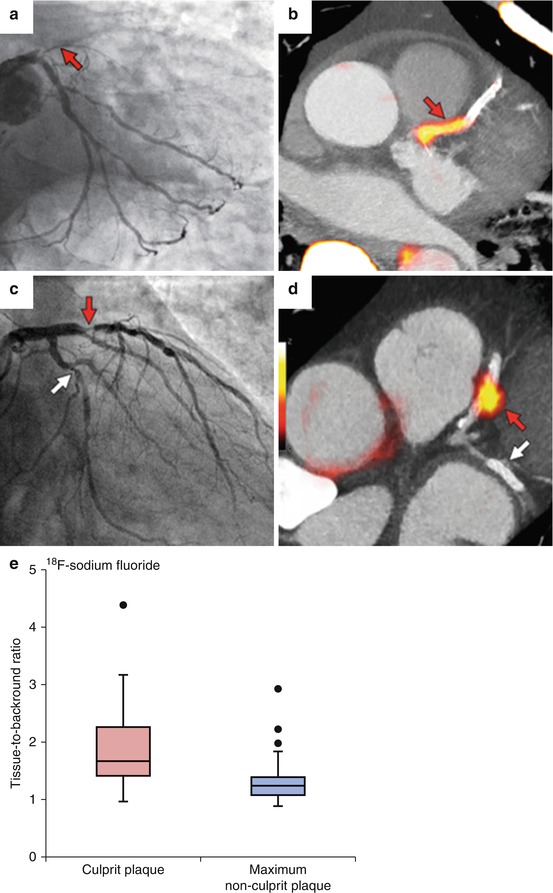

Fig. 15.11
PET/CT imaging of coronary arteries. 18F-sodium fluoride ( 18 F-NaF) is a tracer that localizes formation of hydroxyapatite crystals in very early stages. (a) Significant stenosis of proximal segment of left anterior descending coronary artery (LAD) by invasive angiography; (b) high uptake of 18F-NaF in the same coronary segment; (c) culprit lesion (red arrow; LAD) in a patient with non-ST elevation myocardial infarction and bystander non-culprit lesion (white arrow; circumflex artery) that were both stented during the admission; (d) only the culprit lesion had increased 18F-NaF uptake PET/CT. (e) Box plot demonstrates that 18F-NaF uptake was significantly higher in culprit coronary lesions compared with non-culprit lesions (Modified with permission from Joshi et al. [35])
15.6 Utility of Noninvasive Imaging of Arterial Inflammation to Assess Effectiveness of Therapies
Arterial inflammation (FDG uptake using FDG-PET/CT imaging) is rapidly modifiable by interventions. Two preclinical studies evaluated the rate of change in arterial inflammation (using FDG-PET/CT) after pharmacotherapy. In one study, atherosclerotic inflammation decreased substantially within 2 days after administration of an anti-inflammatory drug [37]. Conversely, arterial FDG uptake increased within 3 days after administration of a proinflammatory cytokine [38]. Taken together, these preclinical findings show that arterial inflammation can be rapidly modified through anti-atherosclerotic pharmacotherapy.
Arterial inflammation (FDG uptake) in the atherosclerotic plaques must be relatively stable and reproducible in order to be qualified as a monitoring tool for assessment of anti-atherosclerotic treatment effects. Rudd et al. demonstrated in 20 individuals with clinical cardiovascular disease that imaging measure of arterial inflammation by FDG-PET/CT scan is reproducible [39]. They prospectively enrolled study subjects and performed PET imaging at two timepoints 2 weeks apart and concluded that in patients with stable atherosclerosis who received stable treatment, the FDG signal was highly reproducible (Intraclass Correlation Coefficients of 0.79–0.92 and interobserver agreements of 0.92–0.97). Accordingly, the high sensitivity of FDG-PET/CT imaging for detection of treatment effects, along with its reproducibility under stable conditions in humans, provides rationale for use of FDG-PET/CT imaging to assess anti-inflammatory therapies.
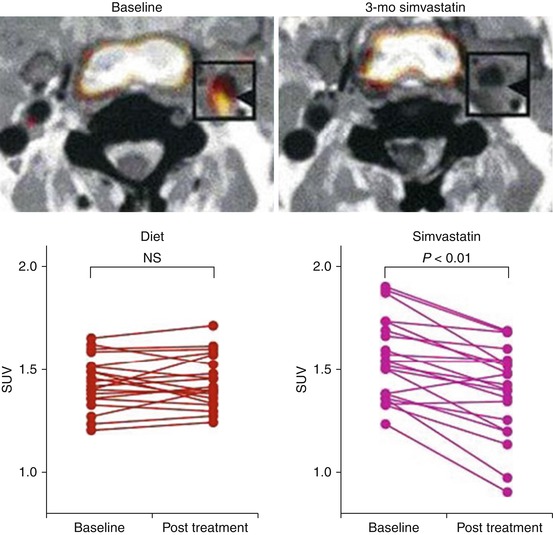
FDG-PET/CT has been used to study anti-atherosclerotic therapeutic interventions in several human studies. Tahara et al. published the first human study to evaluate the impact of a pharmacologic intervention on arterial inflammation as measured by FDG-PET/CT imaging [40]. Using a single-center open-label study design, they compared simvastatin (5–20 mg) to diet management. By 3 months, arterial inflammation (FDG uptake) was significantly reduced in the simvastatin group compared to the group that was assigned to the diet management (Fig. 15.12). More recently, the anti-inflammatory effect of statins on arterial inflammation was studied in a multicenter double-blind trial [41]. In that study, 83 adults who were at risk or with established clinical atherosclerosis and were not taking high-dose statins were randomized to atorvastatin 10 mg versus 80 mg. Arterial FDG-PET/CT imaging was performed at baseline, 4 weeks, and 12 weeks after randomization. The authors reported that high-dose atorvastatin (80 mg daily) resulted in a significant relative reduction in arterial inflammation compared to atorvastatin 10 mg and that the reductions from baseline were seen as early as 4 weeks after randomization (Fig. 15.13). Most recently, the effect of non-pharmacologic lipid lowering on arterial inflammation was evaluated. In a study of individuals with familial hypercholesterolemia (FH), lipid lowering by lipoprotein apheresis resulted in a substantial reduction in arterial inflammation (FDG-PET/CT imaging) within 1 week of the intervention [42].
