where SUV is the standardised uptake value over t, t is the time of measurement, c is the radioactivity of the tissue within the region of interest, a is the decay corrected injected activity and w is either body weight, lean body weight or body surface area. All voxels in the volume of interest have a separate SUV, and most software packages will quote their mean, minimum, maximum and standard deviation. It has also become conventional to normalise tissue SUV to image-derived blood pool activity (normally from the caval or atrial lumen) to generate a tissue-to-background ratio:

10.3 CAVD Pathology and PET Radiotracer Choice
Although still deficient, our current understanding of the pathophysiology of CAVD indicates that this process is triggered and then maintained by a complex interplay of multiple risk factors and noxious stimuli. These include hypertension, diabetes mellitus, hyperlipidaemia, systemic inflammation, oxidative stress and abnormal valvular mechanical stresses and reduced shear stresses (see Fig. 10.1). These factors combine to produce chronic endothelial injury and dysfunction that lead to the initiation of certain key pathological processes within the valve itself: inflammation, angiogenesis, hypoxia, necrosis, apoptosis, fibrosis and calcification. These processes in turn interact with each other to drive valvular stiffening and narrowing with eventual ventricular hypertrophy, fibrosis and failure. A full review of the pathophysiology is beyond the scope of this chapter, but for further reading, see New et al. [8], Dweck et al. [9], New et al.[10] and Miller et al. [6].
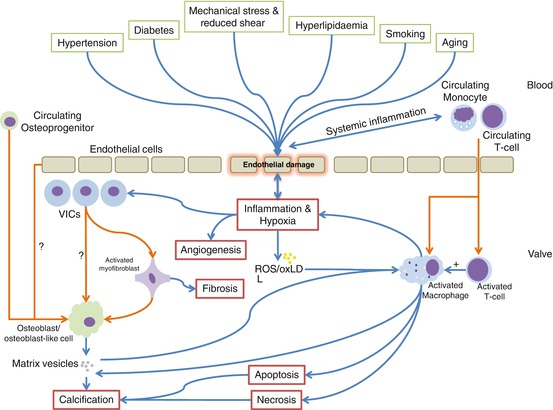

Fig. 10.1
Graphical representation of the key risk factors, triggers and pathological processes in CAVD. Processes and influences are represented by blue arrows, and cellular migration, differentiation or phenotypic switch by orange arrows (Adapted from Miller et al. [6] and Dweck et al. [7]). ROS reactive oxidant species, oxLDL oxidised low-density lipoprotein
All of these noxious stimuli and pathological process represent potential therapeutic and molecular imaging targets. This is indeed the reason that PET/CT provides such a rich source of potential avenues for research and development: disease biology, disease progression and response to novel therapy may all be explored simultaneously. However, whilst tracers targeting a wide range of pathological processes might potentially be of use in aortic stenosis (see Table 10.1), this review will concentrate on the two that have developed a track record in this condition: 2-deoxy-2-(18F)fluro-D-glucose (18F-FDG) and 18F-fluoride (delivered as sodium fluoride; 18F-NaF). These tracers are believed to demonstrate intra-valvular inflammation and active calcification, respectively, and aside from targeting two of the most important disease processes driving aortic stenosis, they also have the key advantage of being easy to manufacture and commercially available, facilitating their easy uptake and widespread use as novel research and future clinical tools.
Table 10.1
Potential relevant positron-emission tomography radiotracers in calcific aortic valve disease
Pathological process | Target example | PET ligand |
|---|---|---|
Inflammation | Glycolysis | 18F-FDG |
Translocator protein | 11C-PK11195 | |
Somatostatin receptor | 68Ga-DOTATATE | |
Hypoxia | Hypoxic tissue | 18F-MISO |
62Cu-ATSM | ||
Fibrosis | AlphaVbeta3 integrin | 18F-galacto-RGD |
18F-fluciclatide | ||
Angiogenesis | AlphaVbeta3 integrin | 18F-galacto-RGD |
18F-fluciclatide | ||
Apoptosis | Phosphatidylserine | 18F-annexin V |
Calcification activity | Apatite nanocrystals | 18F-fluoride |
10.4 PET/CT for Imaging Inflammation in CAVD
10.4.1 Background
As a result of its ubiquity, 18F-FDG remains the only putative PET marker of inflammation to have been investigated in clinical studies of CAVD, although other markers, including 68Ga-DOTATATE and 11C-PK11195, have been evaluated in atherosclerosis. 18F-FDG was first administered to humans in 1976 [11] with the aim of demonstrating cerebral and total body glucose utilisation. Cells with high metabolic demand express large quantities of various GLUT transporter subtypes and metabolise glucose quickly thus generating a gradient across the cell membrane that causes a continuous large influx of glucose. 18F-FDG directly competes with glucose for transportation by GLUT and then undergoes phosphorylation to 18F-FDG-6-phosphate by hexokinase. Owing to the strict specificity of phosphoglucose isomerase for glucose-6-phosphate, 18F-FDG-phosphate is not altered and is unable to progress down the glycolytic pathway. It thus becomes trapped within the cell and its continuing accumulation allows detection by the PET. 18F-FDG is thus able to identify clusters of cells with very high rates of glucose uptake. Consequently, 18F-FDG is not specific to one cell type but will accumulate in any cell with increased metabolic demand, e.g. neurons, active muscle cells, neoplastic cells and activated inflammatory cells. In PET imaging of atherosclerosis, pioneered by Rudd [12], Fayad [13] and Tawakol [14], it was hypothesised that macrophages, the key players in the inflammatory milieu of the high-risk plaque, were responsible for the observed signal. This was evidenced in Rudd’s original paper using tritiated deoxyglucose autoradiography. Others have demonstrated a correlation between plaque SUV and CD68 macrophage immunohistochemical staining in humans [15]. These data complement observations that macrophages have high baseline levels of glycolysis [16] that increase dramatically when the cell becomes activated [17]. This may be particularly germane in the hypoxic environment of the plaque where glycolysis may be the only pathway available for the generation of ATP [18]. Indeed recent preclinical and clinical data have suggested that hypoxia may be the most important factor governing the uptake of 18F-FDG by macrophages [19,20]. Whether it is inflammation, hypoxia or a combination of both driving increased GLUT expression by macrophages, a growing body of clinical studies indicates that 18F-FDG highlights a pathological, hypermetabolic state in the arterial wall that appears to improve with statin therapy [21]. Moreover, it seems highly likely that similar mechanisms should also govern 18F-FDG uptake in the aortic valve.
10.4.2 Clinical Studies
To date, only two published studies have examined the use of 18F-FDG in the imaging of valvular glycolytic activity [7,22]. The first published report of 18F-FDG uptake in the aortic valve was produced by Marincheva-Savcheva and colleagues in 2011 [22]. This was a retrospective study of patients having whole body 18F-FDG PET/CT for oncological staging. The group identified a cohort of 42 patients with a diagnosis of CAVD and age matched these patients to a second cohort of 42 cancer patients without CAVD. Patients with CAVD were stratified into echocardiographically mild, moderate and severe groups. A semi-quantitative assessment of CT valvular calcification was made. PET scans were manually registered with CT scans and ROIs were drawn in the centre of the aortic valves (to minimise overspill from myocardial uptake). Tissue-to-background ratios were computed by normalising valvular SUVs to blood pool uptake in the right atrium. Intra- and inter-observer reproducibility studies were undertaken, and in a subgroup, the authors addressed the ability of 18F-FDG to predict disease progression.
To date, our group has performed the largest prospective study of PET/CT 18F-FDG imaging in patients with CAVD [7]. A total of 121 patients were recruited and were representative of the full spectrum of CAVD severity including 20 subjects with aortic valve sclerosis and 20 age- and sex-matched controls with normal aortic valves. Baseline echocardiography was performed along with dedicated 18F-FDG and 18F-fluoride PET/CT imaging and CT calcium scoring of the aortic valve [23]. Patients were also asked to adhere to a carbohydrate-free diet prior to their 18F-FDG scan in order to minimise myocardial uptake by encouraging the heart to switch from glucose to free fatty acid metabolism. PET/CT analysis was undertaken using dedicated PET/CT analysis software (OsiriX version 3.5.1 64 bit; OsiriX Imaging Software, Geneva, Switzerland). This permitted the automated registration and multiplanar reformatting of PET and CT imaging data, which in turn afforded the opportunity to explore and optimise the image analysis technique (see Fig. 10.2). In addition, extensive reproducibility studies were undertaken.
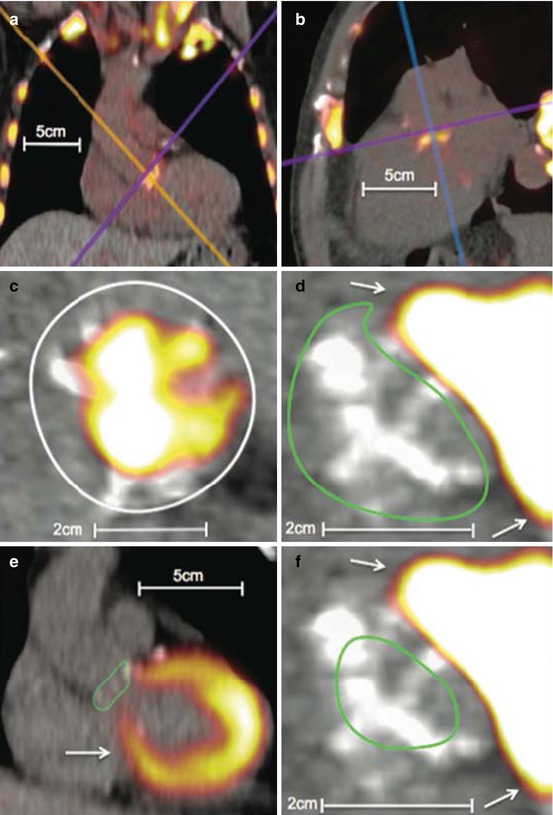

Fig. 10.2
Examples of 18F-fluorodeoxyglucose and 18F-fluoride uptake in the aortic valve. 18F-fluoride (a–c). (a) Coronal view of the thorax. 18F-NaF uptake is apparent in the aortic valve as well as visible bones and the aortic arch. (b) Modified sagittal view of the valve. (c) A coaxial short-axis view of the aortic valve (purple axis). The white circle is an example of a region of interest drawn on an 18F-NaF scan.18F-flurodeoxyglucose (d–f). (d) A coaxial view of the aortic valve (purple axis) with significant myocardial overspill rendering quantification troublesome. A region of interest has been drawn using the short-axis technique (green circle). (e) Long-axis view of the heart and aortic valve (blue axis). A region of interest has been drawn using the long-axis technique (green circle). The myocardial uptake is obvious and the difficulties in quantifying valvular 18-fluorodeoxyglucose apparent. (f) Same image as (d) but employing the centre of valve technique for valvular SUV quantification with the region of interest drawn as a (green circle). All white arrows represent myocardial uptake of 18F-FDG spilling over onto the valve
10.4.3 Relationship Between FDG Uptake and Lesion Severity
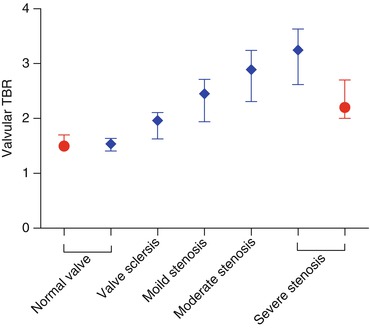
The key finding from Marincheva-Savcheva’s study was that aortic valve 18F-FDG uptake was significantly higher in CAVD patients compared to controls (median TBR 1.53 (1.42–1.76) vs. 1.34 (IQR: 1.20–1.55); P < 0.001). There was also an apparent increase in 18F-FDG uptake upon moving from mild to moderate aortic stenosis (1.50 [1.36–1.75] vs. 1.70 [1.52–1.94]). However, interestingly 18F-FDG uptake reduced again in those with severe disease (1.51 [1.38–1.54]), leading the authors to conclude that CAVD occurs in two distinct stages: an early principally inflammatory stage followed by a second stage, decoupled from inflammation and dominated by a process of active calcification reminiscent of osteogenesis [24].
Our findings largely reproduced those of Marincheva-Savcheva, in that we observed a steady although modest positive correlation between 18F-FDG uptake by all measures and aortic stenosis severity but did not see the fall in 18F-FDG uptake in patients with the most severe lesions (Table 10.2). This discrepancy may be attributable to the small number of patients in the first study, the problems with reproducibility in one study or unaccounted differences in study populations such as cancer. The summary findings of both studies are shown in Fig. 10.3. It should be noted that in both trials large overlaps in TBR ranges between groups were observed, indicating that, although statistical differences were present, the ability of 18F-FDG to distinguish between categories with confidence is limited.
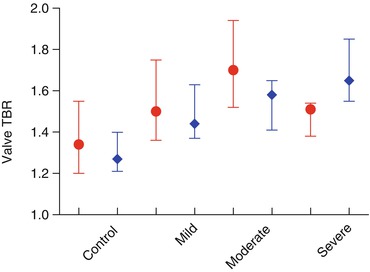
Table 10.2
Quantification of radiotracer uptake from Dweck 2012 and correlation against aortic stenosis severity
Aortic stenosis | Correction with peak aortic jet velocity | ||||||
|---|---|---|---|---|---|---|---|
Control | Aortic sclerosis | Mild | Moderate | Severe | r 2 | P | |
18F-NaF | |||||||
Mean SUV | 1.20 (1.10–1.55) | 1.35 (1.24–1.59) | 1.59 (1.38–1.73) | 1.82 (1.67–2.05) | 2.10 (1.78–2.51) | 0.461 | <0.001 |
Mean TBR | 1.23 (1.20–1.36) | 1.53 (1.34–1.59) | 1.73 (1.45–1.92) | 2.03 (1.71–2.28) | 2.17 (1.82–2.36) | 0.534 | <0.001 |
Maximum SUV | 1.54 (1.33–1.86) | 1.77 (1.58–2.09) | 2.21 (1.84–2.45) | 2.57 (2.27–2.99) | 3.25 (2.47–4.42) | 0.551 | <0.001 |
Maximum TBR | 1.56 (1.41–1.64) | 1.96 (1.63–2.11) | 2.45 (1.94–2.71) | 2.89 (2.31–3.24) | 3.25 (2.65–3.63) | 0.540 | <0.001 |
Patients with increased uptake % | 0 | 45 | 76 | 95 | 100 | – | – |
18F-FDG | |||||||
Mean SUV | 1.49 (1.33–1.56) | 1.73 (1.46–1.88) | 1.66 (1.53–1.88) | 1.71 (1.61–1.91) | 1.76 (1.61–2.18) | 0.142 | <0.001 |
Mean TBR | 1.18 (1.09–1.26) | 1.35 (1.19–1.44) | 1.29 (1.21–1.45) | 1.33 (1.26–1.47) | 1.42 (1.36–1.62) | 0.203 | <0.001 |
Maximum SUV | 1.62 (1.47–1.68) | 1.91 (1.64–2.07) | 1.85 (1.72–2.07) | 1.95 (1.81–2.18) | 2.07 (1.88–2.25) | 0.213 | <0.001 |
Maximum TBR | 1.27 (1.21–1.40) | 1.47 (1.31–1.61) | 1.44 (1.37–1.63) | 1.58 (1.41–1.65) | 1.65 (1.55–1.85) | 0.218 | <0.001 |
Patients with increased uptake, % | 0 | 20 | 24 | 30 | 52 | – | – |

10.4.4 Predicting Outcome and Disease Progression
In a subgroup of patients with serial echocardiographic data available (n = 19), Marincheva-Savcheva showed that subjects with a valvular TBR greater than the median had a higher chance of progression: five of six patients with above median TBR progressed compared to two of nine patients with below median values. This result only just reached statistical significance (P = 0.04), and the binary definition of progression was loose (any increase in severity class in any of the echocardiographic criteria). We have recently published a 1-year follow-up data [25] in a small subgroup of our original cohort. Disappointingly the baseline 18F-FDG uptake failed to predict disease progression adjudicated by the change in calcium score, although this may reflect the small patient numbers and the relatively short follow-up in this study [25].
10.4.5 Reproducibility and Methodological Strengths and Weaknesses
The Marincheva-Savcheva study is important in terms of proof of principle but is limited by several factors. The study was necessarily retrospective, and the patients were not primarily selected on the basis of their cardiac disease. Moreover, the PET/CT protocols were neither standardised nor optimised for demonstrating intra-vascular or intra-valvular inflammation. The analysis was also limited by poor intra-observer reliability, with an intra-class correlation coefficient of 0.55 (95 % CI: 0.27–0.73), although, curiously, the inter-observer reliability was much better: intra-class correlation coefficient (ICC) = 0.97 (95 % CI: 0.96–0.98). Therefore, the results need to be interpreted with caution. Our group benefited from pre-specified and consistent PET/CT acquisition protocols, a prospectively recruited cohort and a standardised follow-up schedule. We explored multiple methods of analysing valvular 18F-FDG uptake and concluded, like Marincheva-Savcheva, that the ‘centre-valve’ approach produced the best intra- and inter-observer reliability with narrow limits of agreement [7]. In keeping with Marincheva-Savcheva findings, we also found that our analysis was significantly hampered by overspill of signal from myocardial tissue near the aortic annulus (see Fig. 10.2). This occurred despite dietary modification and may have contaminated the valvular signal. Furthermore, as with any PET image analysis of relatively small volumes, the absolute measured activities may have been reduced by partial voluming artefact. Finally we did not employ ECG or respiratory gating of the PET data, which are of benefit when examining the PET signal in the coronary arteries [26].
10.4.6 Validation of Valvular 18F-FDG Uptake
Our group has recently published work [25] that included some tissue validation experiments in 12 patients who had 18F-FDG PET imaging of their valve shortly before proceeding to aortic valve replacement. Excised valvular tissue was decalcified and then immunostained with a variety of antibodies including anti-CD68. There was good inter-observer repeatability for the immunohistochemical measure of CD68 staining (ICC = 0.99 [0.99–1.00]). We were however unable to demonstrate correlation between any index of 18F-FDG uptake and CD68 staining. This may reflect contamination of the valvular signal by myocardial activity. Alternatively, it is possible that valvular 18F-FDG uptake might reflect the metabolic activity of cells other than macrophages in stenotic aortic valves. Indeed this is particularly likely in the latter stages of the disease, studied in these experiments, where valve osteoblasts and fibroblasts are likely to be especially active. Further work is required to investigate this interesting hypothesis.
10.4.7 Summary
When compared to normal controls, aortic valves affected by calcific stenosis show evidence of increased glucose utilisation with the more severe lesions showing a greater accumulation of 18F-FDG. The exact mechanism underlying this observation in the aortic valve has not yet been demonstrated, but it seems likely that the 18F-FDG signal reflects more than simply inflammatory activity within the valve. Nevertheless 18F-FDG holds promise as a marker of metabolic activity and therefore disease activity in aortic stenosis, and whilst no apparent relationship was observed between its uptake and disease progression at 1 year, the 2-year follow-up from across the entire cohort is eagerly anticipated.
10.5 PET/CT for Imaging Calcification in CAVD
10.5.1 Background
18F-fluoride (delivered as a solution of sodium fluoride; 18F-NaF) was first mooted as a bone tracer in the seminal paper by Blau in 1972 [27]. It has since established a track record in PET imaging of bone metabolism and disease with an excellent safety record [28–43]. It has been used in humans to assess disease activity and indeed response to treatment in osteoporosis [29,33,35] and Paget’s disease [30,37]. By virtue of its rapid elimination, high target specificity and availability for binding, it has pharmacokinetic and pharmacodynamic properties that are ideally suited to imaging, resulting in a high target-to-background ratio [27,44].
It is often contended that 18F-NaF is a marker of bone deposition [43] or osteoblastic activity, but the reality is more complex [27,44,45]. Bone crystal is predominantly composed of calcium orthophosphate crystal that approaches mineral calcium hydroxylapatite. In purely physicochemical terms, the fluoride ion is incorporated onto the apatite surface by chemisorption and substituted for a hydroxyl group. In physiological conditions, this not a simple process with the original 4-step description by Blau still standing today. Fluoride must first be delivered to the bone by blood (1) and then leave the plasma to enter the extracellular fluid (ECF) (2). The fluoride will then enter the shell of bound water enveloping the crystal (3) before eventually undergoing full incorporation (4). Steps one and two are predominantly determined by blood flow. Steps three and four are however critically dependent upon the surface area of apatite available for incorporation. In bone, this relates to increased osteoblast and osteoclast activity. Osteoblasts generate matrix vesicles and the propagation of new regions of tiny nano-crystalline apatite particles, whilst osteoclasts promote the dissolution of solid blocks of established mineral. As a consequence 18F-NaF uptake reflects a combination of increased osteoblastic and osteoclastic activity, thus acting predominantly as a marker of bone turnover. Indeed this hypothesis is now firmly supported by a large and expanding body of experimental and clinical PET data [34,39–42,44].
Stay updated, free articles. Join our Telegram channel

Full access? Get Clinical Tree


